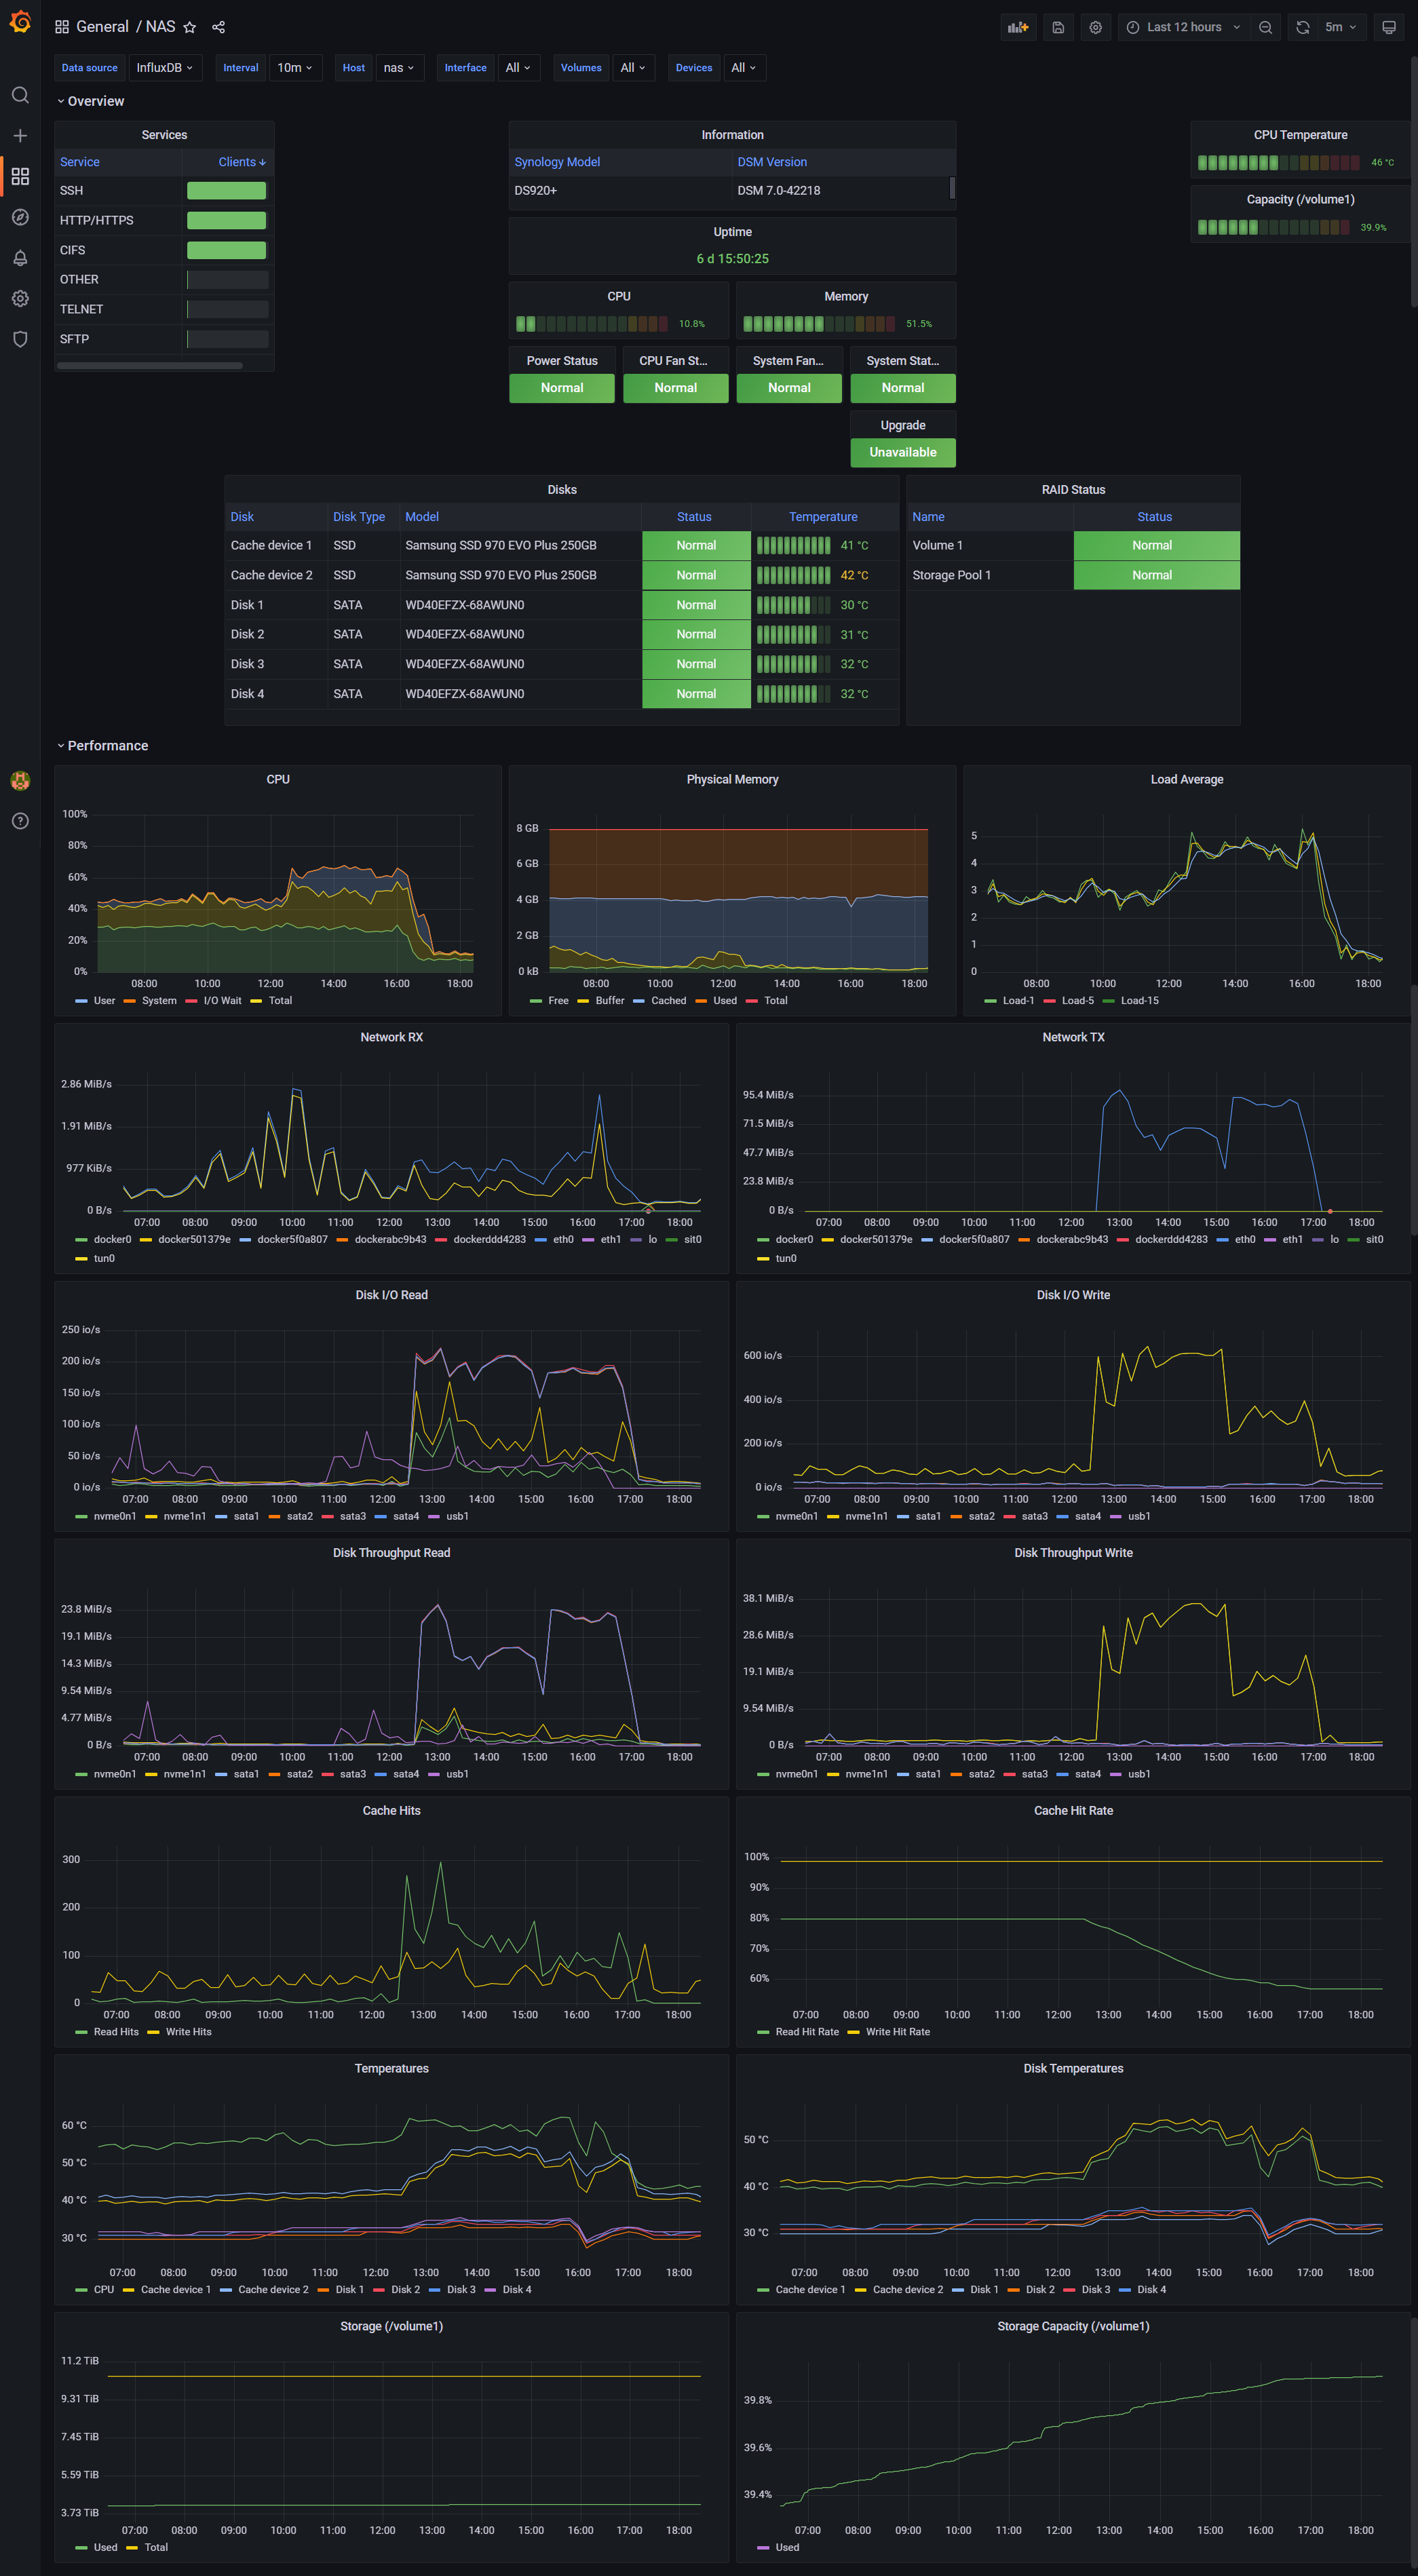
Configuration files and tutorial on how to monitor your Synology NAS using SNMP, Telegraf, InfluxDB and Grafana.
There are already few SNMP/Grafana monitoring solutions available. However, they are usually:
- outdated
- simply wrong (e.g. monitoring Docker's CPU & disk I/O instead of Synology NAS)
- full of hard coded values
- based on older InfluxDB 1 & InfluxQL
This Synology NAS monitoring uses InfluxDB 2 with Flux query language and the dashboard is configurable with virtually zero hard coded values.
Enable SNMP service on Synology NAS. In DSM:
Control Panel->Terminal & SMNP->SNMPtab- Check
Enable SNMP service - Check
SNMPv1, SNMPv2c service - Community:
public - Click
[Apply]
Warning: this setting is not secure, especially if your NAS is exposed to the Internet. For more security, choose different
Community(e.g. random string) or enable and configureSNMPv3 service. Note that if you changeCommunityor enableSNMPv3 service, you have to make appropriate changes to the Telegraf configuration. Please, consult the documentation.
- Install Docker
- Download
telegraf,influxdbandgrafana/grafanaimages from the Docker registry- Download
latesttag for all images
- Download
- Copy
telegrafandinfluxdbfolders from this repository into thedockershared folder on the NAS
In Advanced Settings:
- Advanced Settings
- Check
Enable auto-restart
- Check
- Volume
- Folder
docker/influxdb/var/lib/influxdb2->/var/lib/influxdb2(as read-write)
- Folder
- Network
- Check
Use the same network as Docker Host
- Check
- Envorinment
DOCKER_INFLUXDB_INIT_MODE->setupDOCKER_INFLUXDB_INIT_USERNAME->my-userDOCKER_INFLUXDB_INIT_PASSWORD->my-passwordDOCKER_INFLUXDB_INIT_ORG->NASDOCKER_INFLUXDB_INIT_BUCKET->telegraf
InfluxDB should be now available at http://your-nas:8086/.
In Advanced Settings:
- Advanced Settings
- Check
Enable auto-restart
- Check
- Volume
- File
docker/telegraf/etc/telegraf/telegraf.conf->/etc/telegraf/telegraf.conf(as read-only) - Folder
docker/telegraf/mibs->/mibs(as read-only)
- File
- Network
- Check
Use the same network as Docker Host
- Check
Before running the container:
- Edit
docker/telegraf/etc/telegraf/telegraf.confappropriately- In
[[outputs.influxdb_v2]], you must changeurls&token(eventuallyorganisation&bucketif you wish to change them)- InfluxDB token can be found on
http://your-nas:8086/, in theDatamenu (on the left), on theAPI Tokenstab, after clicking onmy-user's Token
- InfluxDB token can be found on
- In each instance of
[[inputs.snmp]], you must changeagents(you can choose IP or hostname)- You can specify multiple agents if you wish to monitor multiple NAS devices
- In
In Advanced Settings:
- Advanced Settings
- Check
Enable auto-restart
- Check
- Network
- Check
Use the same network as Docker Host
- Check
Grafana should be now available at http://your-nas:3000/.
Default credentials are admin:admin. After login, it will ask you for a new password.
After logging into Grafana web interface:
- Go to
Configuration->Data sourcesAdd data source->InfluxDBQuery Language->FluxHTTPURL->http://your-nas:8086
Auth- Disable
Basic auth - (Everything should be disabled in this group)
- Disable
InfluxDB DetailsOrganization->NAS(or whatever specified previously inDOCKER_INFLUXDB_INIT_ORG)Token-> Your InfluxDB token (as described above)Default Bucket->telegraf
- Click
[Save & test]
- Go to
Create [+]->Import(http://your-nas:3000/dashboard/import)- Click
[Upload JSON file] - Select
grafana/dashboard.json - Click
[Import]
- Click
If not selected by default, choose appropriate Data source at the top.
Content of this repository - except the telegraf/mibs folder - is open-source under the MIT license. See the LICENSE.txt file in this repository.
telegraf/mibs folder contains following files:
- Every file from the Synology_MIB_File.zip
HOST-RESOURCES-MIB.txt,IF-MIB.txt,SNMPv2-MIB.txt,SNMPv2-SMI.txtandUCD-SNMP-MIB.txtfrom the net-snmp github repository
If you find this project interesting, you can buy me a coffee
  BTC 3GwZMNGvLCZMi7mjL8K6iyj6qGbhkVMNMF
  LTC MQn5YC7bZd4KSsaj8snSg4TetmdKDkeCYk
