Bindings (PoC) for Microsoft WinDBG Time Travel Debugging (TTD).
This is for educational purposes only. Please consult and comply with the related Microsoft licensing
TTD/is the main wrapper.TTDReplay.dllandTTDReplayCPU.dll(from WinDBG Preview, at least v1.2111) must be present in the same directory than the executableexample_api/highlights some of the wrappingexample_diff/shows how to use the wrapping to perform naive trace diffingexample_calltree/produces a call tree of a trace excerptexample_cov/produces a Lighthouse compatible coverage of modules in a trace excerptexample_tenet/produces a Tenet compatible trace from a TTD tracepython-bindings/provides Python bindings over TTD
After performing one or several traces using Windbg Preview, one can open the .run file:
// Openning the trace
TTD::ReplayEngine ttdengine = TTD::ReplayEngine();
ttdengine.Initialize(L"D:\\traces\\demo.run");

// Retrieve information, such as the starting position
TTD::Position* first = ttdengine.GetFirstPosition();
printf("%llx:%llx\n", first->Major, first->Minor);

// Get a Cursor instance
TTD::Cursor ttdcursor = ttdengine.NewCursor();

// Set it to the first position
ttdcursor.SetPosition(first);

// Print the value of RCX
TTD::TTD_Replay_RegisterContext* ctxt = ttdcursor.GetCrossPlatformContext();
printf("RCX: %llx\n", ctxt->rcx);

// Make 3 step forward
TTD::TTD_Replay_ICursorView_ReplayResult replayresult;
TTD::Position* last = ttdengine.GetLastPosition();
ttdcursor.ReplayForward(&replayresult, last, 3);
Currently, the wrapping system supports:
- Openning a trace file
- Getting and setting the position
- Getting:
- Peb address
- Thread count
- Module list
- Program counter
- Registers
- Query memory
- Replaying forward and backward
- Adding a callback for "CallRet"
- Memory breakpoints (R/W/X)
- During a callback, getting:
- Returned value
- Current position
- Current PC
Objective: find which instruction actually check for PrimaryGroupID possibilities when setting one in an Active Directory. For more information, please read [this article].(https://github.com/commial/experiments/tree/master/windows/random_things/primaryGroupID)
First, a trace is made on the Domain controller's lsass.exe while attempting to:
- Set an un-authorized
PrimaryGroupIDto the usersimple - Set an authorized
PrimaryGroupIDon the usersimple
Then, the trace is loaded in Windbg Preview for analysis. We first find one of the entrypoint, for instance by looking at the callstack during some of the calls.
As a result, we saw that ntdsai!LDAP_CONN::ModifyRequest seems to be called when a LDAP request is made. This method is called twice, as expected:
The first time, it quickly fails; the second, it processes the request, taking more time.
Now, here is the strategy:
- Start from the first and the second call to
ntdsai!LDAP_CONN::ModifyRequest - Step some instruction for both, and observe the program counter
- If it differ, get back to the last known sync point, and step less instruction
- If it is the same, continue from the new position
Using this method, we quickly end in ntdll!RtlpAllocateHeap. Indeed, while browsing the heap chunks, they might be some differences (as new chunk have been allocated between the two calls).
We know this is a false positive. To avoid it, we can:
- Register a
CallReturnCallbackto track function calls and their return address - On detected diff, check if a function in the current call stack is in the allow-list and its corresponding return address is the same for both traces
- If it is, forward both traces to the return address, and consider it a new sync point
A stack of calls and return addresses is used, to handle cases such as:
f(
    subcall()
    diff_call(
        // Difference is here, we want to go out of `f`
    )
)
This implementation is available in example_diff.
In addition to allocation function, a few others functions are allow-listed, such as column reading APIs.
As a result, the actual diff is quickly found:
Openning the trace
Openning the trace2
STEP 10000
Trace 1: 177b:3f        | Trace 2: 6871:3f
Trace 1 ends on 7ffb0b9cdca0    | Trace 2 ends on 7ffb0b9f2e2b
Rollback...OK
STEP 5000
Trace 1: 177b:3f        | Trace 2: 6871:3f
Trace 1 ends on 7ffb10ec1b5c    | Trace 2 ends on 7ffb10ec1c4d
Rollback...OK
STEP 2500
Trace 1: 177b:3f        | Trace 2: 6871:3f
Trace 1 ends on 7ffb10ec1d9b    | Trace 2 ends on 7ffb10ec1d9b
STEP 2500
Trace 1: 1788:21a       | Trace 2: 687e:21a
Trace 1 ends on 7ffb10ec1b5c    | Trace 2 ends on 7ffb10ec1c4d
Rollback...OK
STEP 1250
Trace 1: 1788:21a       | Trace 2: 687e:21a
Trace 1 ends on 7ffb10ebfc88    | Trace 2 ends on 7ffb10ec1b06
Rollback...OK
STEP 625
Trace 1: 1788:21a       | Trace 2: 687e:21a
Trace 1 ends on 7ffb0ba1f327    | Trace 2 ends on 7ffb0ba1eef4
Rollback...OK
STEP 312
Trace 1: 1788:21a       | Trace 2: 687e:21a
Trace 1 ends on 7ffb10f568d0    | Trace 2 ends on 7ffb10ec3ed3
Rollback...OK

...

STEP 2
Trace 1: 1788:229       | Trace 2: 687e:229
Trace 1 ends on 7ffb10ec1de8    | Trace 2 ends on 7ffb10ec1ec9
Rollback...OK
STEP 1
Trace 1: 1788:229       | Trace 2: 687e:229
Trace 1 ends on 7ffb10ec1de5    | Trace 2 ends on 7ffb10ec1ec1
Rollback...OK
Last known sync reference: Trace 1: 1788:229    | Trace 2: 687e:229
Cur func: 7ffb10ec1af0 -> 7ffb10ebfcad | 7ffb10ec1af0 -> 7ffb10ebfcad
Common func/ret:
7ffb0ba1efa0 -> 7ffb0b9aa1bc
        7ffb0bc0c8bc -> 7ffb0ba1f245
                7ffb0b9b7a9c -> 7ffb0bc0c8ec
                        7ffb0b9d37a0 -> 7ffb0b9b7ad7
                                7ffb10ebf2a0 -> 7ffb0b9d38bc
-> Resync traces after their RET on 7ffb0b9d38bc...TRACE1 7ffb0b9d38bc......TRACE2 7ffb0b9d38bc
STEP 10000

...

Rollback...OK
Last known sync reference: Trace 1: 1ad2:43     | Trace 2: 6b7e:43
Cur func: 7ffb0ca01f10 -> 7ffb0bac294d | 7ffb0ca01f10 -> 7ffb0bac294d
Common func/ret:
7ffb0b9f2848 -> 7ffb0b9aa396
        7ffb0b9f33b0 -> 7ffb0b9f29c6
                7ffb0b9f35ac -> 7ffb0b9f34eb
                        7ffb0b9909f4 -> 7ffb0b9f389e
                                7ffb0b991bc8 -> 7ffb0b990af0
                                        7ffb0b993334 -> 7ffb0b991f3e
                                                7ffb0ca01f10 -> 7ffb0bac294d
Going to 1ad2:43 and 6b7e:43, we indeed ends on the expected check in samsrv!SampAssignPrimaryGroup \o/!
||0:0:001> !ttdext.tt 1ad2:43
Setting position: 1AD2:43
Time Travel Position: 1AD2:43
samsrv!SampAssignPrimaryGroup+0xb4:
00007ffb`0ca01fc4 7409            je      samsrv!SampAssignPrimaryGroup+0xbf (00007ffb`0ca01fcf) [br=0]
||0:0:001> k
 # Child-SP          RetAddr               Call Site
00 000000f0`006fd8b0 00007ffb`0bac294d     samsrv!SampAssignPrimaryGroup+0xb4
01 000000f0`006fd970 00007ffb`0b991f3e     ntdsai!SampDsSetInformationUser+0x12f619
02 000000f0`006fdb80 00007ffb`0b990af0     ntdsai!SampWriteSamAttributes+0x376
03 000000f0`006fdc90 00007ffb`0b9f389e     ntdsai!SampModifyLoopback+0xfc
04 000000f0`006fdd00 00007ffb`0b9f34eb     ntdsai!SampModifyLoopbackCheck+0x2f2
05 000000f0`006fddd0 00007ffb`0b9f29c6     ntdsai!LocalModify+0x13b
06 000000f0`006fe0f0 00007ffb`0b9aa396     ntdsai!DirModifyEntryNative+0x17e
07 000000f0`006fe450 00007ffb`0bd22ee9     ntdsai!LDAP_CONN::ModifyRequest+0x386
08 000000f0`006feac0 00007ffb`0b9c297a     ntdsai!LDAP_CONN::ModifyRequest+0x41
09 000000f0`006feb20 00007ffb`0ba1c6a2     ntdsai!LDAP_CONN::ProcessRequestEx+0xb6e
0a 000000f0`006fedf0 00007ffb`0ba1c069     ntdsai!LDAP_CONN::IoCompletion+0x51a
0b 000000f0`006ff650 00007ffb`0b912dd6     ntdsai!LdapCompletionRoutine+0x139
0c 000000f0`006ff6f0 00007ffb`0b912ae4     NTDSATQ!AtqpProcessContext+0xd6
0d 000000f0`006ff740 00007ffb`0fff7974     NTDSATQ!AtqPoolThread+0x1a4
0e 000000f0`006ff7d0 00007ffb`10f0a2f1     KERNEL32!BaseThreadInitThunk+0x14
0f 000000f0`006ff800 00000000`00000000     ntdll!RtlUserThreadStart+0x21
In order to get a quick idea of what functions are called in a trace, one can write a tool which:
- register a
CallRetCallback:- tracking the call stack depth
- printing the callee function
- printing the returned address
- run through a part of the trace
To make a more usable trace, one can also:
- print the position in the trace, to ease further investigation
- print the returned value
- use symbols (relative to the trace's modules, ie. even if not present on the system) to resolve addresses
example_calltree implements theses features.
Here is an example on the same lsass trace:
# Run the tool
example_calltree.exe -b 177B:3E -e 1B76:31 D:\traces\lsass01.run > out.txt
# ~1.5 second, for ~25K entries

# Whole trace would have needed ~7.5 seconds for ~140K entries
Outputs:
Openning the trace
ModuleList:
256064a0000     3000    C:\Windows\system32\msprivs.DLL
7ff7f5710000    11000   C:\Windows\system32\lsass.exe
7ffae3170000    171000  C:\ProgramData\Microsoft\Windbg\0-0-0\TTD\TTDRecordCPU.dll
7ffaf3ea0000    22000   C:\Windows\SYSTEM32\certpoleng.dll
7ffaf3fe0000    1a000   C:\Windows\system32\keyiso.dll

...

-> ntdsai!LDAP_CONN::ModifyRequest (7ffb0b9aa010) [177b:3e]
| -> ntdsai!memset (7ffb0baad676) [177b:5e]
| <- ntdsai!+2a0bb (7ffb0b9aa0bb) [177b:a0] RETURN f0006fe550
| -> ntdsai!memset (7ffb0baad676) [177b:a4]
| <- ntdsai!+2a0d0 (7ffb0b9aa0d0) [177b:118] RETURN f0006fe6b0
| -> ntdsai!THREAD_STOPWATCH::Start (7ffb0b9ad920) [177b:126]
| | -> ntdsai!THGetThreadCpuTime (7ffb0ba1c13c) [177b:12a]
| | | -> KERNEL32!GetCurrentThread (7ffb0fff57f0) [177b:12c]
| | | <- ntdsai!+9c146 (7ffb0ba1c146) [177b:12e] RETURN fffffffffffffffe
| | | -> KERNEL32!GetThreadTimesStub (7ffb0fff9a80) [177b:135]
| | | | -> ntdll!NtQueryInformationThread (7ffb10f4fe80) [177b:147]
| | | | <- KERNELBASE!+69a76 (7ffb0d609a76) [177d:0] RETURN 0
| | | | -> KERNELBASE!_security_check_cookie (7ffb0d628890) [177d:f]
| | | | <- KERNELBASE!+69ab5 (7ffb0d609ab5) [177d:15] RETURN 1
| | | <- ntdsai!+9c168 (7ffb0ba1c168) [177d:1b] RETURN 1
| | <- ntdsai!+2d92e (7ffb0b9ad92e) [177d:21] RETURN 2625a0
| | -> KERNELBASE!GetTickCount (7ffb0d5f8fd0) [177d:23]
| | <- ntdsai!+2d938 (7ffb0b9ad938) [177d:29] RETURN daa1b
| <- ntdsai!+2a11b (7ffb0b9aa11b) [177d:2e] RETURN daa1b
| -> ntdsai!LDAP_CONN::IsBound (7ffb0b9aa7f0) [177d:32]
| <- ntdsai!+2a12b (7ffb0b9aa12b) [177d:3b] RETURN 1
| -> ntdsai!memset (7ffb0baad676) [177d:44]
| <- ntdsai!+2a15b (7ffb0b9aa15b) [177d:b8] RETURN f0006fe6b0
| -> ntdsai!InitCommarg (7ffb0b9f6fc0) [177d:bb]
| | -> ntdsai!memset (7ffb0baad676) [177d:c1]
| | <- ntdsai!+76fd6 (7ffb0b9f6fd6) [177d:f3] RETURN f0006fe6b0
| <- ntdsai!+2a170 (7ffb0b9aa170) [177d:102] RETURN 400a
| -> ntdsai!LDAP_LogAPIEntry (7ffb0ba1d6d4) [177e:3]
| | -> KERNEL32!TlsGetValueStub (7ffb0fff5250) [177e:11]
| | <- ntdsai!+9d714 (7ffb0ba1d714) [177e:19] RETURN 25606fb0cf0
| | -> ntdsai!SetActiveThreadStateInfoStringA (7ffb0ba1eb8c) [177e:1c]
| | | -> ntdsai!DsaSafeMult (7ffb0ba1eb30) [177e:33]
| | | <- ntdsai!+9ebe0 (7ffb0ba1ebe0) [177e:4b] RETURN c8

...
To understand what a code is actually doing, one can extract the instruction coverage of a trace.
To do so, example_cov is a tool which:
- list available modules for filtering
- for each target, add a breakpoint on execution, from the module's base address to its end
- register a
MemoryWatchpointCallback:- track in a set each breakpoint's address hitted
- run through a part of the trace
- export the resultings addresses in
module_name.trace.txtfiles
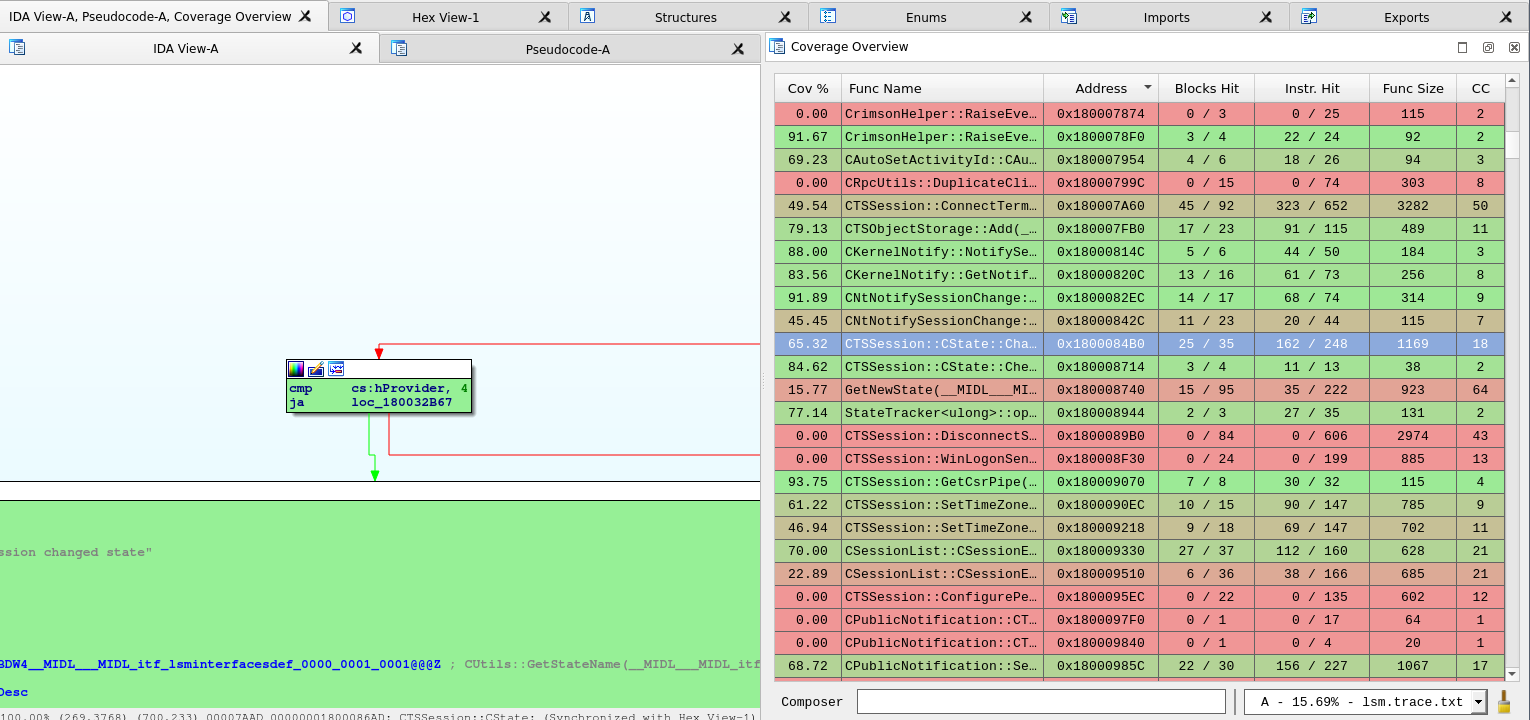
Here is an example with a trace of the Local Session Manager (lsm.dll):
# Run the tool
example_cov.exe -m lsm D:\traces\lsm.run
# After a few seconds:
Openning the trace
Tracking lsm
Number of entry: 0x1000, current position 13b6:26
Number of entry: 0x1000, current position c03:9
Number of entry: 0x2000, current position 134f:5b
Number of entry: 0x3000, current position 1991:205
Number of entry: 0x3000, current position 720c:1d
Number of entry: 0x3000, current position 36af:28
Number of entry: 0x3000, current position 7b01:10
Number of entry: 0x4000, current position 100d2:396
Number of entry: 0x4000, current position a7fd:18
Number of entry: 0x4000, current position ff7f:17c
Got 0x42f9 addresses
Dump to file lsm.trace.txt
The lsm.trace.txt file looks like:
lsm+1eb0
lsm+1eb7
lsm+1eba
lsm+1ebe
...
As this format is compatible with Lighthouse, one can visualize it in IDA:
By doing several traces, or one trace with several call splitted using -b (begin) and -e (end) arguments, one can obtain overlapping coverage map.
Diffing them could be a great way to identify specific code snippets.
Tenet is a "Trace Explorer" plug-in for IDA. Please refer to the official website for the full feature description.
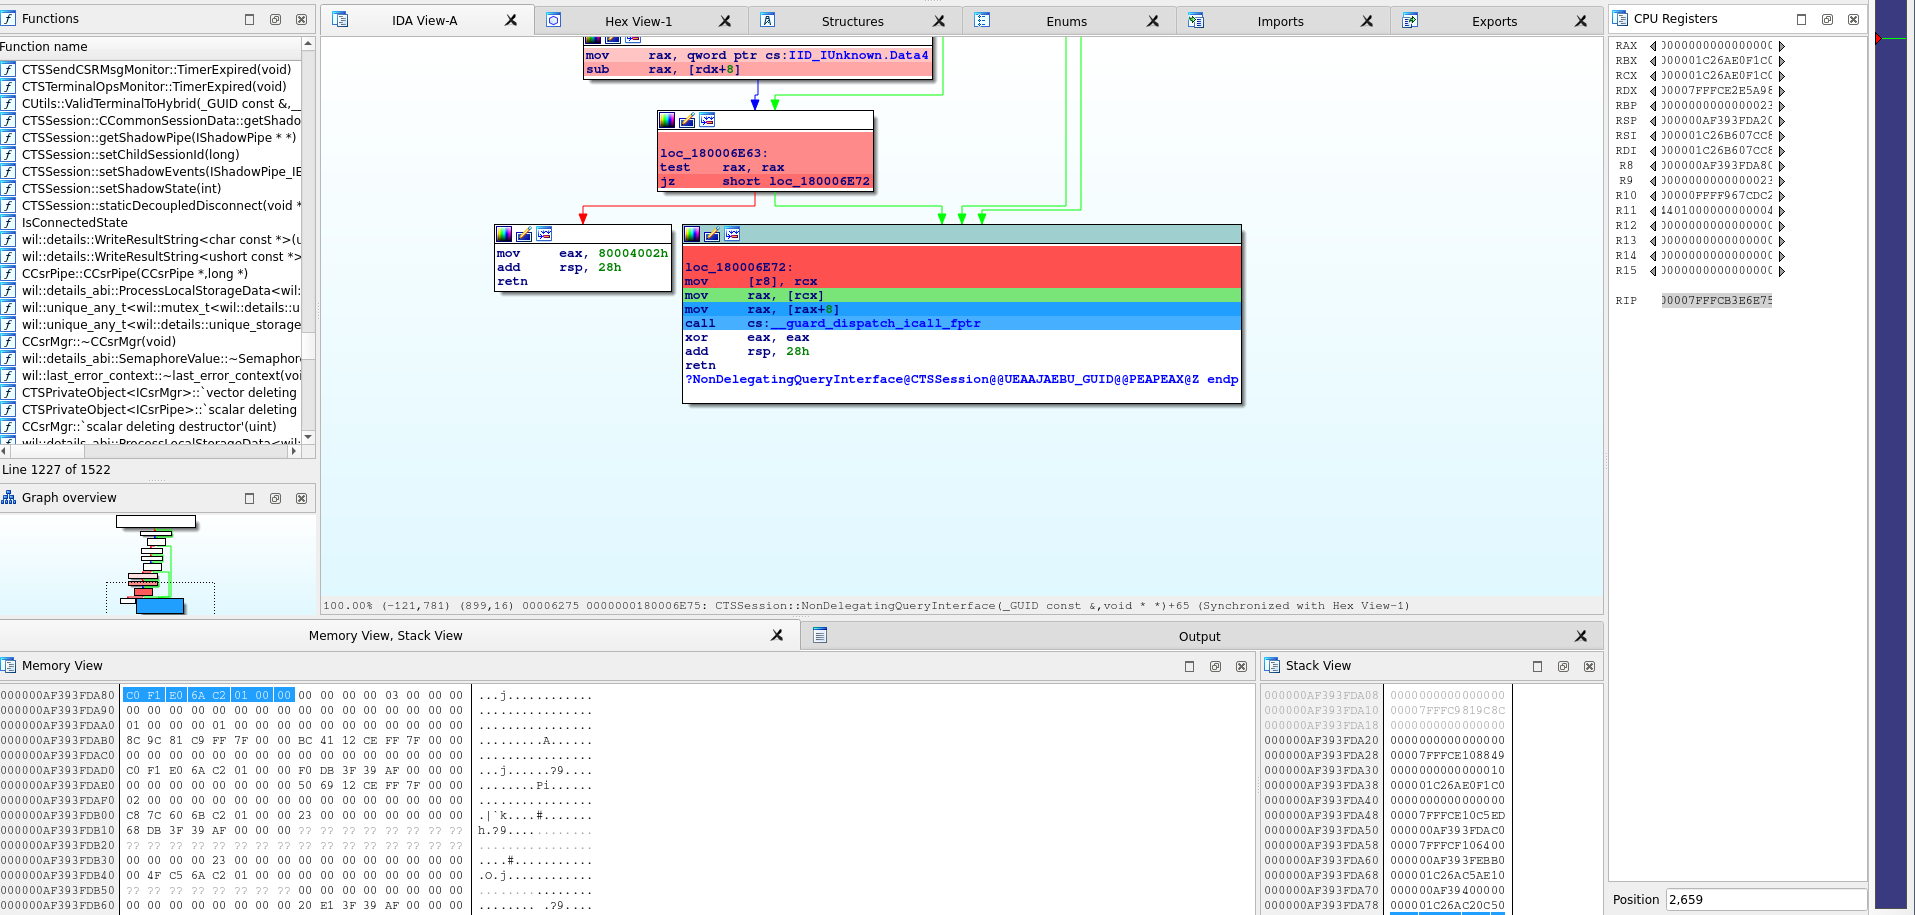
The example_tenet example produces a Tenet compatible trace for a given module, from a TTD trace.
For instance:
# Run the tool, for the module `lsm.dll`
example_tenet.exe -m lsm D:\traces\lsm.run
# The output is in `lsm.trace.tenet`
Openning the trace
Track c:\windows\system32\lsm.dll [7fffcb3e0000 to 7fffcb491fff]
Dump to file lsm.trace.tenet
0x1000 instructions...
0x2000 instructions...
0x3000 instructions...
0x4000 instructions...
0x5000 instructions...
0x6000 instructions...
0x7000 instructions...
As a side note, if the TTD trace is going to other modules (such as memcpy implementation), the difference from the call instruction and the next one will provide a summary of all memory accesses done by memcpy.
The resulting lsm.trace.tenet can then be loaded in IDA:
Either:
- use the latest
pyTTD.pydrelease - or compile the
python-bindingsproject.
With pyTTD.pyd, TTDReplay.dll and TTDReplayCPU.dll in the directory, one can import pyTTD:
import pyTTD

# Open the trace
eng = pyTTD.ReplayEngine()
eng.initialize("D:\\traces\\trace.run")

# Get positions
first = eng.get_first_position()
last = eng.get_last_position()
print(f"Trace from {first} to {last}")

# Get a cursor
cursor = eng.new_cursor()
cursor.set_position(first)

# Retrieve PC
print(f"PC: {cursor.get_program_counter():x}")

# Print RCX
ctxt = cursor.get_context_x86_64()
print("RCX: %x" % ctxt.rcx)

# Read the memory at RCX on 16 bytes
print("@128[RCX]: %s" % cursor.read_mem(ctxt.rcx, 16))
More API example are available in example_api/example_api.py.
- MSDN - Time Travel Debugging - Overview
- TTD analysis by @w4kfu at Rump'in Rennes 2019
- Initial iDNA paper : S. Bhansali, W.-K. Chen, S. de Jong, A. Edwards, R. Murray, M. Drinic, D. Mihocka, and J. Chau. Framework for "Instruction-level tracing and analysis of program executions" in VEE, 2006.


