Code to generate figures and tables for publication, including thread diagrams and LaTeX tables including such thread diagrams.
- clone this repo
git clone https://github.com/SherrillGroup/paper-figure-tools.git - Install locally in developer mode
pip install -e paper-figure-tools
import cdsg_plot
cdsg_plot.qcdb_plot.flat(
data,
color='blue',
view=False,
title=f"{i}_total_error",
xlimit=20.0,
)
merge_dats = [
{
"show": "a",
"db": "HSG",
"sys": "1",
"data": [0.3508, 0.1234, 0.0364, 0.0731, 0.0388],
},
{
"show": "b",
"db": "HSG",
"sys": "3",
"data": [0.2036, -0.0736, -0.1650, -0.1380, -0.1806],
},
{
"show": "c",
"db": "S22",
"sys": "14",
"data": [None, -3.2144, None, None, None],
},
{
"show": "d",
"db": "S22",
"sys": "15",
"data": [-1.5090, -2.5263, -2.9452, -2.8633, -3.1059],
},
{
"show": "e",
"db": "S22",
"sys": "22",
"data": [0.3046, -0.2632, -0.5070, -0.4925, -0.6359],
},
]
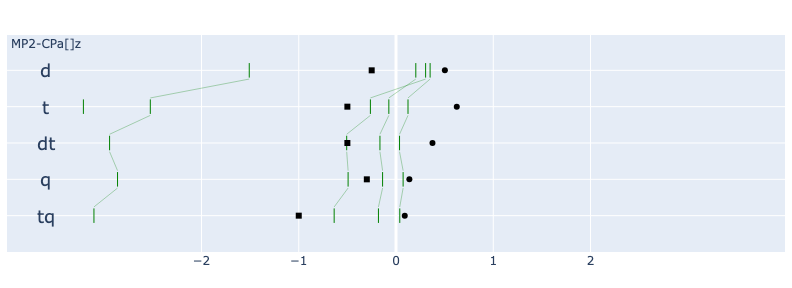
threads(
merge_dats,
labels=["d", "t", "dt", "q", "tq"],
color="sapt",
title="MP2-CPa[]z",
mae=[0.25, 0.5, 0.5, 0.3, 1.0],
mape=[20.1, 25, 15, 5.5, 3.6],
)aka (C. David Sherrill Group Plotting Tools)
-
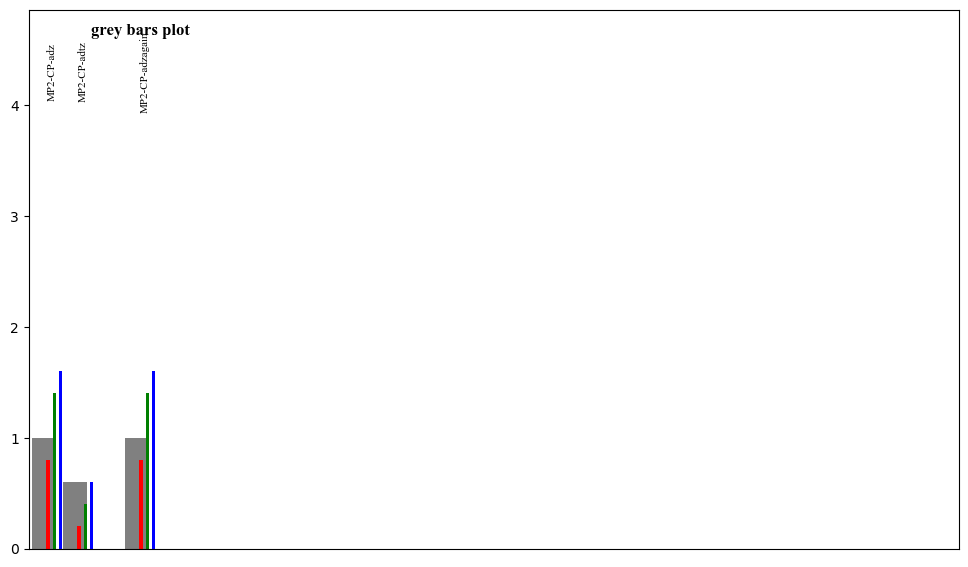
"grey bars" plots for matplotlib
- Defined in src/cdsg_plot/qcdb_plot.py .
- Demo in src/cdsg_plot/grey_bars.py .
-
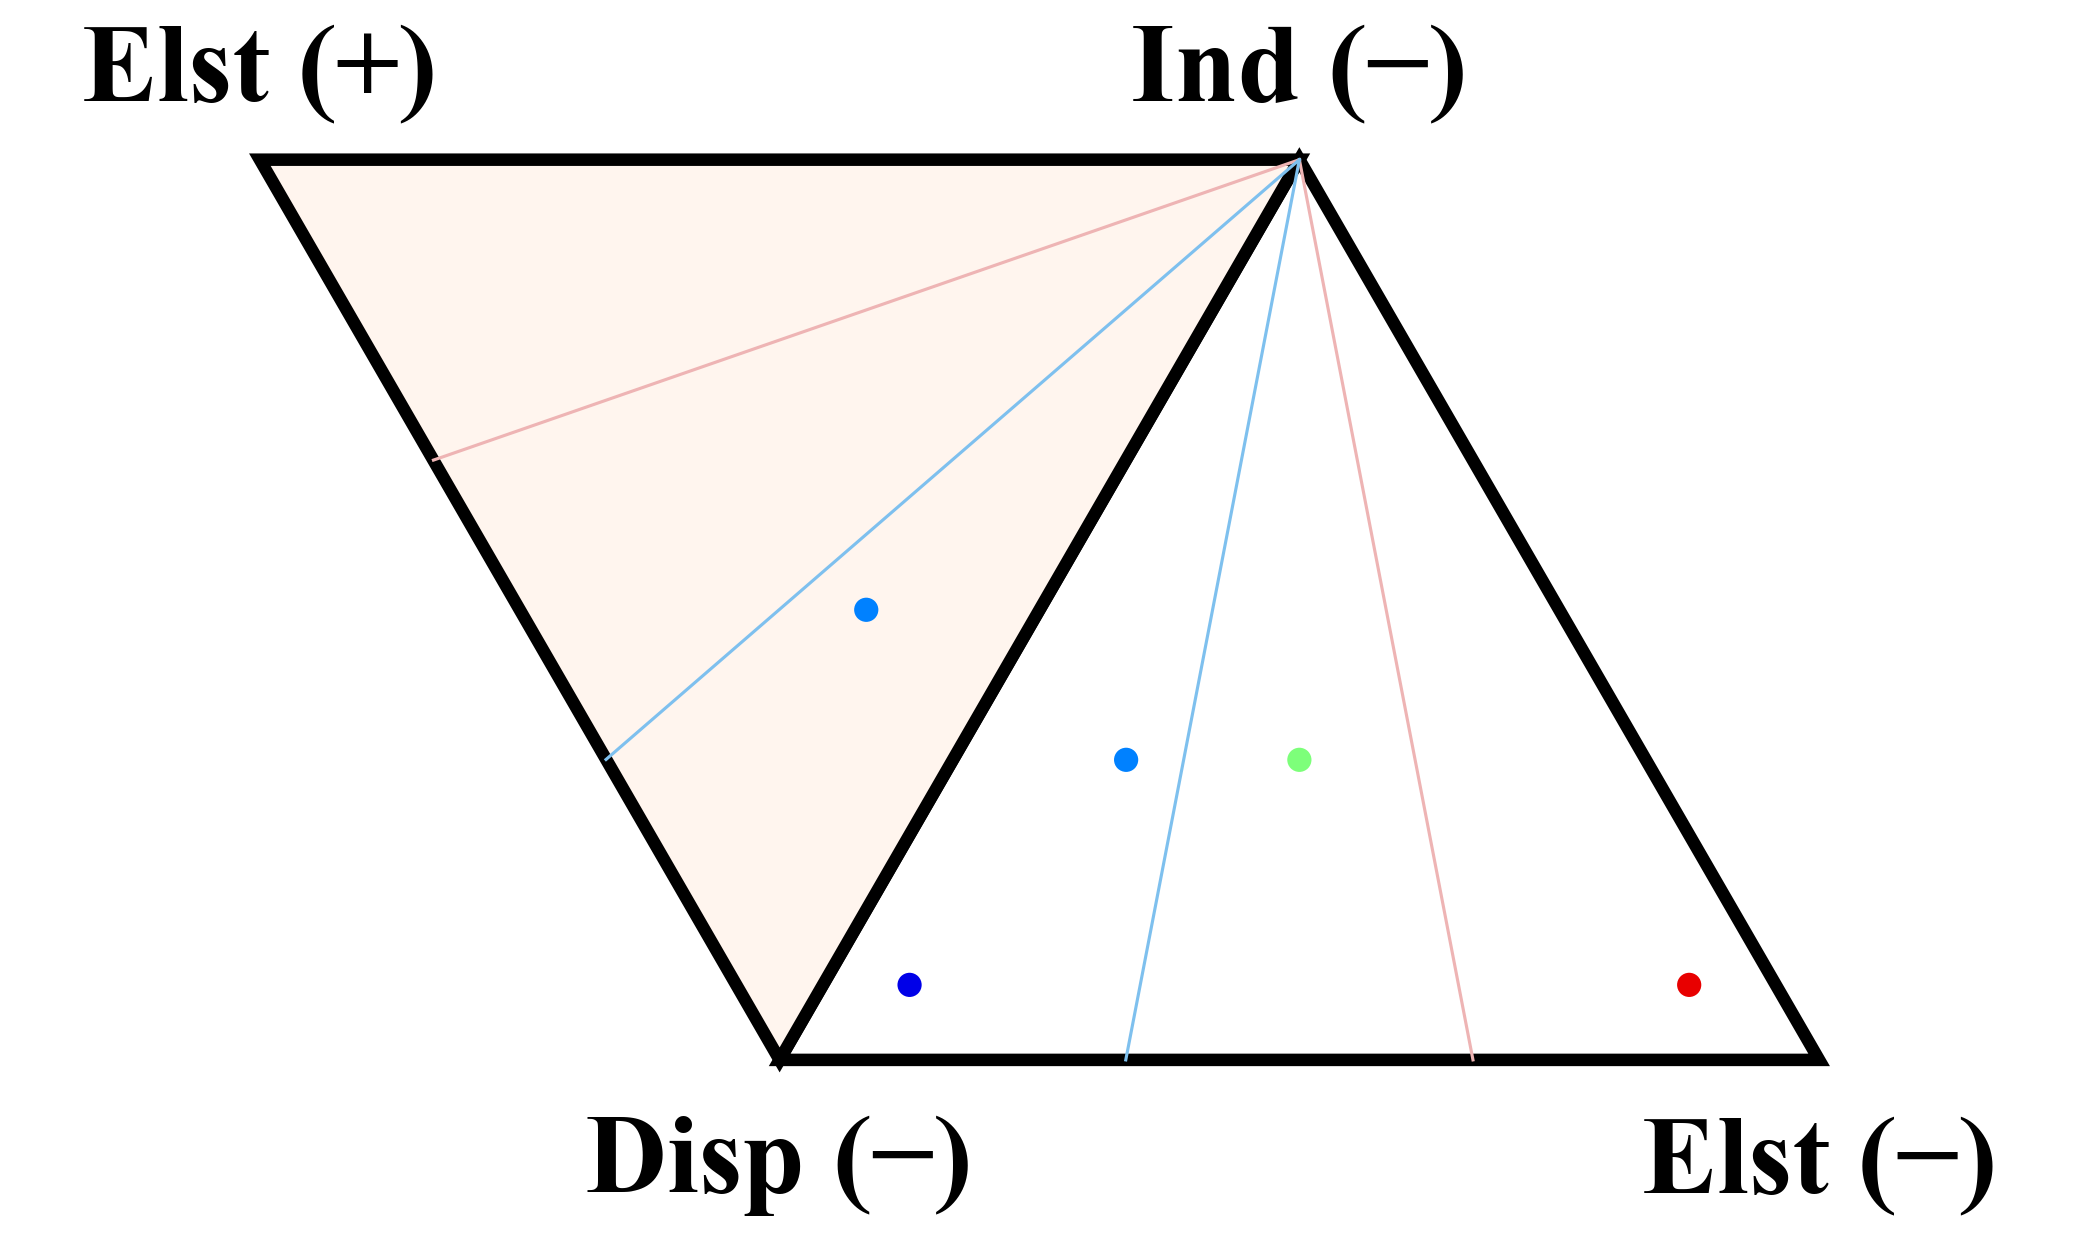
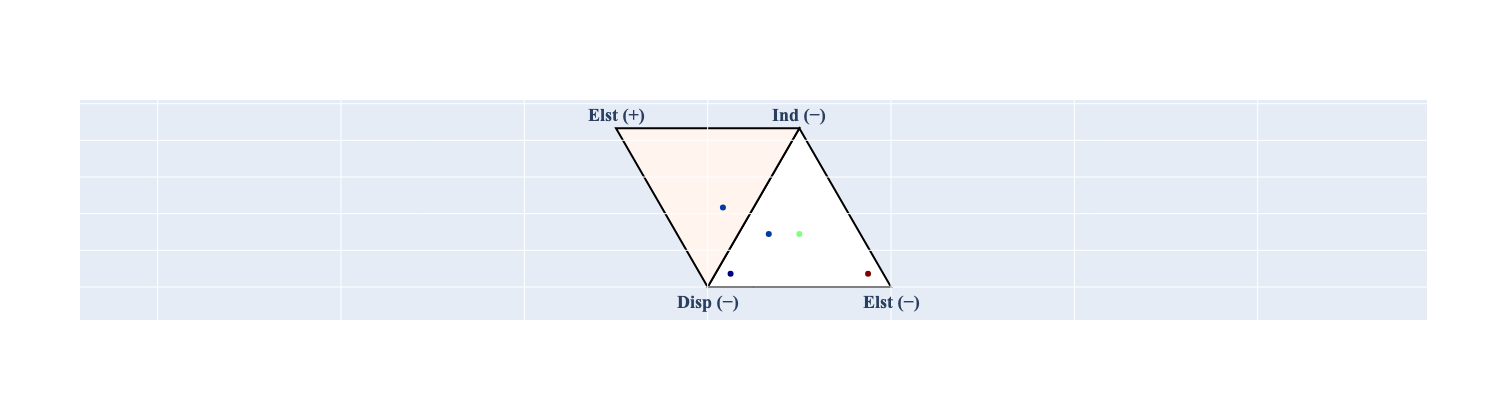
"ternary" plots for matplotlib and plotly
- Defined for plotly in src/cdsg_plot/ternary.py](src/cdsg_plot/ternary.py) .
- Defined for matplotlib in
ternaryfunction in src/cdsg_plot/qcdb_plot.py . - Demo of both in src/cdsg_plot/ternary.py .
-
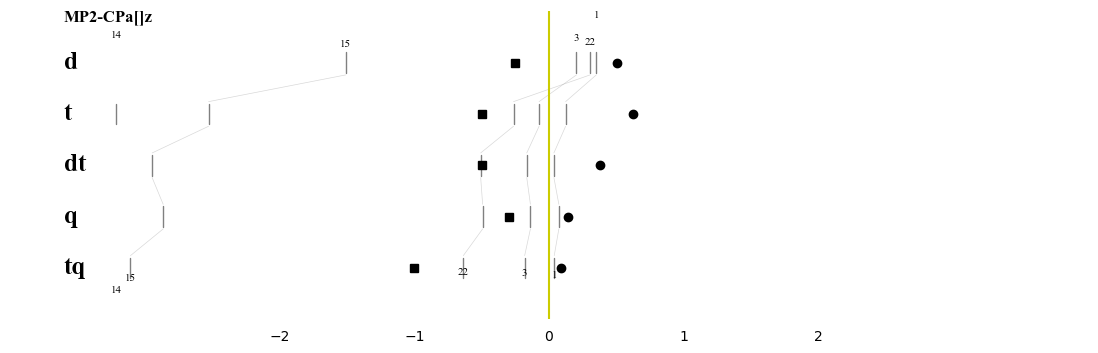
"threads" plots for matplotlib and plotly
- Defined for plotly in src/cdsg_plot/threads.py](src/cdsg_plot/threads.py) .
- Defined for matplotlib in
threadsfunction in src/cdsg_plot/qcdb_plot.py . - Demo of both in src/cdsg_plot/threads.py .
-
next
-
Violin plots with error statistics
- Defined in ./src/cdsg_plot/error_statistics.py
- Demo
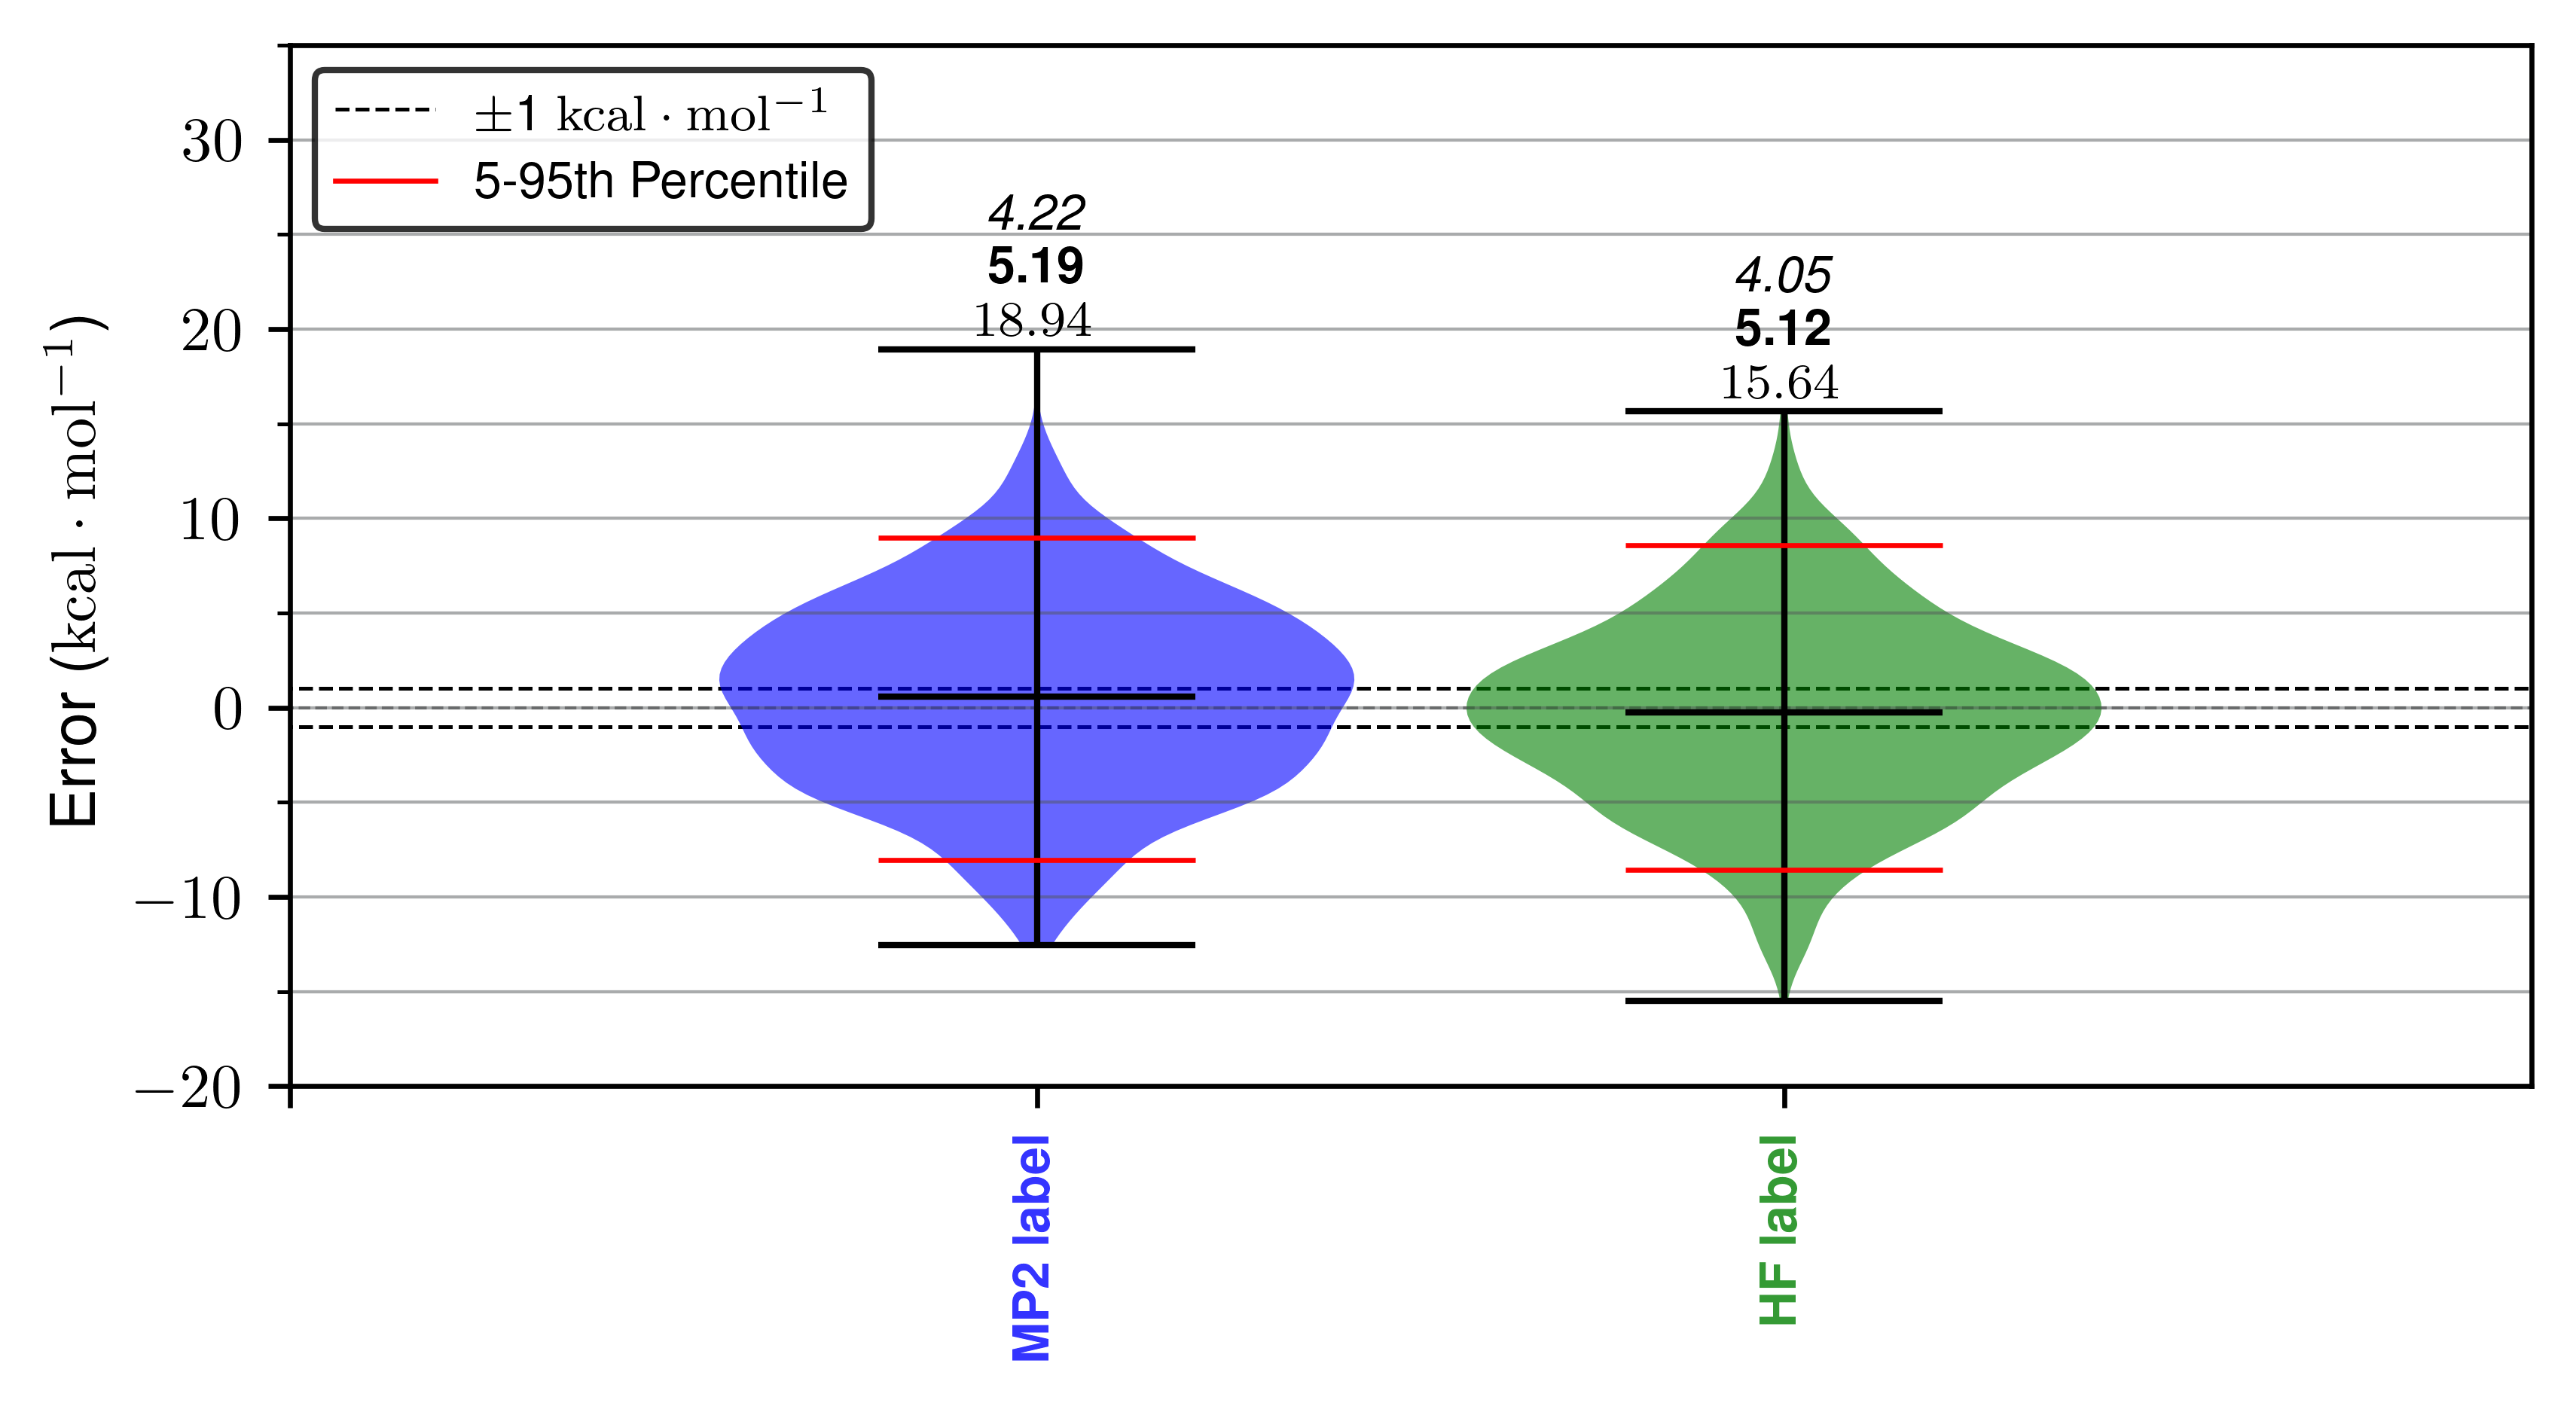


import cdsg_plot
import pandas as pd
import numpy as np

df = pd.DataFrame(
    {
        "MP2": 5 * np.random.randn(1000) + 0.5,
        "HF": 5 * np.random.randn(1000) - 0.5,
        "MP2.5": 5 * np.random.randn(1000) + 0.5,
    }
)
# Only specify columns you want to plot
vals = {
    "MP2 label": "MP2",
    "HF label": "HF",
}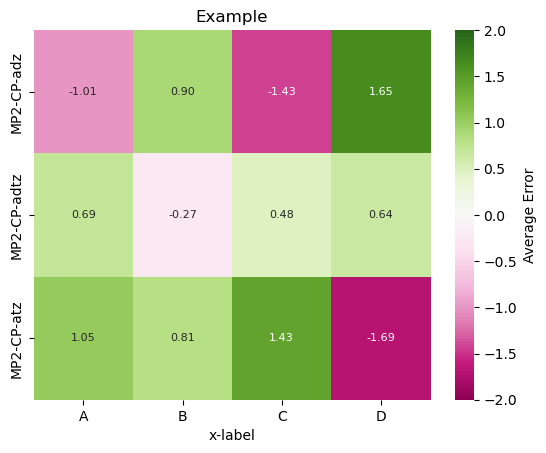
cdsg_plot.error_statistics.violin_plot(df, vals, ylim=[-20, 35], output_filename="example.png")- Heatmap
- Defined in ./src/cdsg_plot/heatmap.py
- Demo