TensorFlow implementation of multivariate time series forecasting model introduced in Koochali, A., Dengel, A., & Ahmed, S. (2021). If You Like It, GAN It — Probabilistic Multivariate Times Series Forecast with GAN. In Engineering Proceedings (Vol. 5, No. 1, p. 40). Multidisciplinary Digital Publishing Institute. https://doi.org/10.3390/engproc2021005040.
pandas==1.3.4
numpy==1.19.5
tensorflow==2.7.0
plotly==5.3.1
kaleido==0.2.1import numpy as np
from probcast_tensorflow.model import ProbCast
# Generate two time series
N = 300
t = np.linspace(0, 1, N)
e = np.random.multivariate_normal(mean=[0, 0], cov=[[1, 0.25], [0.25, 1]], size=N)
a = 20 * np.cos(2 * np.pi * (10 * t - 0.5)) + e[:, 0]
b = 10 * np.sin(2 * np.pi * (20 * t - 0.5)) + e[:, 1]
y = np.hstack([a.reshape(- 1, 1), b.reshape(- 1, 1)])
# Fit the model
model = ProbCast(
y=y,
forecast_length=30,
sequence_length=60,
quantiles=[0.1, 0.3, 0.5, 0.7, 0.9],
generator_gru_units=[64, 32],
discriminator_gru_units=[64, 32],
generator_dense_units=16,
discriminator_dense_units=16,
noise_dimension=100,
noise_dispersion=10,
)
model.fit(
learning_rate=0.001,
batch_size=32,
epochs=100,
verbose=True
)# Plot the in-sample predictions
predictions = model.predict(index=270)
fig = model.plot_predictions()
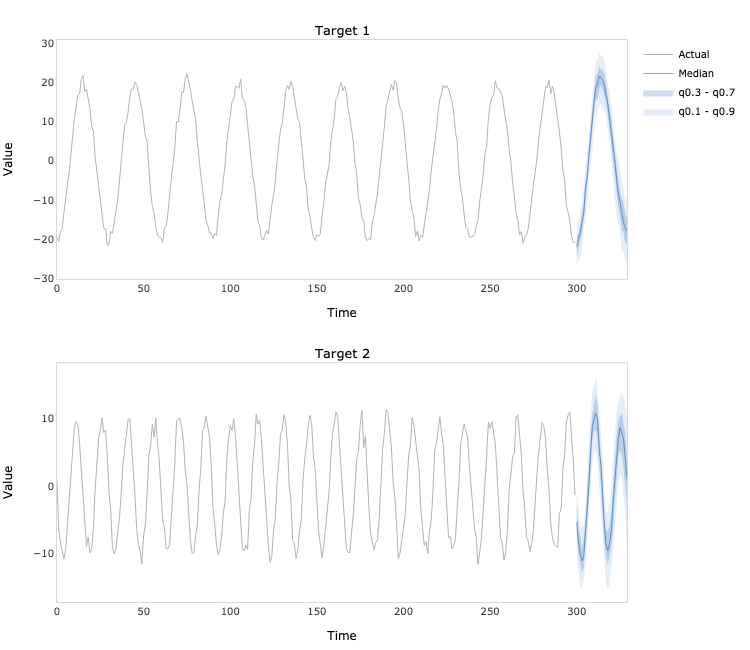
fig.write_image('predictions.png', width=750, height=650)# Plot the out-of-sample forecasts
forecasts = model.forecast()
fig = model.plot_forecasts()
fig.write_image('forecasts.png', width=750, height=650)
