NCAA and other college atheletic events are enormous events in USA. These events show cases great talent, and attract audience via broadcast and in-person. In proportion, it also attracts considerable revenue in various forms.
Purpose of this project is identify and report amount of sports revenue received over the years by each college. In future releases of the project, a further breakdown and reporting will be provided.
-
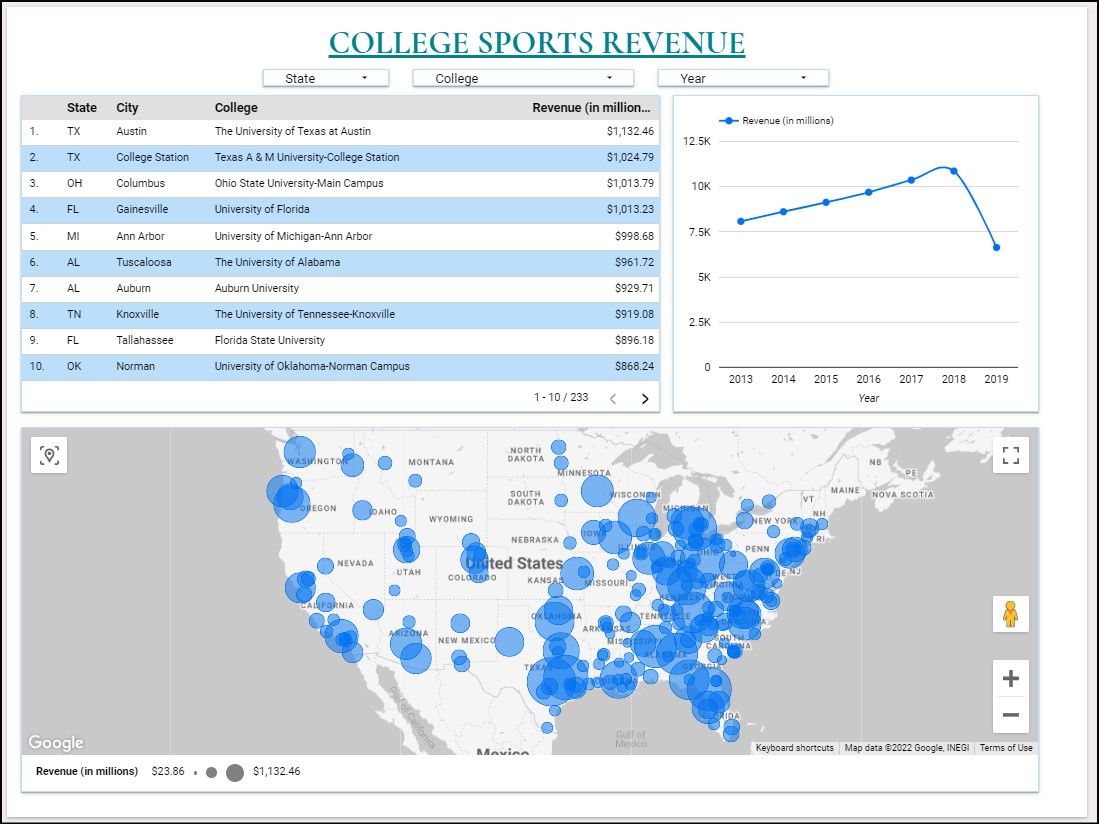
Display list of all colleges and their revenue for the last 5 available years
- Include an ability to filter by State, and Year
- Include ability to reset (default feature provided by Google Data Studio)
-
Display a graph of total revenue per year
-
Display in a map, locations of colleges and revenue amounts
Final Dashboard - College Sports Revenue
https://datastudio.google.com/reporting/ce47802e-53fc-40ab-9860-0df04ea52c8b
US Dept of Education's Equity in Athletics Disclosure Act (EADA) - https://ope.ed.gov/athletics/#/customdata/datafiltered
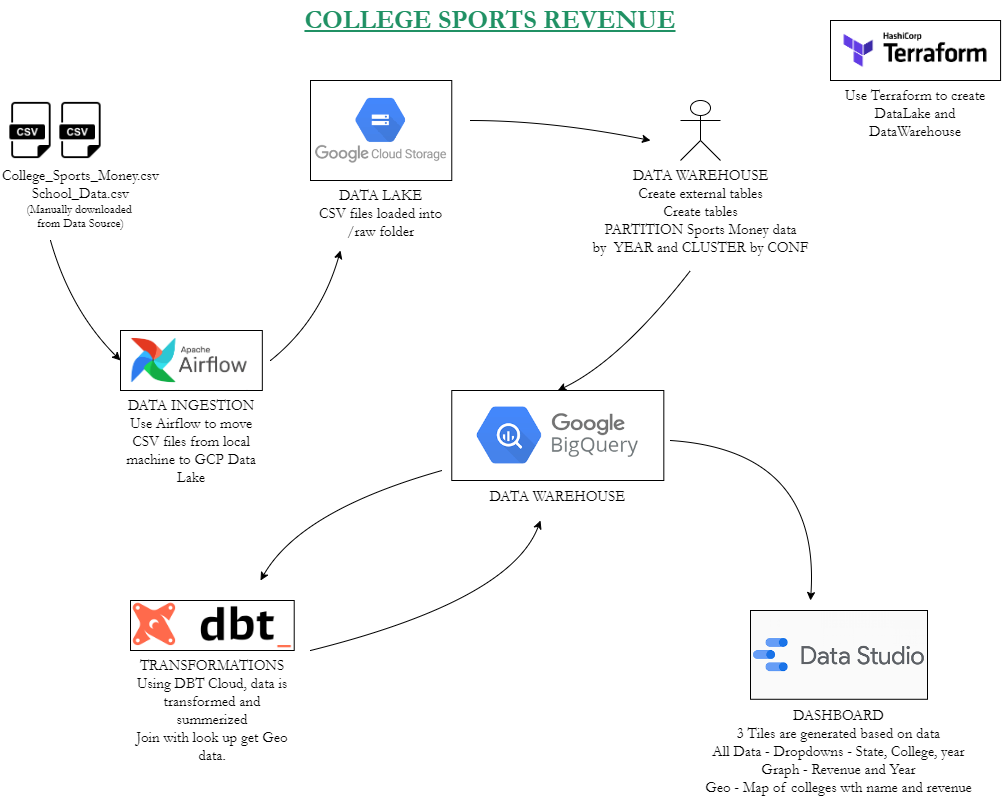
Terraform is used to set up the GCP Storage Bucket and BigQuery
Rubric - 4 points: End-to-end pipeline: multiple steps in the DAG, uploading data to data lake
Data (revenue and lookup data) is manually downloaded from data source, due to lack of API. The downloaded data is moved to GCP Cloud Storage Data Lake, using Apache Airflow DAG
Source: NCAA/docker/dags
Rubric - 4 points: Tables are partitioned and clustered in a way that makes sense for the upstream queries (with explanation)
Data in GCS is partitioned based on Year and Clustered based on Sports Conference. Partitioning based on year helps in getting data for UI reports Year Filter. Clustering by Sports Conference helps in summarizing amounts by conference.
Source: NCAA/BigQuery/BigQuery.sql
Rubric - 4 points: Tranformations are defined with dbt, Spark or similar technologies
Using DBT Cloud, data is transformed and summerized - Add all revenue streams, and rolled into Year, College. College names is joined with lookup to get Geo Data.
Source: NCAA_DBT/
Rubric - 4 points: A dashboard with 2 tiles
3 Tiles are generated in Google Data Studio based on data
- All Data - Dropdowns - State, College, year
- Graph - Revenue and Year
- Geo - Map of colleges with name and revenue
Report: https://datastudio.google.com/reporting/ce47802e-53fc-40ab-9860-0df04ea52c8b/page/E52oC
4 points: Instructions are clear, it's easy to run the code, and the code works
Project and code are thoroughly documented in this README.md.

