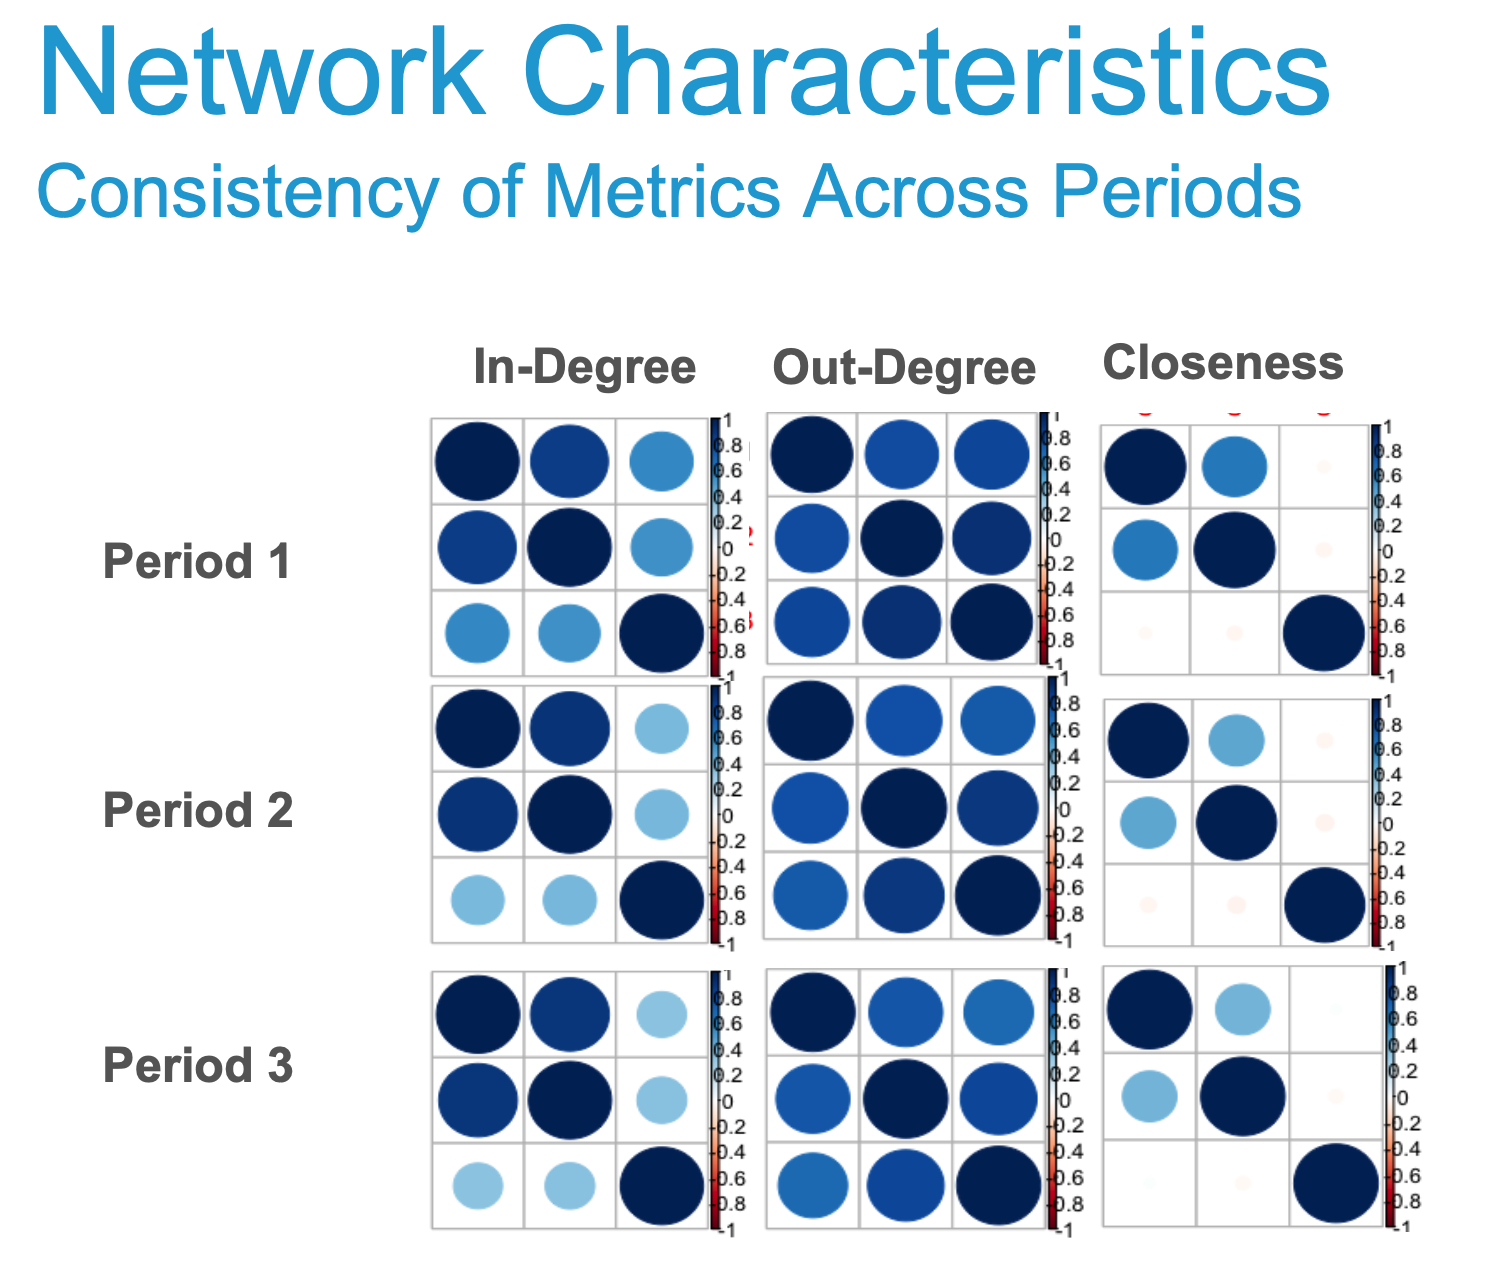
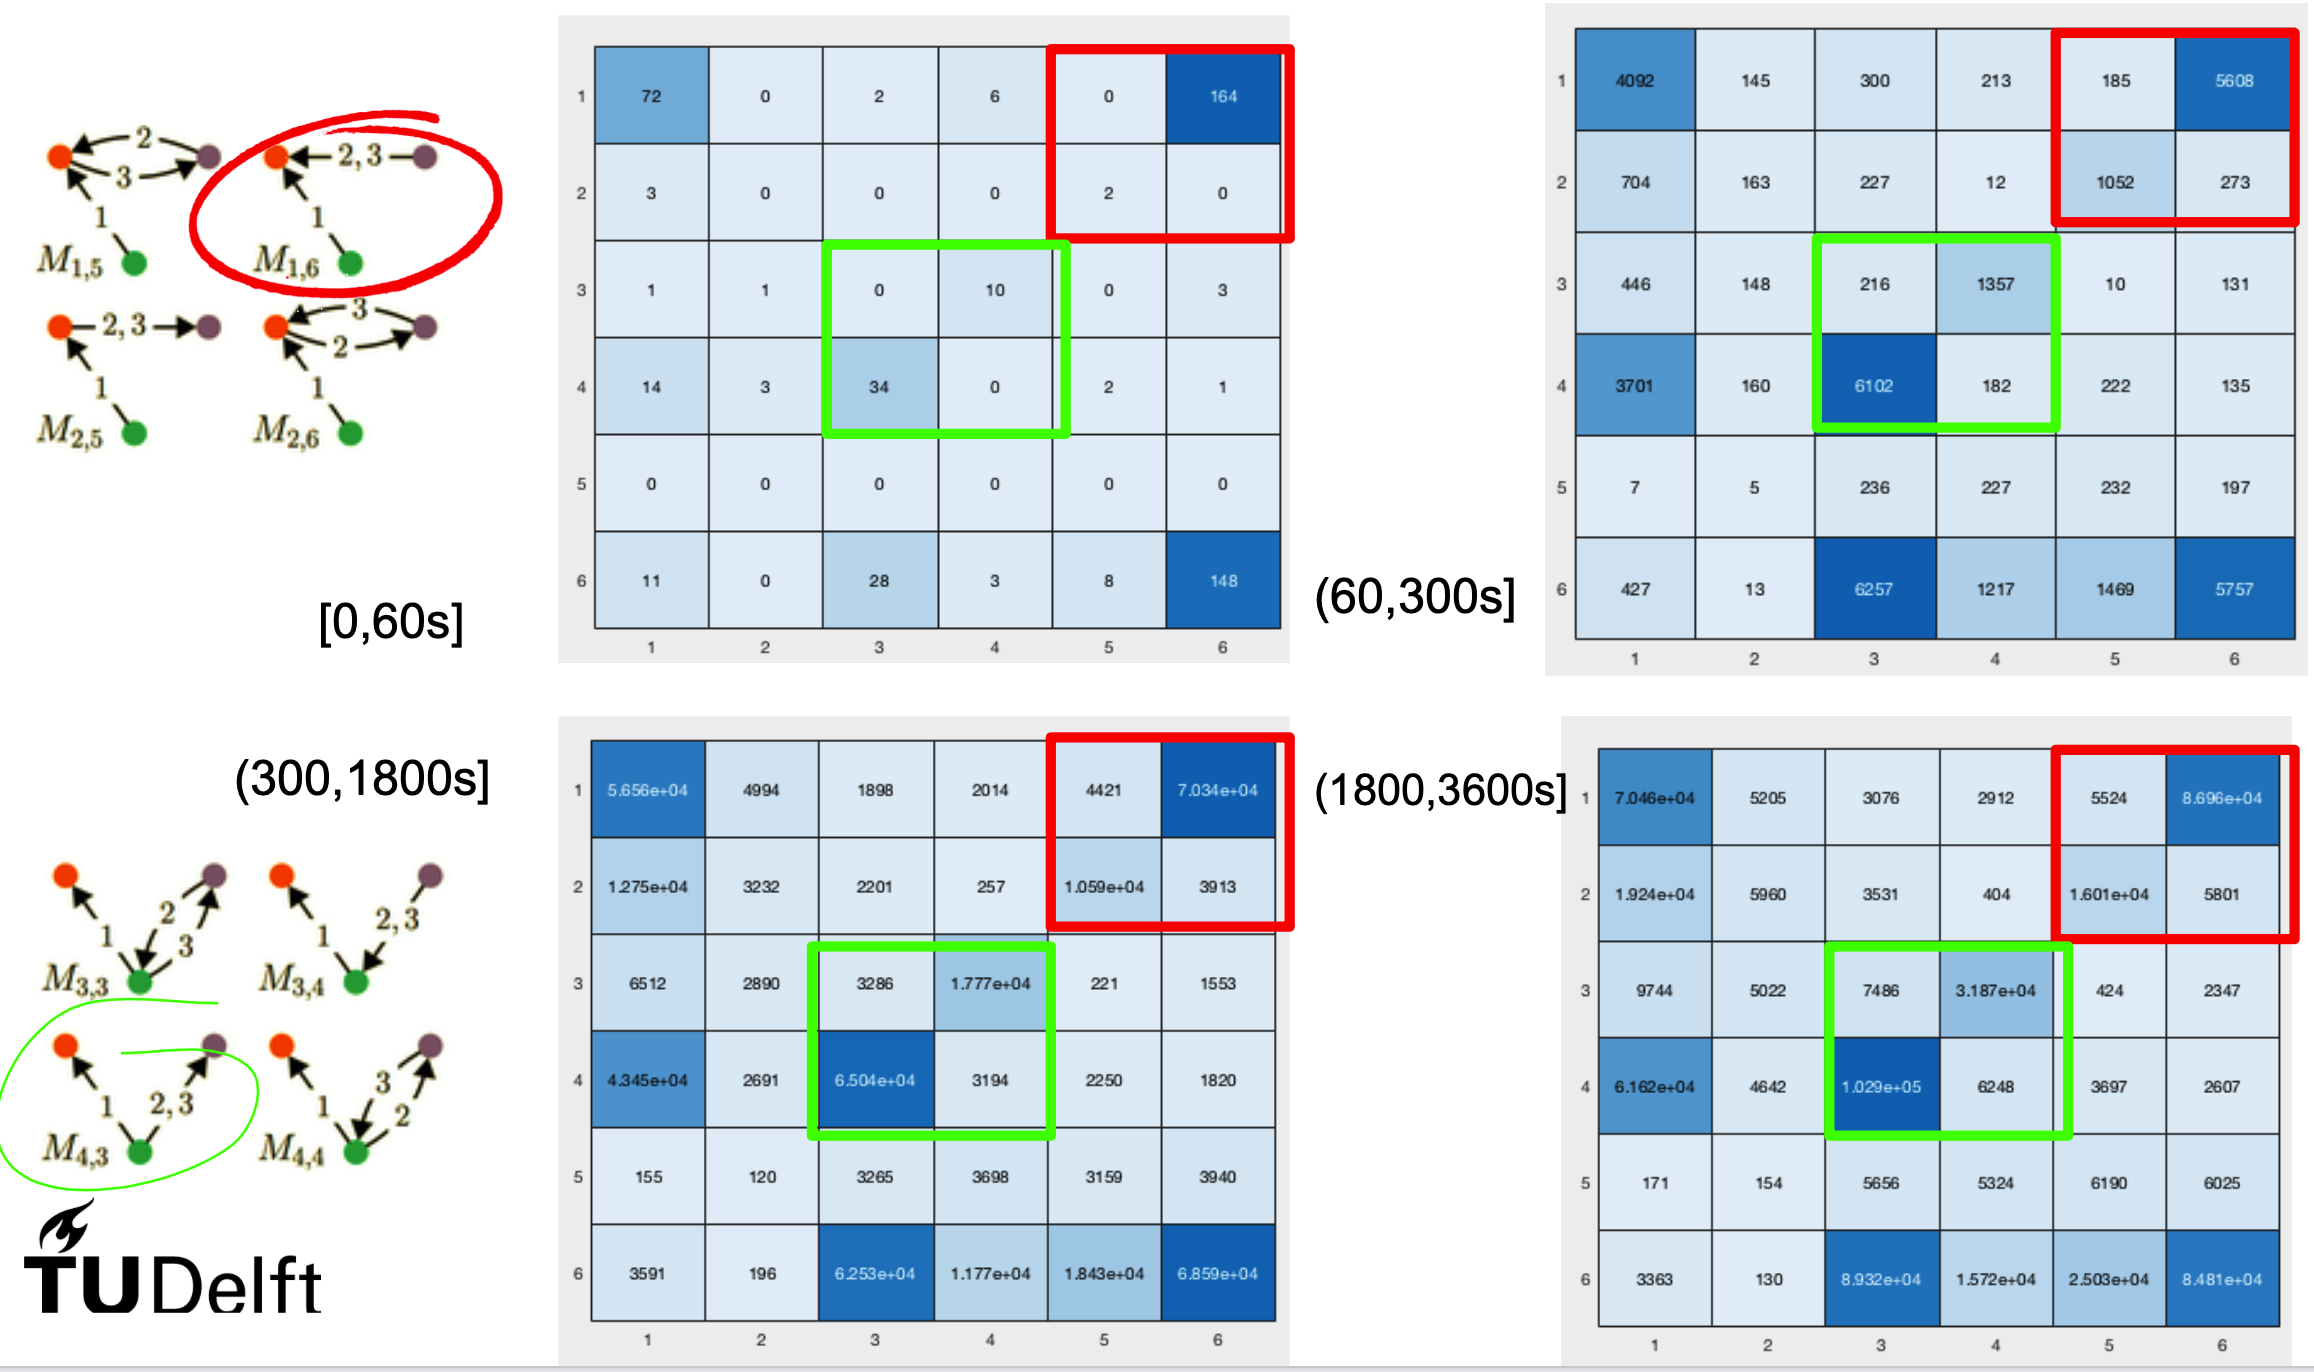
Analyzed user behavior of MathOverflow users via Network Metrics and analyzing the motifs formed
For results and inferences please look at the presentation: https://docs.google.com/presentation/d/15cZOWtL55cwUMDv9kNJ1EqnEZP4Ew20Dh3XeWjz05k4/edit?usp=sharing
This is the working repository for codes used in the Final Project of EE4389 : Modeling and Data Analysis in Complex Networks course of TU Delft. The course is scheduled in Q3 of academic year 2017/18.
The dataset is a large temporal network of interactions (in terms of posting questions, answering questions and commenting) of users on MathOverflow taken from: https://snap.stanford.edu/data/sx-mathoverflow.html
Datasets are splitted into 3 time periods:
- 1st Period: Tuesday, September 29, 2009 2:56:28 AM - Monday, November 21, 2011 1:44:28 PM (GMT)
- 2nd Period: Monday, November 21, 2011 1:44:29 PM - Monday, January 13, 2014 12:32:28 AM (GMT)
- 3rd Period: Monday, January 13, 2014 12:32:29 AM - Sunday, March 6, 2016 11:05:55 AM (GMT)
or the equivalence in epoch notation,
- 1st Period: 1254192988 - 1321883068
- 2nd Period: 1321883069 - 1389573148
- 3rd Period: 1389573149 - 1457262355
To run it, do the following:
- Generate CSV files by running the
explore_metrics.py. - See the various coefficient using Rstudio by running the
calculate_correlation.R. - Enjoy!
The folder /SNAP is a fork of Stanford's SNAP code. We edited the code to count centrality of node based upon its appearance in a motif.

