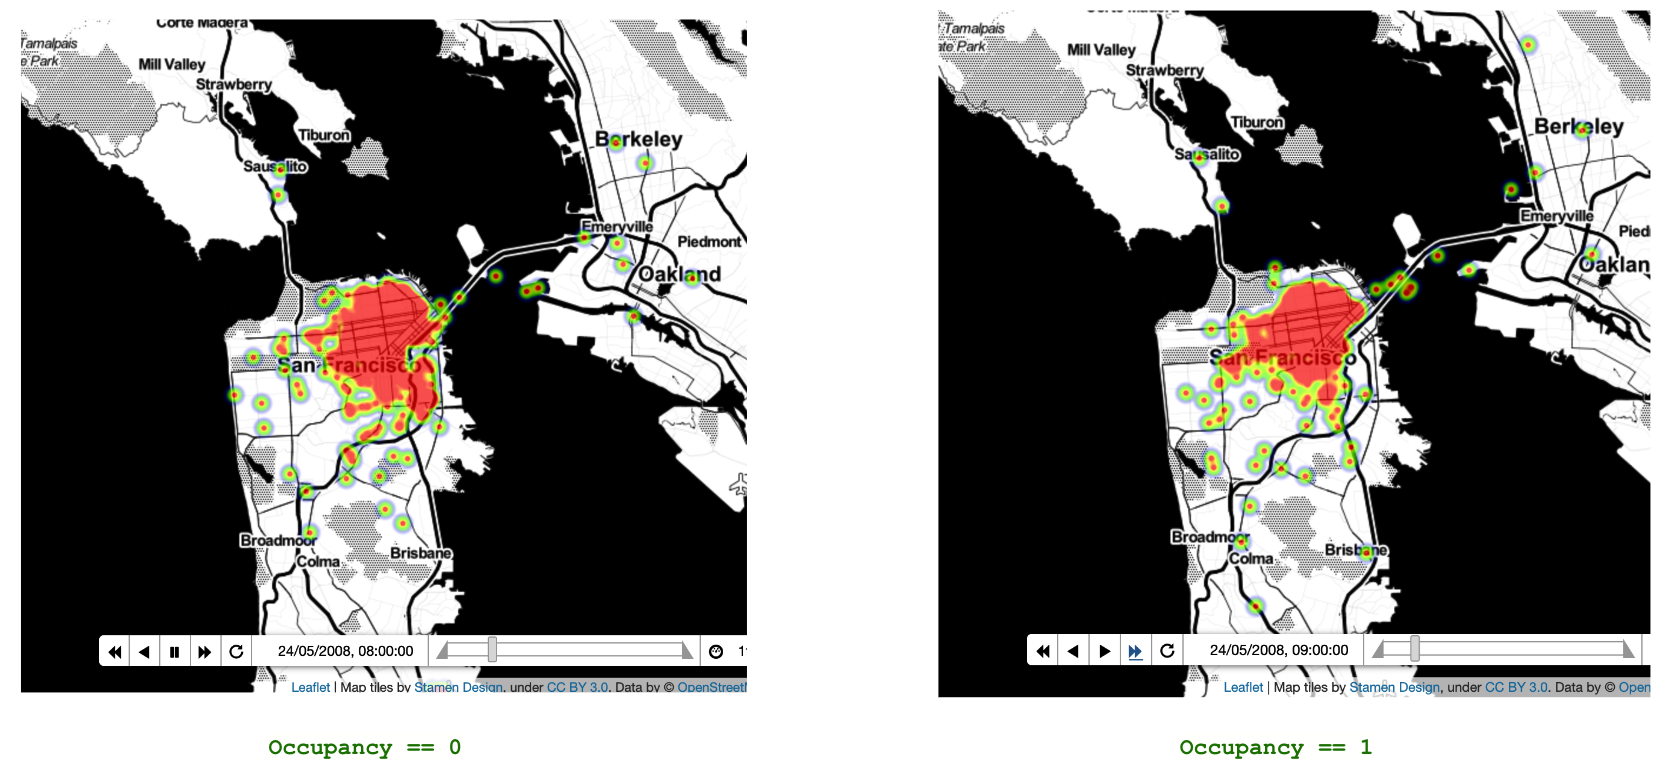
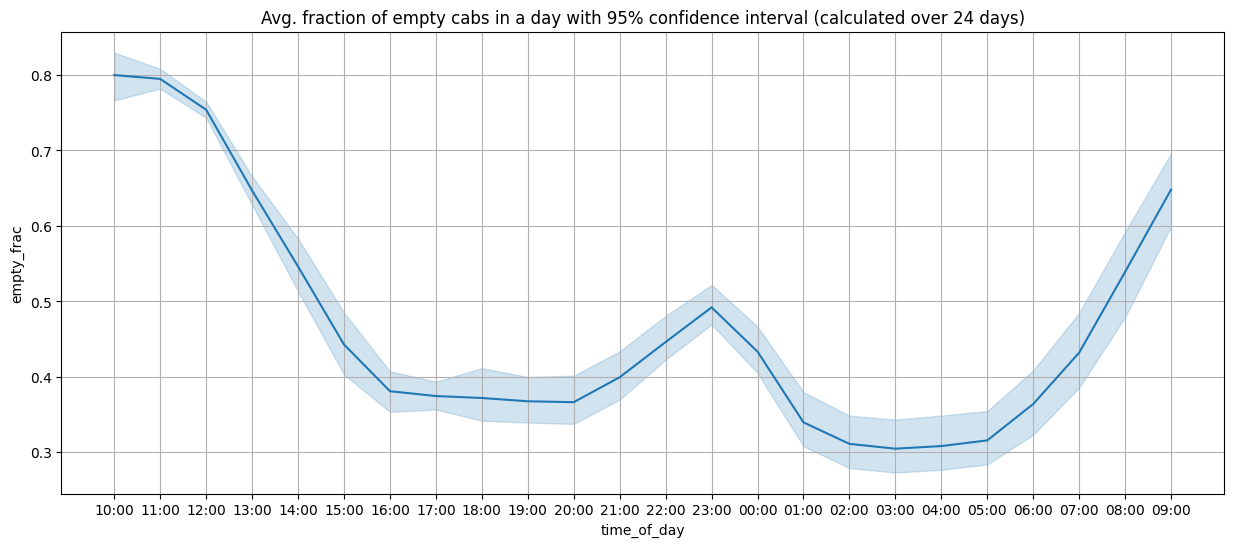
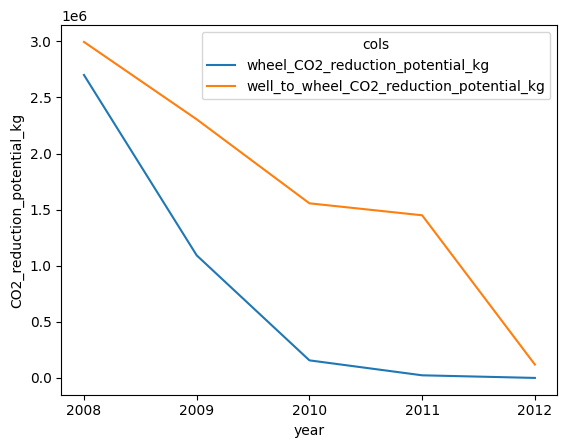
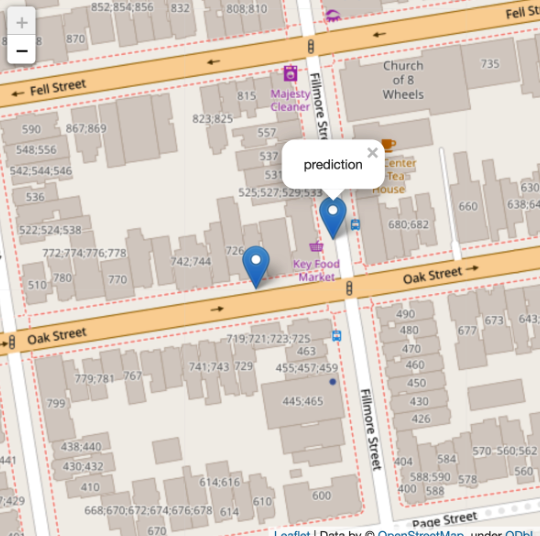
- EDA - Temporal Heatmaps | 2. CO2 reduction | 3. Passenger Prediction | 4. Cab Clusters
The repo contains four notebooks:
-
00_EDA_preprocessing.ipynb: The notebook states the business objectives and contains basic EDA and preprocessing of dataset. -
01_CO2_reduction.ipynb: The notebook explores the first task of estimating yearly CO2 emission reduction caused due to unoccupied cabs.- The notebook explores how to calculate the
distance(vectorized haversine) between two coordinates - Does more advanced EDA with trip duration and distances, ultimately finds and removes outliers
- remove cabs with very high (or low) speeds
- The notebook explores how to calculate the
-
02_passenger_prediction.ipynb: Notebook takes the processed data and builds a model for taxi drivers to predict location of next passengers. -
03_cab_clusters.ipynb: This notebook attempts to find cab clusters using ML and domain knowledge.- Uses advanced geoplotting to visualize the solution (notebook 0.)
- Segregates profit-making, under-utilized, efficient and liability cab drivers


