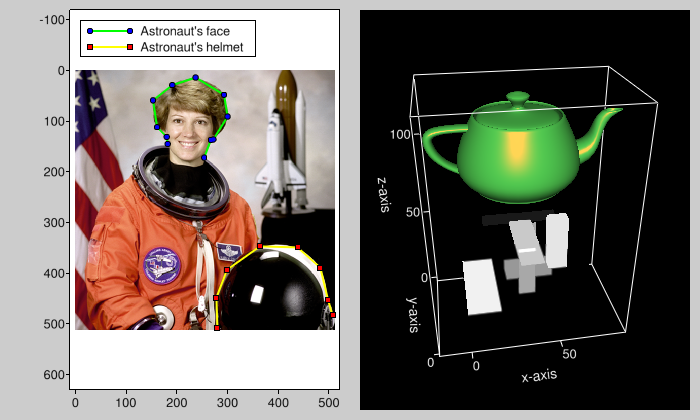
Visvis is a pure Python library
for visualization of 1D to 4D data in an object oriented way.
Essentially, visvis is an object oriented layer of Python on top of
OpenGl, thereby combining the power of OpenGl with the usability of
Python. A Matlab/Matplotlib-like interface in the form of a set of functions allows
easy creation of objects (e.g. plot(), imshow(), volshow(), surf()).
Visvis is cross-platform and runs on Python 2.x and Python 3.x. It depends on numpy, pyopengl, and needs a GUI backend (either PyQt4, PyQt5, PySide, Wx, GTK, FLTK).
Installation is best done via conda (conda install visvis) or pip (pip install visvis).
With visvis a range of different data can be visualized by simply adding world objects to a scene (i.e. an axes). These world objects can be anything from plots (lines with markers), to images, 3D rendered volumes, shaded meshes, or you can program your own world object class. If required, these data can also be moved in time.
Click on the figure to see the code and how one can interact with the figure.
The docs are on the wiki. Online documentation is available for all classes and functions. Any questions can be asked in the visvis discussion group.
At EuroScipy 2012, I gave a talk about Visvis. The long version of the presentation can be seen here.
Visvis has been relatively stable for several years. I am still maintaining it, but do not plan on making any major changes. Visvis will not make use of modern OpenGL, and will not work in the browser. It's API might be a bit idosyncratic (e.g. methods are UpperCamelCase) because I started working on Visvis before I knew about PEP8.
See Vispy for a similar (but more modern) visualization library.
Visvis makes use of the liberal BSD license. See license.txt for details.
