Unbug is a tiny debugging utility for Node.js.
~$ npm install unbugThe default export of unbug is a function, which takes the name of the module
you are debugging. It will return a wrapper around console.debug for you to
debug things. This will allow you to toggle debugging on and off for different
parts of you app and the whole.
import unbug from 'unbug';
import http from 'http';
import worker from './worker.js'; // fake worker of some kind

const debug = unbug('my-app');

debug('Booting up');

http.createServer((req, res) => {
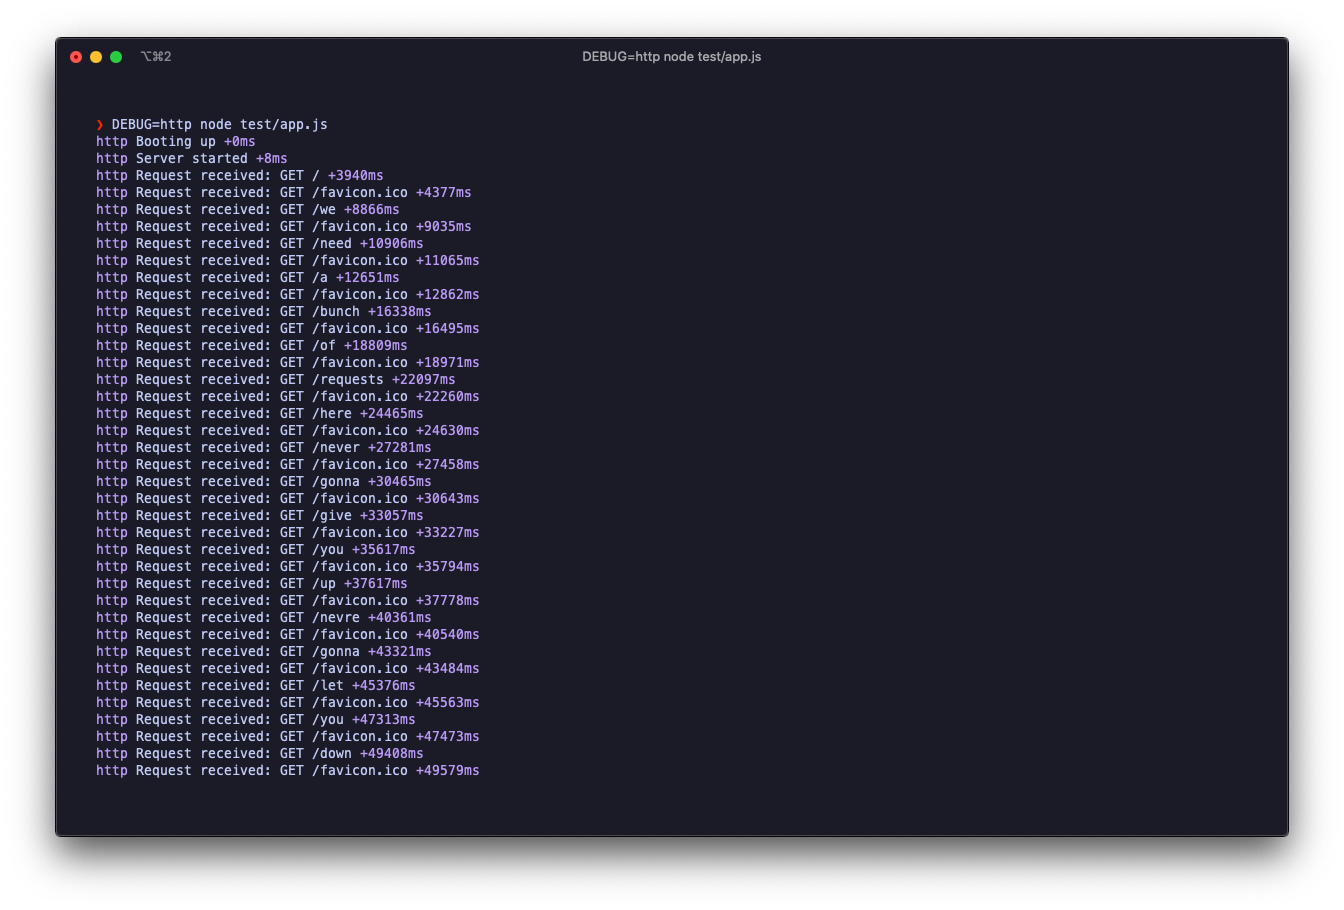
  debug('Request received: %s %s', req.method, req.url);
  res.end('Hello');
}).listen(3000, () => debug('Server started'));

worker.workA();
worker.workB();
worker.js
import unbug from 'unbug';

const worker = unbug('worker');
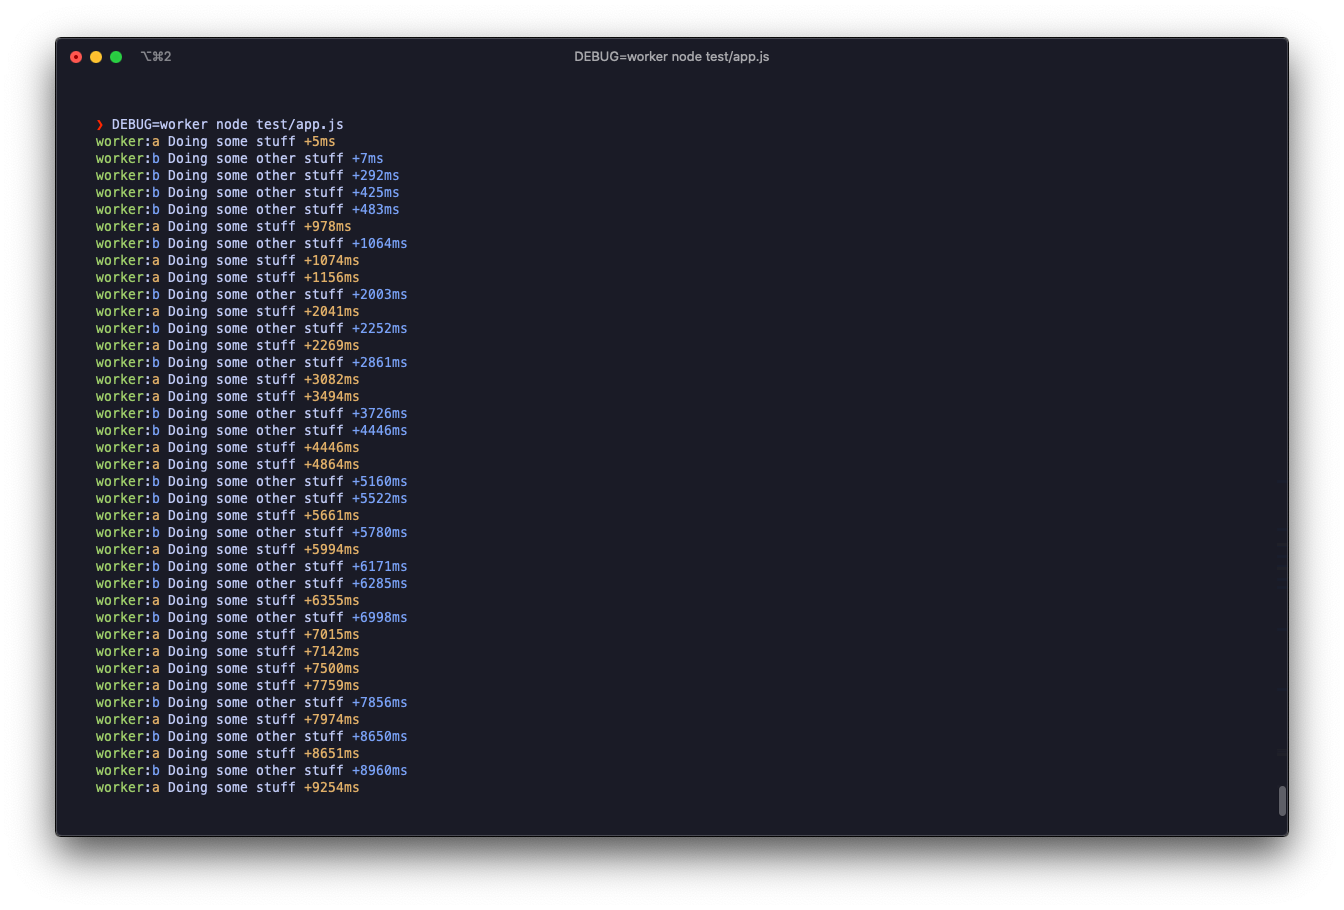
const a = worker.extend('a');
const b = worker.extend('b');

export function workA() {
  a('Doing some stuff');
  setTimeout(workA, Math.random() * 1000);
}

export function workB() {
  b('Doing some other stuff');
  setTimeout(workB, Math.random() * 1000);
}
We can now use the DEBUG environment variable to toggle debugging on and off
Here are some examples:
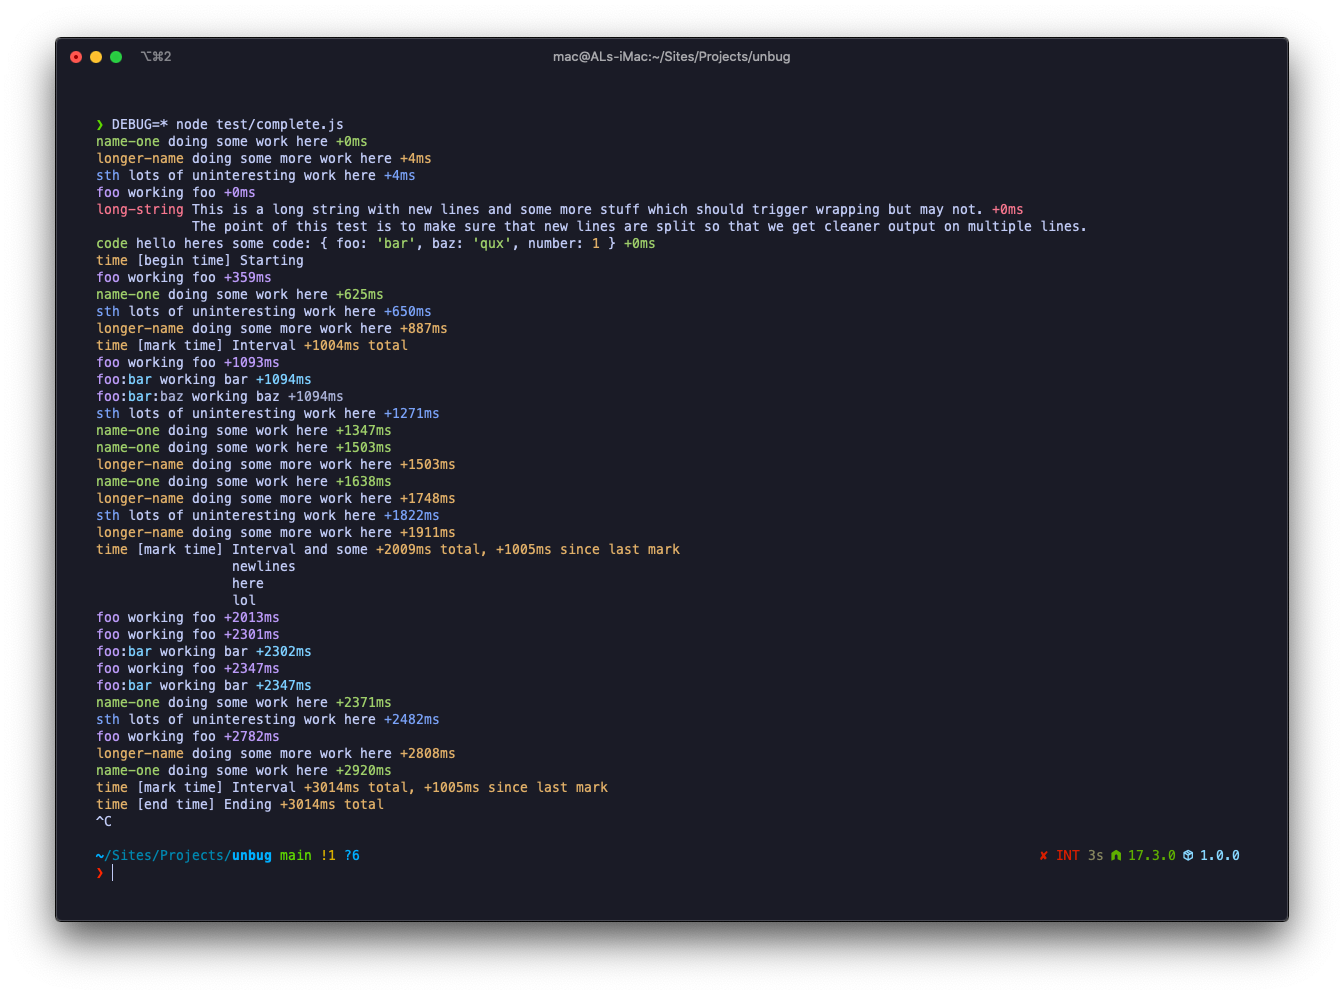
Every debugging namespace (aka scope) has a color associated with it. This can help visually identify which debugging messages belong to which scope.
The colors can be disabled by setting the DEBUG_COLORS environment variable to
something falsy (false, no, 0, nope, etc.)
The colors used can be configured. See Configuration for more
When actively working on an application, it may be helpful to see the times
between unbug calls. Unbug shows you a +NNNms diff between debug calls.
For more advanced timing utilities, check out debug.time
You can extend unbug instances. If you enable an instance, all it's nested instances will also be enabled, unless you explicitly filter them out.
import unbug from 'unbug';

const node = unbug('node');
const worker = node.extend('worker');
const thread = worker.extend('thread');
const app = thread.extend('app');

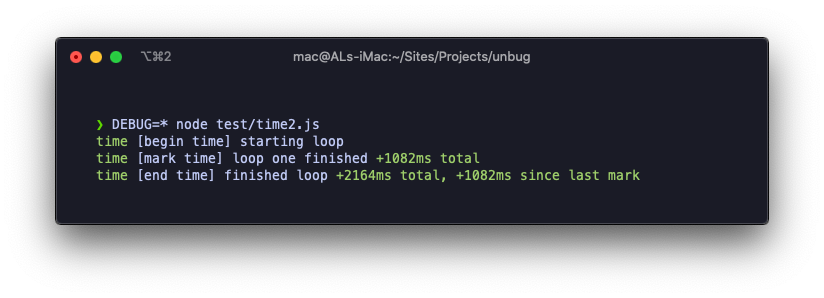
app('Doing some stuff'); // => node:worker:thread:app Doing some stuffYou can use unbug to time things. Every unbug instance has a .time, .timeMark and .timeEnd
method:
import unbug from '../index.js';

const time = unbug('time');

time.time('starting loop');
for (let i = 0; i < 1e9; i++) {}
time.markTime('loop one finished')
for (let i = 0; i < 1e9; i++) {}
time.endTime('finished loop');The DEBUG variable is a comma-separated list of scopes.
Each scope can contain a wildcard * to match any number of scope (not greedy).
For example, if you have debug:a:worker, debug:b:worker and
debug:a:something-else, you can set DEBUG=debug:*:worker to see all worker debugging.
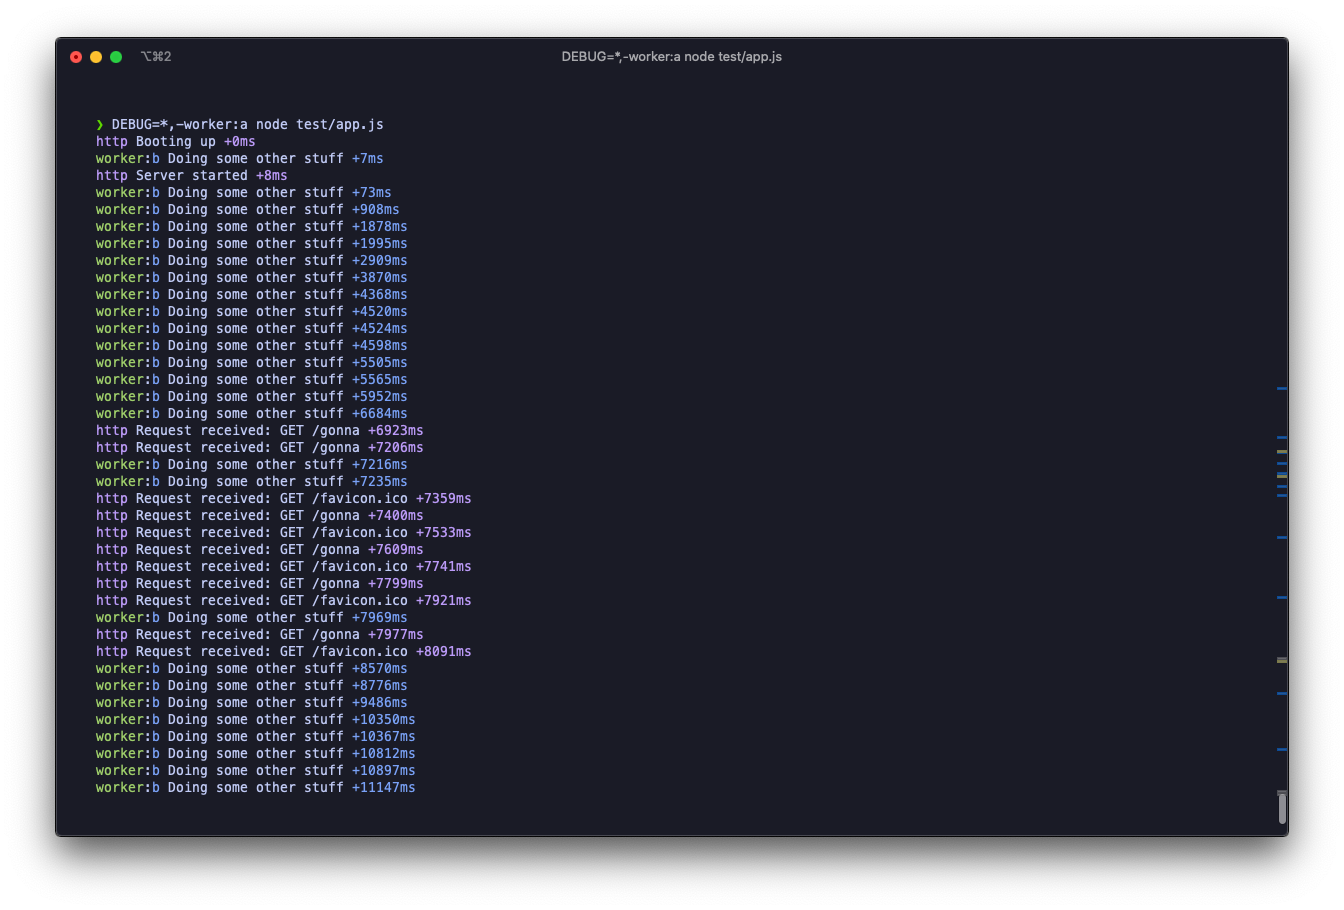
You can also negate scopes by prepending a - to it's name. For example,
DEBUG=*,-worker:a will output all debugging except for worker:a.
Unbug uses the builtin util.formatWithOptions to format the output. The
options sent to util.formatWithOptions can be configured. See Configuration
for details.
Every unbug instance has an .events property which is an instance of EventEmitter.
It emits the following events:
log(scope, text): emitted when a message is loggedlogskip(scope, text): emitted when unbug is called but the corresponding debugger has been disabledtimestart(scope, text, startTime): emitted when a timer startstimestartskip(scope, text, startTime): emitted when a timer starts but the corresponding debugger has been disabledtimemark(scope, text, timerCallTime): emitted when a timer marks a timetimemarkskip(scope, text, timerCallTime): emitted when a timer marks a time but the corresponding debugger has been disabledtimeend(scope, text, endTime): emitted when a timer endstimeendskip(scope, text, endTime): emitted when a timer ends but the corresponding debugger has been disabled
You can use these events to do your own logging
Unbug exports a configure function which takes a configuration object. These
are the possible configurations:
import {configure} from 'unbug';

configure({
	// The colors to use for scopes. If we run out of colors, we'll reuse them
	colors: [
		'\x1b[38;5;2m',
		'\x1b[38;5;3m',
		'\x1b[38;5;4m',
		'\x1b[38;5;5m',
		'\x1b[38;5;6m',
		'\x1b[38;5;7m',
		'\x1b[38;5;9m',
		'\x1b[38;5;10m',
		'\x1b[38;5;11m',
		'\x1b[38;5;12m',
		'\x1b[38;5;13m',
		'\x1b[38;5;14m',
	],

	// The debug string
	debug: process.env.DEBUG || '',
	// whether to use colors
	useColor: falsyStrings.includes(process.env.DEBUG_COLOR) ? false : true,

	// The options passed to util.formatWithOptions
	// The default options aim to shorten the output as much as possible
	inspectOptions: {
		colors: true,
		maxArrayLength: 5,
		maxStringLength: 20,
		breakLength: process.stdout.columns || 80,
		compact: true,
	}
});
Remember to call configure before using unbug, otherwise some logs may be
wrongly configured.

