A realtime earthquake predictor web app with google maps API, that forecasts earthquake possible epicenters and places in window of next 7 days.
-
Data/: Notebook and HTML fileETL_USGS_EarthQuake.ipybnfor ETL and EDA part of the project, and it also contains cleaned data in Earthquake.db & Earthquake_data.db format saved after ETL process -
models/: Notebook and HTML fileEarthquake-prediction-ML-workflow.ipybnwhich has all the implementation after related to Prediction steps and Machine Learning pipeline. -
Webapp/: all the necessary routing python files inmain.pyfor flask application i.e from data extraction to modeling application and convert prediction co-ordinates to google maps api format.
I have implemented all the neccesary steps in these IPYBN notebooks. I recommend for project walkthrough follow -
-
For ETL walkthrough open
Data/ETL_USGS_EarthQuake.ipybnorData/ETL_USGS_EarthQuake.html -
Next, go to
models/Earthquake-prediction-ML-workflow.ipybnormodels/Earthquake-prediction-ML-workflow.htmlfor ML and workflow.
Requirements
- click==7.1.2
- Flask==1.1.2
- gunicorn==20.0.4
- itsdangerous==1.1.0
- Jinja2==2.11.2
- joblib==0.16.0
- MarkupSafe==1.1.1
- numpy==1.19.1
- pandas==1.1.0
- python-dateutil==2.8.1
- pytz==2020.1
- scikit-learn==0.23.1
- scipy==1.5.2
- six==1.15.0
- sklearn==0.0
- SQLAlchemy==1.3.18
- threadpoolctl==2.1.0
- Werkzeug==1.0.1
- xgboost==1.1.1
- python3.x
Linux/Mac Users
Note for windows user : install gitbash and proceed with same instruction as linux.
step 1 : $ git clone https://github.com/aditya-167/Realtime-Earthquake-forecasting.git
step 2 : $ cd Realtime-Earthquake-forecasting
step 3 : $ python3 -m venv <<any environment name>> (If error occurs, download virtual
environment for python)
step 4 : $ source <<any environment name>>/bin/activate
step 5 : $ pip install --upgrade pip
step 6 : $ pip install -r requirements.txt (If error occurs in xgboost installation, upgrade pip
using step 5)
step 7 : Run application with $ python application.py i.e in root directory of project repo.
step 8 : Go to local host when application starts and use slider to choose dates for prediction in app.
- Project Overview
- Problem Statement and approach to solution
- Metrics
- Dataset
- Exploratory Data Analysis and Data processing
- Model implementation
- Improvement and evaluation
- Prediction and web application
- Improvement and conclusion
- acknowledgement
Countless dollars and entire scientific careers have been dedicated to predicting where and when the next big earthquake will strike. But unlike weather forecasting, which has significantly improved with the use of better satellites and more powerful mathematical models, earthquake prediction has been marred by repeated failure due to highly uncertain conditions of earth and its surroundings. Now, with the help of artificial intelligence, a growing number of scientists say changes in the way they can analyze massive amounts of seismic data can help them better understand earthquakes, anticipate how they will behave, and provide quicker and more accurate early warnings. This helps in hazzard assessments for many builders and real estate business for infrastructure planning from business perspective. Also many lives can be saved through early warning. This project aims a simple solution to above problem by predicting or forecasting likely places to have earthquake in next 7 days. For user-friendly part, this project has a web application that extracts live data updated every minute by USGS.gov and predicts next likely place world wide to get hit by an earthquake, hence a realtime solution is provided.
Anticipating seismic tremors is a pivotal issue in Earth science because of their overwhelming and huge scope outcomes. The goal of this project is to predict where likely in the world and on what dates the earthquake will happen. Application and impact of the project includes potential to improve earthquake hazard assessments that could spare lives and billions of dollars in infrastructure and planning. Given geological locations, magnitude and other factors in dataset from https://earthquake.usgs.gov/earthquakes/feed/v1.0/csv.php for 30 days past which is updated every minute, we predict or forecast 7 days time in future that is yet to come, the places where quake would likely happen. Since this is event series problem type, proposed solution in this project follows considering binary classification of earthquake occurance with training period includes fixed rolling window moving averages of past days while for which its labels, a fixed window size shifted ahead in time. The model will be trained with Adaboost classifier (RandomForestClassifier and DecisionTreeClassifier) and compared with XGBoost based on AUC ROC score and recall score due to the nature of problem (i.e binary classification). Model with better AUC score and recall will be considered for web app that uses Google maps api to predict places where earthquake might occur.
The problem addressed above is about binary classification, Earthquake occur = 1 and Earthquake not occur = 0 and with these prediction we try to locate co-cordinates corrosponding to the predictions and display it on the google maps api web app. More suitable metrics for binary clsssification problems are ROC (Reciever operator characteristics), AUC (Area Under Curve), Confusion matrix for Precision, recall, accuracy and sensitivity. One important thing about choosing metrics and model is what exactly we need from predictions and what not. To be precise, we need to minimize or get less False negative predictions since we dont want our model to predict as 0 or no earthquake occured at particular location when in reality it had actually happend as this is more dangerous than the prediction case in which prediction is true/1 or earthquake occured but in reality it did not because its always better safe than sorry!!!. Hence apart from roc_auc score, I have considered
Recall as well for evaluation and model selection with higher auc_roc score and recall, where recall = (TP/TP+FN).
Real time data that updates every minute on https://earthquake.usgs.gov/earthquakes/feed/v1.0/csv.php for past 30 days. Below is the feature description of the dataset with 22 features and 14150 samples at the time of training.
- time ---------------------- Time when the event occurred. Times are reported in milliseconds since the epoch
- latitude ------------------- Decimal degrees latitude. Negative values for southern latitudes.
- longitude ------------------ Decimal degrees longitude. Negative values for western longitudes.
- depth ---------------------- Depth of the event in kilometers.
- mag ------------------------ Magnitude of event occured.
- magType -------------------- The method or algorithm used to calculate the preferred magnitude
- nst ------------------------ The total number of seismic stations used to determine earthquake location.
- gap ------------------------ The largest azimuthal gap between azimuthally adjacent stations (in degrees).
- dmin ----------------------- Horizontal distance from the epicenter to the nearest station (in degrees).
- rms ------------------------ The root-mean-square (RMS) travel time residual, in sec, using all weights.
- net ------------------------- The ID of a data source contributor for event occured.
- id -------------------------- A unique identifier for the event.
- types ----------------------- A comma-separated list of product types associated to this event.
- place ----------------------- named geographic region near to the event.
- type ------------------------ Type of seismic event.
- locationSource -------------- The network that originally authored the reported location of this event.
- magSource ------------------- Network that originally authored the reported magnitude for this event.
- horizontalError ------------- Uncertainty of reported location of the event in kilometers.
- depthError ------------------ The depth error, three principal errors on a vertical line.
- magError -------------------- Uncertainty of reported magnitude of the event.
- magNst ---------------------- The total number of seismic stations to calculate the magnitude of earthquake.
- status ---------------------- Indicates whether the event has been reviewed by a human.
Data Info:-
Null values
Input to model from dataset has many important features to consider as time,latitude & longitude,depth of quake,magnitude,place, rest other features are error and non supporting features for classification, below shows the null value counts for some features and what to do with that.

-
We can see lots of null values of certain features, but as part of prediction most of the features that address 'error' in measurement have missing values, thus for feature selection we consider only certain features in final dataframe, hence I choose simply drop or ignore the null values.
-
Apart from features in dataset we focus on, I have done some feature Engineering based on some considerations on my model as follows:
- Set rolling window size for future prediction based on past values with fixed window size in past
- I have created 6 new features based on rolling window size on average depth and average magnitude.
- A final outcome 'mag_outcome' has been defined as target values and the output is considered as shifted values from set rolling window of past days eg: '7'. New features include : avg_depth, magnitude_avg for 22,15,7 days rolling window period for training.
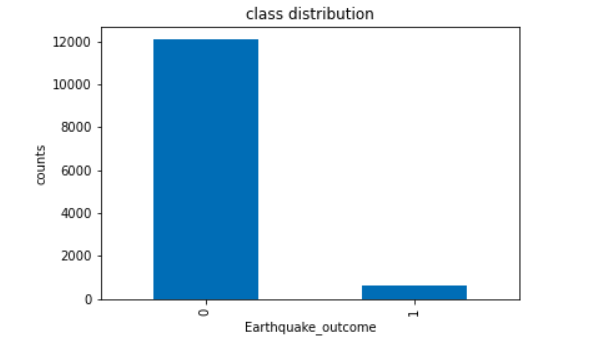
- After feature engineering and dealing with null values, the model has imbalance class distribution
- Accuracy is not the metric to use when working with an imbalanced dataset. We have seen that it is misleading.There are metrics that have been designed to tell you a more truthful story when working with imbalanced classes. such as collect more data, change metrics, resampling data, cross-validation dataset etc. For the project I have considered the metrics for treating this imbalance nature with-
- Confusion Matrix: A breakdown of predictions into a table showing correct predictions (the diagonal) and the types of incorrect predictions made (what classes incorrect predictions were assigned).
- Recall: A measure of a classifiers completeness
- ROC Curves: Like precision and recall, accuracy is divided into sensitivity and specificity and models can be chosen based on the balance thresholds of these values.
- Moreover the reason for choosing this metrics not only helps me improve class imbalance comfirmation bias but also due to my nature of problem to be solved of earthquake prediction False negative must be penalized more.
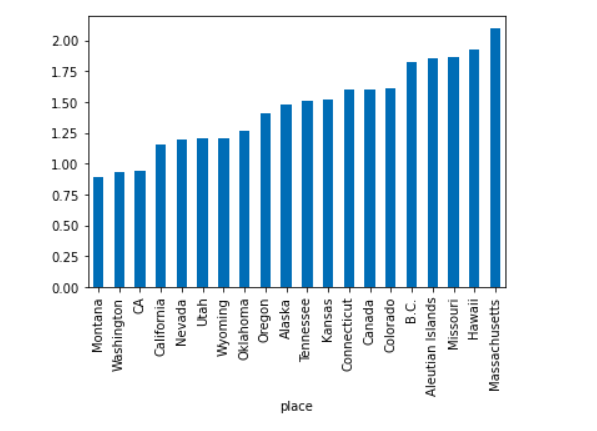
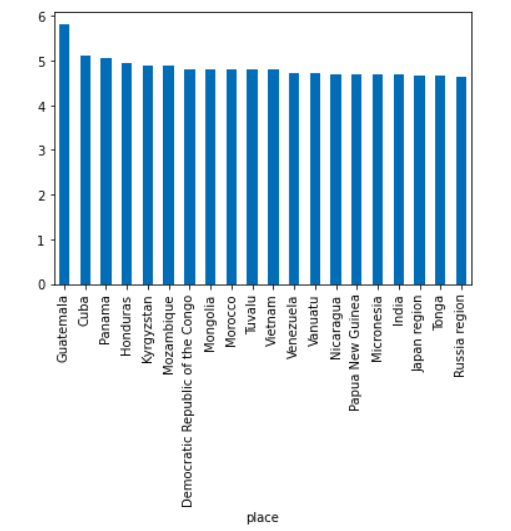
Lets analyse places with top 20 higher & lower number of magnitude mean
Top 20 places where lowest magnitude mean quake experienced in past 30 days.

Top 20 places where highes magnitude mean quake experienced in past 30 days.

- Finally for
mag_outcomefeature we created based on 7 days rolling window period in future as target, I have converted it to class as 1 or 0 based on magnitude outcome > 2.5
Rest of the part is best explained in project walkthrough notebooks Data/ETL_USGS_EarthQuake.ipybn or Data/ETL_USGS_EarthQuake.html.
Finally the cleaned data for prediction is stored in database file Data/Earthquakedata.db using sql engine.
Note : only for project walkthrough purpose cleaned data is stored in database but for realtime analysis, in Webapp/main.py flask app, we extract data on the go without storing. This make sures we get realtime data any day when web app is requested by any user.
After preprocessing with removing null values, and feature engineering as discussed above, I performed Boosting algorithms for classification problem.
-
Adaboost classifier with estimator as DecisionTreeClassifier
-
Adaboosr classifier with estimator as RandomForestClassifier
-
Finally I tried Xgboost algorithm.
For all the above algorithms,
- DecisionTreeClassifier
max_depth =[2,6,7], n_estimators = [200,500,700] and used gridsearch CV for best estimator as nodes are expanded until all leaves are pure or until all leaves contain less than min_samples_split = 2 samples which helps for classification with various types of features in dataset.
- RandomForestCLassifer
Same parameters were used for randomforest as well to compare the algorithms used with gridsearchCV along with another hyperparamter max_features= ['auto','sqrt','log2'] that will let select features based on log(featues), sqrt(features) etc.
- XgboostClassifier
I did not use grid Search CV here since, it took me more very long to train, hence I tried max_depth same as above algorithms with best fit, i.e 6, learning_rate=0.03 and gbtree as booster
model selection was based on Evaluation on roc_auc score and recall and hyperparameter tunning.
A better walkthrough is mentioned with great detail in models/Earthquake-predictor-ML-workflow.ipybn or models/Earthquake-predictor-ML-workflow.html.
max_depth hyperparameter along with n_estimator was important as this indicates how deep the tree can be. The deeper the tree, the more splits it has and it captures more information about the data due eqarthquake data being only for past 30 days and features such as rolling window time period of magnitude.
max_features hyperparameter is used since it ensures how many features to take in account for classification. Due to features such as maginutude and depth of quake for 22,15,and 7 days, this hyperparameter takes care of how many to pay attention to. GridSearchCV will take care of what features to take depending on sqrt(num_features),log(num_features),auto(num_features).
- I have used gridsearch CV for improving model and hyperparameter tunning on Adaboost classifier with base estimators as
DecisionTreeClassifierandRandomForestClassifier. - Using the same hyper parameters I trained XGBoost. As mentioned above, metrics for evaluation is
roc_auc scoreandrecall.
DecisionTreeClassifier adaboost
- With adaboost decision tree classifier and hyper parameter tunning, we get area under curve (score) = 0.8867
- higher the auc score, better is the model since it is better at distinguishing postive and negative classes.
- Make a note here that we get from confusion matrix,
False negative = 42andRecall score =0.7789. We need this value apart from auc score that we will analyze later when we have tested with diffferent models below
I got Best estimator with max_depth = 6 and for n_estimators = 500 after running gridSearchcv.
model selection is based on metrics score after comaparing all the algorithm score
RandomForesClassifier adaboost
- Below is the auc score for adaboost RandomForest classifier with 0.916 which is slightly lower than Decision tree classifier
- Moreover when we look at confusion matrix,
False Negative=38and `Recall score = 0.8' can be observed which is slightly higher than recall score of decision tree. Thus performs better than decision tree adabooost
Random forest gets best estimator with max_depth = 7 and max_feature = sqrt(features)
model selection is based on metrics score after comaparing all the algorithm score
XGBoost model
-
I have also tested with xgboost model below with similar parameters as I got above, since grid search CV was taking lot of time for xgboost.
-
With
Estimators = 500, andlearning rate =0.03as we can see this significantly gives higher AUC score of almost 0.98 and alsoFalse negative = 37which is similar Random Forest adaboost but xgboost has higher True positive and less False Positve compared to Random forest adaboost. i.eRecall score = 0.805which is similar adaboost Random Forrest tree. But XGboost is really good at classifying positive and negative classes and also betteraur_roc_score = 0.98193. We can see above that xgboost algorithm has higher auc score (0.9819) than adaboost decision tree and random forest, as it is evident from the ROC curve.
- Since Xgboost model having higher
recall&auc_scorethan other alorithms, it can be considered more robust as it has ability to handle class imbalance with recall score, and deal good with False negative values and penalize it which is important for our task. i.e reduce False Negative values. Hence we consider xgboost for prediction of live data and deployment in the application.
-> For more insights go : models/Earthquake-predictor-ML-workflow.ipybn or models/Earthquake-predictor-ML-workflow.html.
- Select specific features such as
data,place,long,latand give earthquake probablity from prediction at that place and date asquakeprobability - with taking only 7 days rolling period data from predict dataframe since this outcome value is NaN and we need to predict next 7 days period.
Prediction for a particular day
Web App
-
Now its time to deploy the model on web application with flask and I have chosen it to deploy on https://www.pythonanywhere.com/ which is a free hosting cloud platform for web flask applications.
-
Main Idea of Application will be predicting or forecasting these earthquake sites on given day all over the world.
-
The user has option to change the date using a slider and look at predicted places all over the world where earthquake is likely to happen. App.
-
Application uses google maps api, hence the coordinates we get from the prediction of our model needs to be converted to api format. This has been done and can be viewed
Webapp/main.py
Though XGboost model has given Higher roc_auc and better recall, I believe any work given always has some scope for improvement and in here we could also use RNN or LSTM for time series or rather event series forecasting. LSTMs have hidden memory cells that help in remembering and handeling time series or event series data well. Moreover for xgboost I have just used hyper parameters from already tuned Adaboost models, but we can also tune xgboost hyper parameter and find best parameters using GridSearchCV or RandomSearch.
Some final thoughts
-
So far the model looks good with xgboost as chosen model for predictions in web app haveing higher auc score and higher recall_score as I have explained under XGBoost result section why auc and recall score are chosen.
-
Our main Aim is to predict wether earthquake will happen or not at a given day and place. So we definitely would not like the model with higher False Neagtive values , since its more dangerous to predict as no earthquake while in reality earthquake happend than predicting earthquake will happen given in reality it did not. We can allow False positive more than False negative
-
After seeing these comparision on auc_roc score, confusion matrix, and recall score, since all the above algorithm have given similar result with slightly different recall scores, Xgboost with
FN=37but with higherauc_score 0f 0.98performs over-all better. Hence for webapplication deployment, I have chosen Xgboost as it also faster than adaboost.
Hence with all the mentioned implementation, the web application was successfully deployed and necessary project walktrhough can be accessed from Data and models directory.


