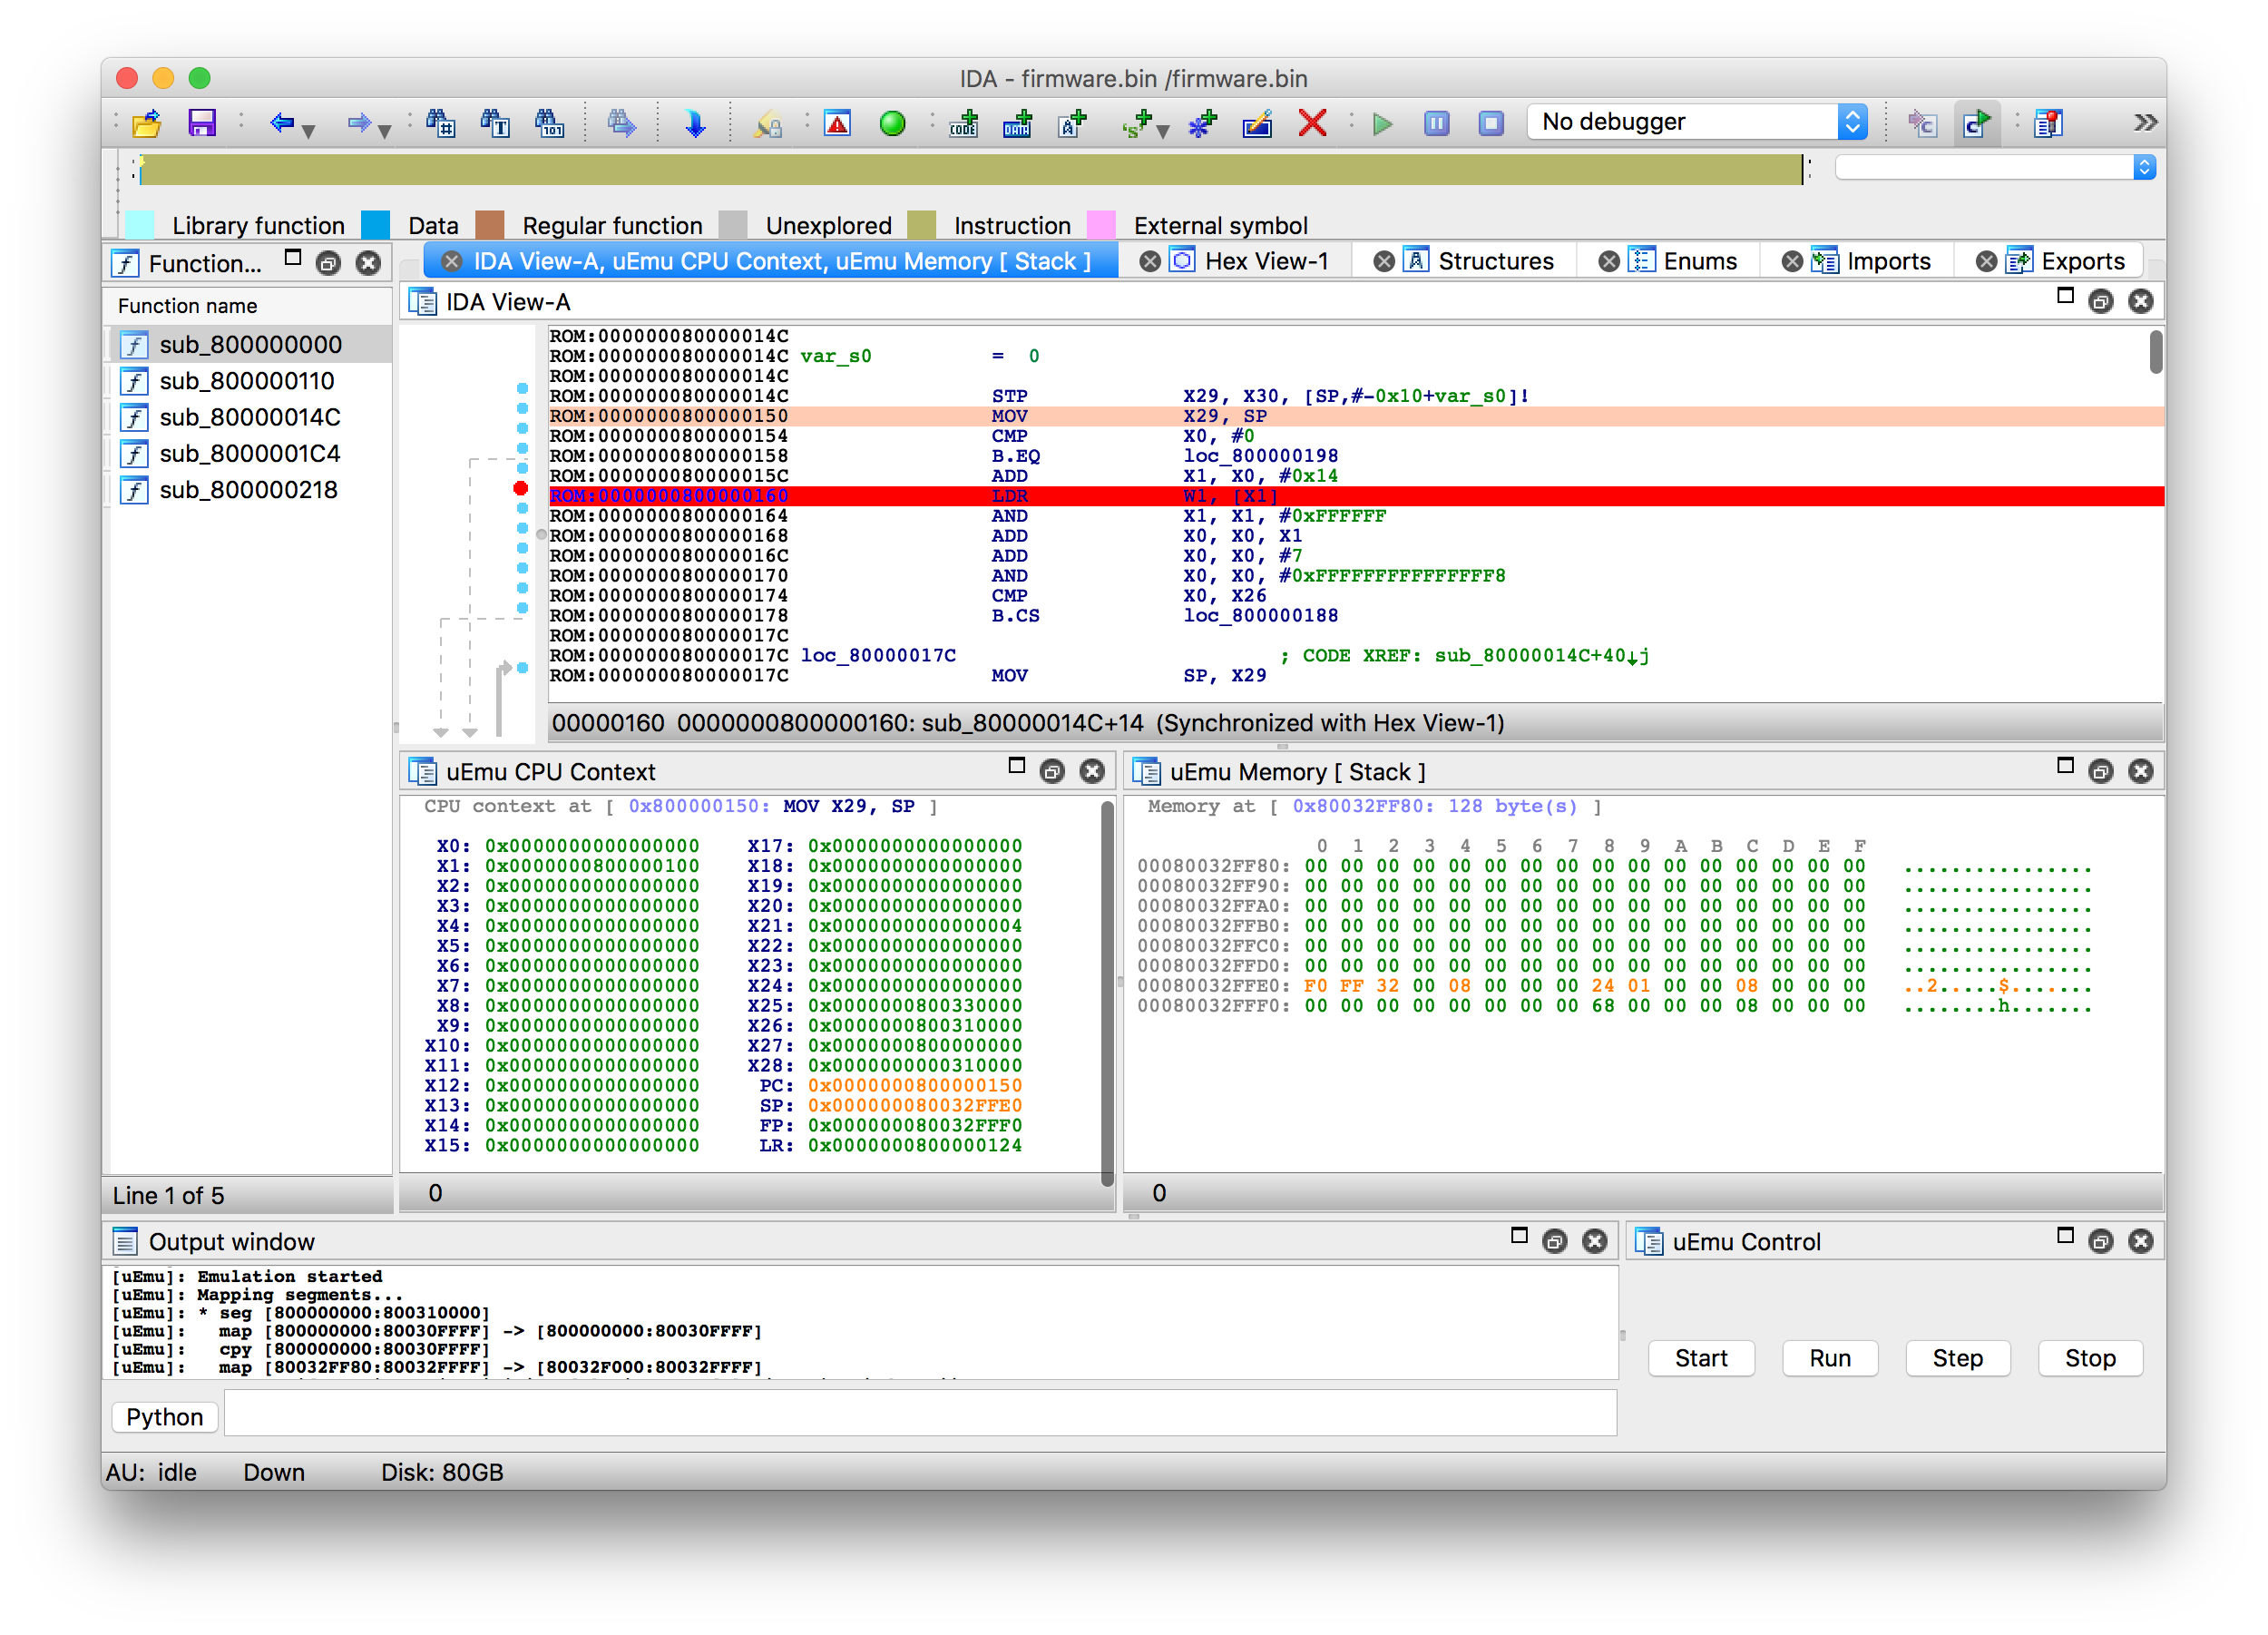
uEmu is a tiny cute emulator plugin for IDA based on unicorn engine.
Supports following architectures out of the box: x86, x64, ARM, ARM64, MIPS, MIPS64
- Emulate bare metal code (bootloaders, embedded firmware etc)
- Emulate standalone functions
- Emulate complex OS code (dynamic libraries, processes etc)
- Emulate code with many syscalls
- Find a way to emulate vendor specific register access (like
MSR S3_x, X0for ARM64) - Add more registers to track
brew install unicornto install Unicorn binariespip install unicornto install Unicorn python bindings- Use
File / Script file...orALT+F7in IDA to load uEmu.py
Optionally uEmu can be loaded automatically as IDA plugin. In this case put it into [IDA]/Plugins folder and change USE_AS_SCRIPT to False inside uEmu.py
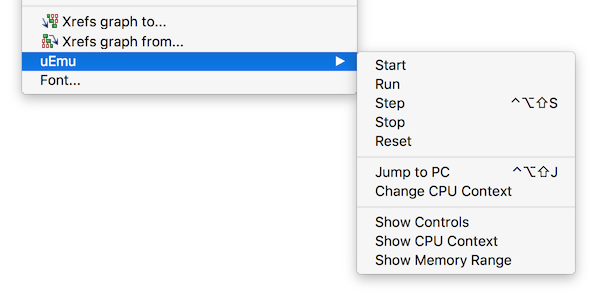
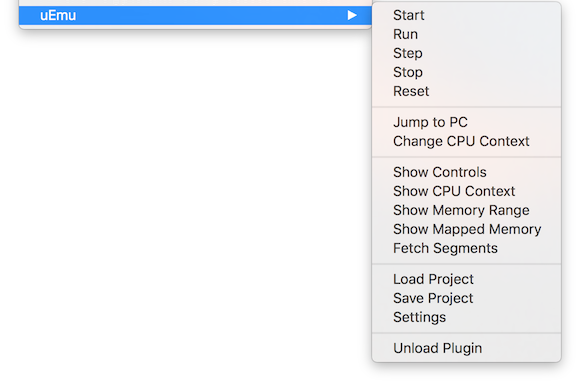
- Start command initializes emulator by mapping all segments and setting up Unicorn
- Run command emulates instructions until breakpoint is reached or error occurs
- Step emulates one or N instruction (hold
ALT/OPTIONto specify a number) - Stop interrupts emulation
- Reset resets emulation engine and unmaps all memory regions
- Jump To PC simply jumps to current PC
- It is possible to Update CPU Context manually or via JSON file (see below)
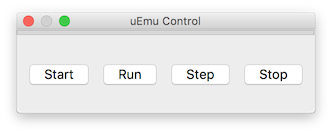
- Show Controls displays window with Start/Run/Step/Stop buttons
- Show CPU Context displays window with available registers
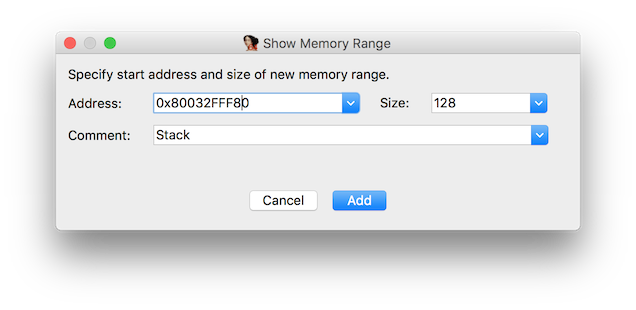
- Show Memory Range allows to display specific memory region
Start emulation from cursor. It is necessary to provide initial CPU context first (see Update CPU Context) After that all segments from IDA database will be mapped to emulator (initialized data will be copied as well).
Execute code until code or memory breakpoint is reached or there is an event which requires user action.
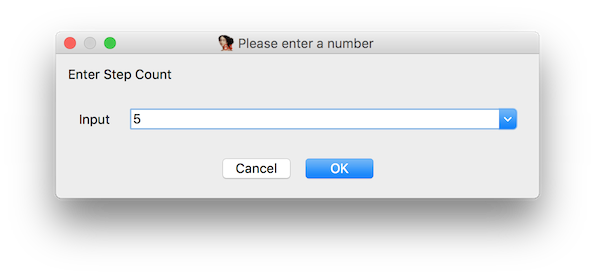
Perform a single step execution. Hold ALT/OPTION to specify number of steps to perform.
When emulation is in progress this command can be used to interrupt execution.
Resets emulator instance and unmaps all memory regions.
You can use IDA breakpoints to indicate locations where emulation should be interrupted. This includes code and memory breakpoints. Usually used together with Run command.
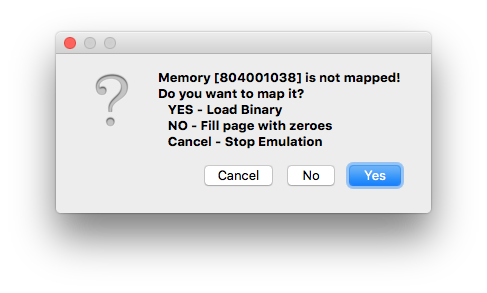
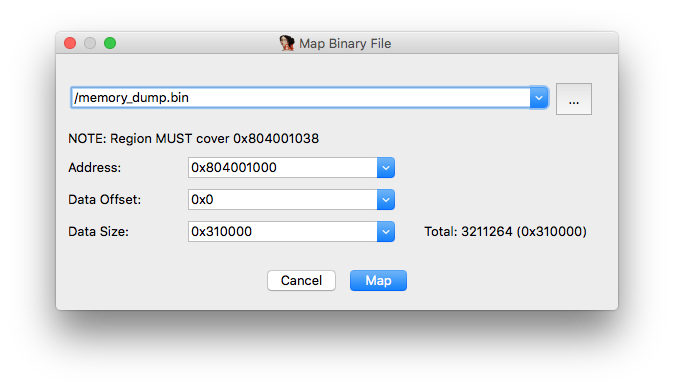
When emulator needs to access memory which is not yet mapped, plugin will show a following dialog.
- Press YES to provide memory dump to be loaded to memory.
- Press NO to map one empty page (0x1000) filled with zeroes
- Press Cancel to stop emulation
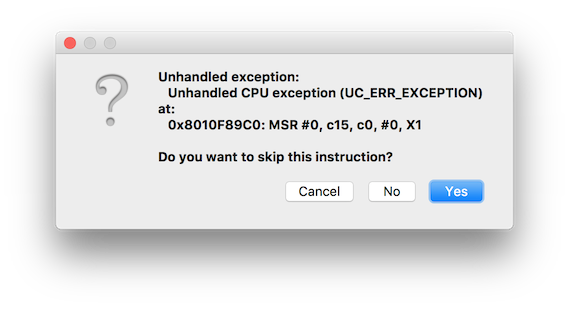
When emulator runs into unknown instruction it is possible to skip it and restore CPU context manually.
Just a panel to control execution.
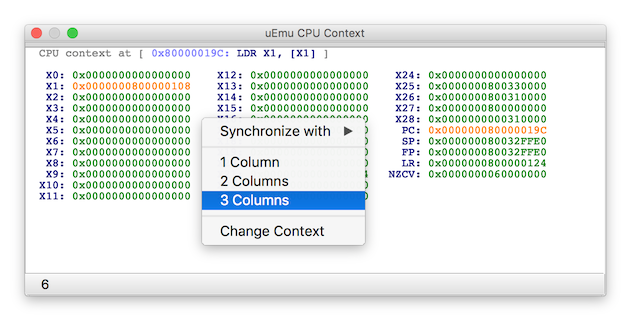
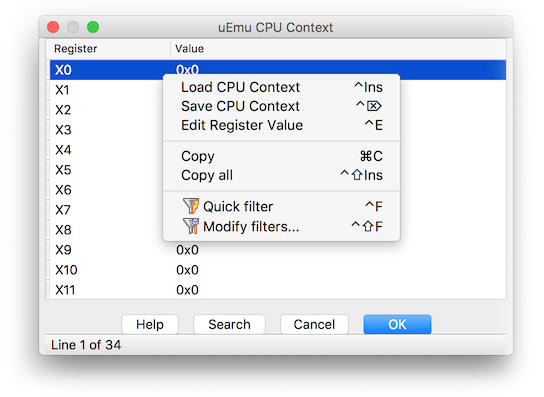
Current CPU context.
Every time emulation stops, changed registers will be highlighted. Registers can be displayed in 1, 2 or 3 columns via popup menu.
It is possible to update CPU context via popup menu (see below).
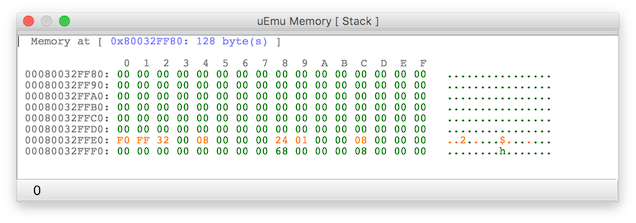
Use this view to observe memory regions for specified address and size. Comment will be displayed in a title for convenience.
Every time emulation stops, changed memory blocks will be highlighted.
Register Values can be changed individually or all at once with JSON file via popup menu. Current context can also be saved in JSON file for future use.
Apart from all the functions listed in Popup Menu, there are couple of new commands.
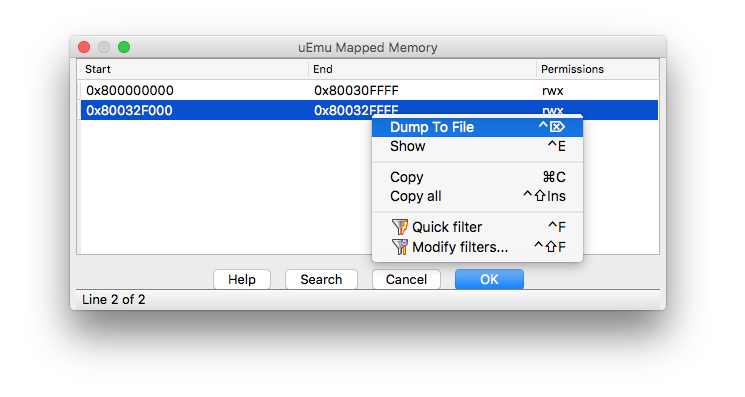
Display all mapped regions. Use popup menu to display memory for particular region or dump it to a file.
This command tries to sync IDA segments with mapped memory by creating new mappings or merging with existing ones if possible. This helps to add new IDA segments to emulator in runtime without restarting emulator.
Load uEmu state from file.
Save uEmu state to file. Please note that only registers defined in a plugin are saved.
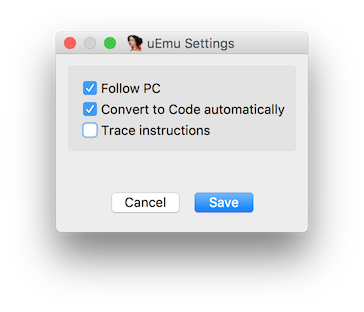
- Follow PC scrolls IDA View to current PC during emulation
- Convert to Code automatically is IDA data under cursor is not code
- Trace instructions prints every instruction emulator is executing
