Replication material for the paper by John Wilkerson and Andreu Casas on Text as Data at the Annual Review of Political Science:
Wilkerson, John and Andreu Casas. 2017. "Large-scale Computerized Text Analysis in Political Science: Opportunities and Challenges." Annual Review of Political Science, 20:p-p. (forthcoming)
- Clone the repository
- Open the
Rprojectwilkerson_casas_2017_TADinRStudio, or set up this repository as your working directory inR - The
datadirectory contains all the final datasets we used in the paper - The text and metadata of the one-minute floor speeches can be found in the python module we developed to estimate Robust Latent Dirichlet Allocation models: rlda
- The
01_getting_models_and_clusters.pyreproduces the construction of the final datasets - Scripts
02to05replicate Figures in the paper - Scripts
06and07create additional Figures that ended up not making it to the final verison paper - Figure 1 is from another paper by Chuang et al. (2015): it's Figure 3 at the top of p. 188.
- Figure 2 is simply a diagram and we do not include code to replicate it
- The
online_appendix.pdfconatins a list of top terms for the 50 clusters and extra information about the validation of the agriculture metatopic.
A. 01_getting_models_and_clusters.py
Only run this script if you want to generate again the main datasets used in the article. Skip otherwise: the data directory in this repository already contains the datasets needed to replicate the article's Figures. However, since algorithms randomly choose starting points when estimating topic models and clusters, the topic and cluster numbers that you get may be different than the ones we use in the other scripts. To exactly replicate the figures in the paper, simply run the other scripts.
This python script that does the following:
- Reads and pre-processes 9,704 one-minute floor speehces from the 113th Congress.
- Estimates 17 LDA topic models with different numbers of
ktopics (k= {10, 15, ..., 90}) - Classifies the speeches 17 times according to the models and saves the classifications in
csvfromat in thedata/classificationsdirectory. - Calculates the pairwise cosine similarity (n = 722,500) between all topics (n = 850) from the 17 models and saves the similarity scores in
csvformat:cos_list.csv - Uses Spectral Clustering and the cosine similarity scores to cluster topics into
cnumber of clusters (c= {5, 10, ..., 95}). Saves the resulting clusters in thedata/clustersdirectory. The script uses apythonmodule initially written for this paper: rlda (Robust Latent Dirichlet Allocation)
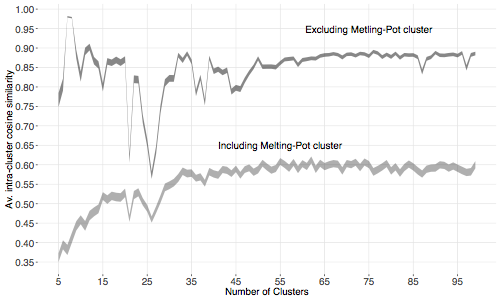
B. 02_figure_2.R: Replication of Figure 2 of the paper.
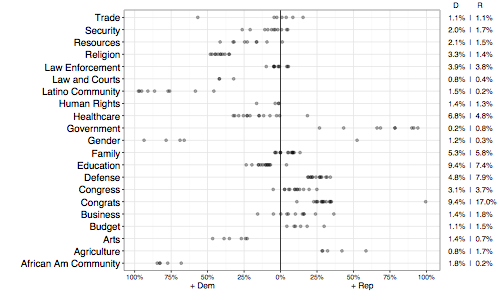
C. 03_figure_4.R: Replication of Figure 4 of the paper.
D. 04_figure_5.R: Replication of Figure 5 of the paper.
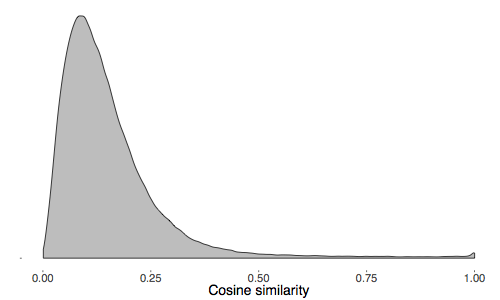
E. 05_extra_figure_1.R: Figure showing the density of all cosine similarities.
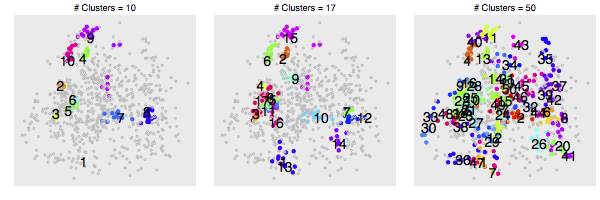
F. 06_extra_figure_2.R: Figure showing three Spectral Clusterings of the topics, with different number of clusters (c = {10, 17, 50})
G. 07_01_validation.R: Code used for the validation of the metatopic Agriculture in the Online Appendix. In the data directory there is also a dataset (agr_memb.csv) with district-member-level data about the percentage of district population working on the agricultural sector and percentage of representatives' speeches on Agriculture.


