This is a project that gathers useful scripts and used for analysing executables
instrumented with the llvm-xray project.
In particular, it is a playground to address where inefficiencies are coming by
computing stuff from the traces (i.e. computational complexity).
You may install these scripts by cloning this repository and installing it into your python environment:
git clone git@github.com:SoilRos/llvm-xray-tools.git
pip install --editable llvm-xray-tools
We recommend the an editable installation as above to allow you to edit the scripts to your needs without reinstallation.
Now, the llvm-xray-tools command may be reached from the terminal:
llvm-xray-tools --help
Then, you want to make sure that the script is able to reach the extraction
tools provided by llvm. To do so, install the llvm-tools and give the
desired llvm-xray executable to the XRAY_EXECUTABLE environment variable.
This may vary from system to system. For instance, in Debian, it would look like
this:
# for Debian
apt-get install llvm-9-tools
export XRAY_EXECUTABLE="llvm-xray-9"Caveat: instrumentation doesn't work on MacOS
XRay is a open source Google project that instrument event logs on entry and exit of functions. It may be used in production and be activated at any time during run time with relativetely low overhead.
To enable instrumentation, you should add the respective xray flags:
| Flag | Description |
|---|---|
-fxray-instrument |
Enable XRay instrumentation |
-fxray-instruction-threshold=50 |
It controls how big (instructions) a function should be to be instrumented |
-fxray-ignore-loops |
If present, loops are not considered whether to instrument a function |
-fxray-attr-list=xray-options.ini |
External source for instrumentation options |
No additional flags are required (e.g. -g, -O2, -fno-omit-frame-pointer).
A minimal example would be:
clang++ -fxray-instrument -O3 my_prgram.cc -o my_programFor more options, check the XRay documentation.
In order to estimate the complexity of the instrumented functions, you should
provide different inputs to the program. These inputs should depend on a
characteristic quantity n. We intend to estimate the complexity of executed
functions w.r.t. to n.
For instance, lets say that my_program receives a text file with the
information to run, and that you have prepared multiple inputs for each case you
want to test (e.g. test_2.txt, test_8.txt, test_14.txt, ..., test_32.txt).
In that case, you may provide the llvm-xray-tools with the program to be
executed:
llvm-xray-tools big_o --repeat 3 ./my_program test_2.txt test_8.txt test_14.txt ... test_32.txt

1780             Cubic: time = 0.0014 + 7.4E-08*n^3 (sec)
944               Quadratic: time = 2.7 + 0.036*n^2 (sec)
3850       Quadratic: time = -0.00054 + 3.1E-05*n^2 (sec)
3665    Linearithmic: time = 0.048 + 0.0047*n*log(n) (...
1125            Linear: time = -6.4E-06 + 0.00023*n (sec)

...

941                        Constant: time = 1.2E-05 (sec)
979                        Constant: time = 6.2E-06 (sec)
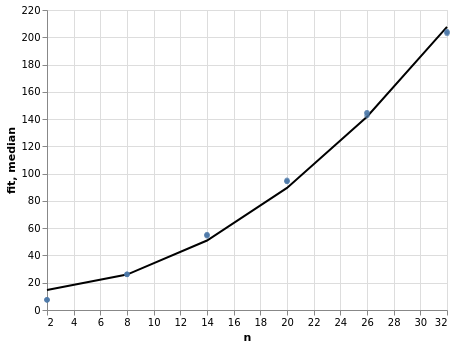
This will run the program 3 times (i.e. --repeat 3) for each input and produce
the complexity estimation for each function id. Notice that in this case, the
growth variable n is deduced by each input (i.e. 2,8,14,...,32), however, they
may be provided using the --n-list argument (e.g. --n-list 2,8,14,...,32).
Additionally, you may add the --plot-dir <dir> option to save the time graphs
for each function id.
To symbolize the function ids you can simply use the llvm-xray executable for
it:
llvm-xray extract my_program --symbolizeIf you need only one function id, grepping usually does the job. No need for complicated things here:
llvm-xray extract my_program --symbolize | grep "id: 1,"
- { id: 1, address: 0x0000000001FEF530, function: 0x0000000001FEF530, kind: function-enter, always-instrument: false, function-name: main, version: 2 }
- { id: 1, address: 0x0000000001FF0F96, function: 0x0000000001FEF530, kind: function-exit, always-instrument: false, function-name: main, version: 2 }
In heavily templated programs, even reading a single function is a hassle because
of the length of its signature. If you are suffering from that, use camomilla,
which tries to collapse inner template arguments to make text more readable
pip install camomilla
llvm-xray extract my_program --symbolize | grep "id: <function_id>," | camomillaWhy to use another tool if llvm already provides the
llvm-xrayexecutable.
The llvm-xray is fast and very useful to convert information from the binary
and from the events generated by the instrumentation. However, a scripting
language like Python is much more suitable to explore the resulting data sets.
Modifying Python scripts to your needs takes few minutes, while editing and
recompiling the llvm-xray executable is more cumbersome for such an
interactive procedure.
Why the results are not symbolized by default.
Because many C++ libraries use a fair amount of templates symbols are usually
quite big. Early symbolization usually produce a large amount of unmanageable
data (e.g. converting a fair amount of symbolized traces to the trace_event
format causes Google Chrome to not be able to load the data). Thus,
symbolization is left to the very end. That is, when you are ready with your
tracing analysis.
I implemented a script that might be useful to others
Create a Merge Request, I will be happy to check it out!
