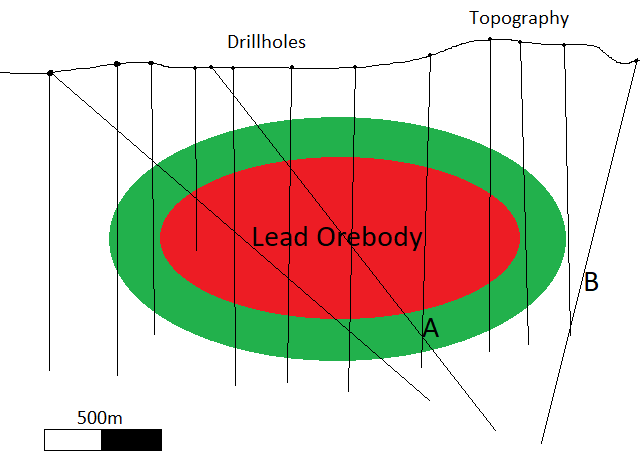
At Datarock's Broken Down lead deposit in rural Tasmania, resource drilling routinely acquires geochemical assays in all its drill holes. These assays give an indication of the metal abundances for each sample, which in turn helps us characterise the orebody and surrounding rockmass.
Recently, a geochemical consultant noticed that changes in the relative metal abundances could potentially be used to indicate proximity to the main orebody. Using a simple euclidean distance measure, she calculated the distance from each sample to the orebody wireframe (red) and then using that distance she classifies samples into two groups: A (proximal - Red/Green) and B (Distal - White).
Figure 1: Expertly drawn diagram showing a cross section of the orebody, the classes and the drill holes
- Can we use the same geochemical data and labels to generate a predictive model for future drill holes which can label samples on whether they are in class A or class B?
- More data has been acquired since the geochemist completed her work - can we predict labels onto these data points (labelled “?”).
- 4472 unique geochemical assay samples
- Drill hole metadata included (uniqueID, holeid, from, to) - each one of these samples is derived from rock extracted from the ground which has been assayed to determine its chemical breakdown. Some not-required but additional information: ALS
- 8 assay elements - As, Au, Zn, Fe, S, Cu, Mo and Pb
- One class column with two labels - A, B. Approximately 800 samples have no labels and use ?.
Note: Data has some QAQC issues including missing data and unsuitable detection limits (-999, characters).
- A presentation or document showing workflow used, QAQC, results and observations. To be presented and discussed at a later date.
Note: No interpretation or knowledge of the geochemical inputs is expected or required.
The required data can be found here
