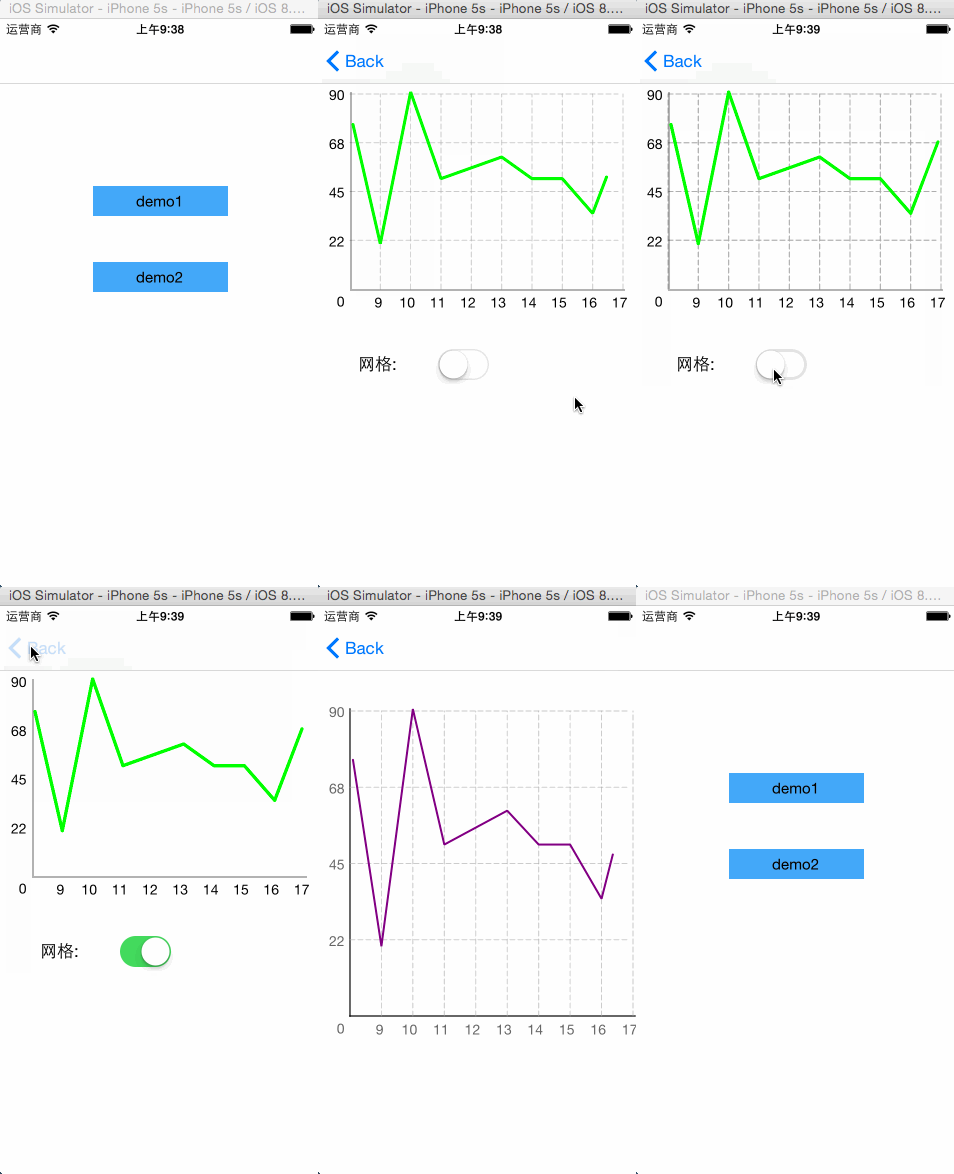
generate line chart or bar chart and so on with values
给定x,y轴的值,自动生成折线图;可定制性高;
###使用方法
CBChartView *chartView = [CBChartView charView];
[self.view addSubview:chartView];
chartView.xValues = @[@"0",@"9", @"10", @"11", @"12", @"13", @"14", @"15", @"16", @"17"];
chartView.yValues = @[@"75", @"20", @"90", @"50", @"55", @"60", @"50", @"50", @"34", @"67"];
###头文件的属性
/*
* x坐标的值和y坐标的值
* coordinate values, chart will draw itself on layer
* try to value string to xValues' element or yValues' element
*/
@property (strong, nonatomic) NSArray *xValues;
@property (strong, nonatomic) NSArray *yValues;

/** 是否需要虚线网格 */
@property (assign, nonatomic) BOOL isDrawDashLine;
/** 关闭坐标系动画 */
@property (assign, nonatomic) BOOL shutDefaultAnimation;
/** default is 4 (y轴方向的实数个数) */
@property (assign, nonatomic) int yValueCount;
/** 函数线条 或者 柱状图的粗细 */
@property (assign, nonatomic) CGFloat chartWidth;
/** 颜色 */
@property (strong, nonatomic) UIColor *chartColor;

/** 图表类型 暂时只支持折线 更多精彩 敬请期待 */
@property (assign, nonatomic) CBChartType chartType;
