Grafana OGC SensorThings Plugin
This plugin enables the visualization of sensor and location data from an OGC SensorThings server on Grafana.
It provides:
- Time-series visualization on Graph
- Time-series and location history in Table
- Sensor data in Singlestat
- Location of things on Worldmap Panel
- JSONPath support for extracting values from OM_Observation observations
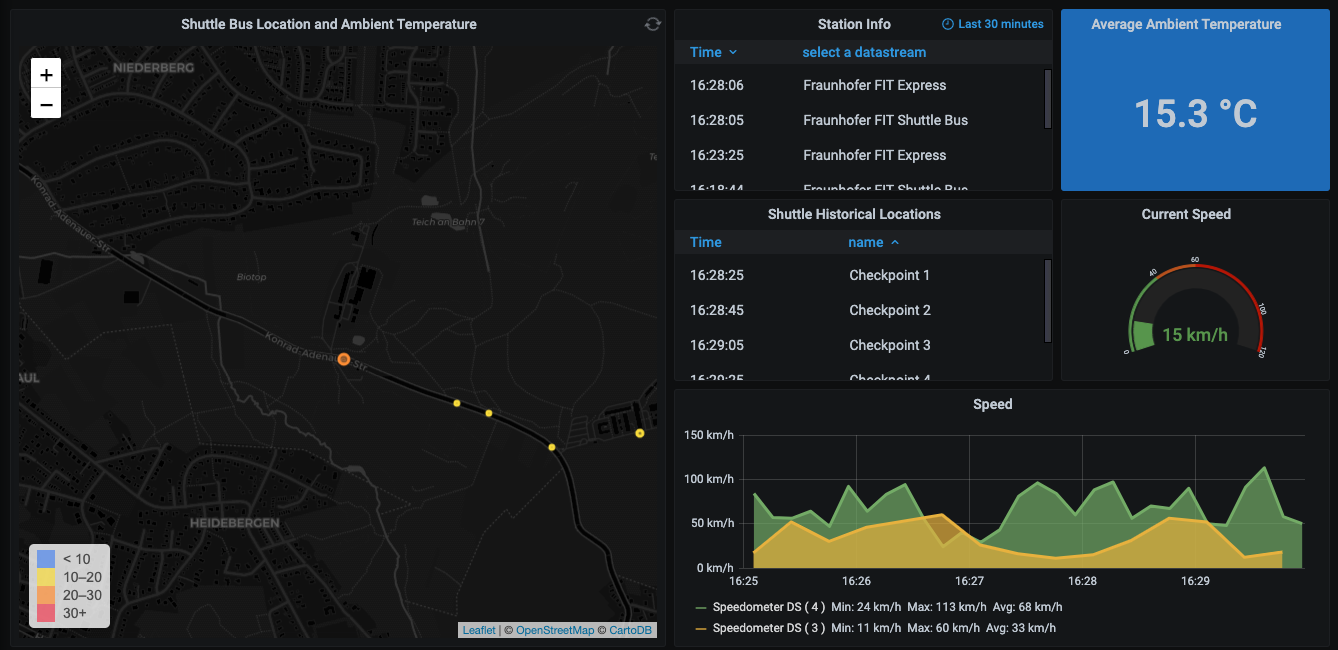
Demo
A live dashboard showing SensorThings data in Grafana panels: SensorThings Dashboard
Installation
Install via grafana-cli
sudo grafana-cli plugins install linksmart-sensorthings-datasource
Install from source
- Clone the repository into Grafana's plugin directory:
git clone https://github.com/linksmart/grafana-sensorthings-datasource.git linksmart-sensorthings-datasource
- Restart Grafana server to see the newly added datasource.
Setup
- Go to Grafana Configuration.
- Select
Add data source. - Provide the necessary details to connect with OGC SensorThings server.
| Name | Description |
|---|---|
| Name | The data source name. |
| Default | Set this as the default plugin for new panels. |
| Type | Choose SensorThings Datasource. |
| Url | OGC SensorThings API root URL (e.g. http://localhost:8080/v1.0). Note the URL has no trailing slash ("/"). |
| Access | Proxy: Let Grafana server proxy the requests to OGC SensorThings API server. |
| Basic Auth | Authenticate to OGC SensorThings API server (if required, provide User and Password) |

- Save & Test, you should see this confirmation:

Query Configuration
Graph view
To visualize the observations from OGC SensorThings server,
- Add a graph panel.
- Select the SensorThings Datasource.
- Select
SensororThingsto get the list of sensors or things which are available in your SensorThings server. - Select a specific sensor or thing from the list, to get the list of datastreams.
- Select a datastream to visualize the observations in the graph.
See the demo below for better understanding:

Table view
Using table view, one can see list of observation recorded based on Sensors/Things, and also list of Locations visited by a Thing or list of Things that has been in a specific Location.
- Add a table panel.
- Select the SensorThings Datasource.
- Select
Sensors,Things,Locations, orHistorical Locationsfrom the initial dropdown list.
See the demo below for better understanding:

Map view
Using the Grafana Map Panel view, one can see the current Location of a Thing on the map.
-
Download the Grafana map panel from here (https://github.com/panodata/grafana-map-panel) and copy it to your grafana/plugins directory
-
Add the map panel in dashboard
-
In "Panel" tab in the "Worldmap" section:
-
Under
Location source- Set
Data format and mapping->JSON from data source - Set
Aggregation->current
- Set
-
Under
Visual options-
Select
Center->Last GeoHash -
Set
Zoom levelto 12
-
Under
Circle parameterssetMinimum sizeandMaximum sizeto 5
-
-
-
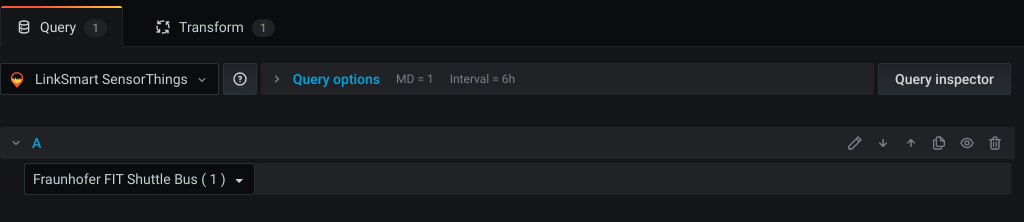
In "Query" tab:
- Select the LinkSmart SensorThings Datasource.
- Select a "Thing" from dropdown list.
Dev setup
npm install
npm run watch