A tiny CPU profiler for Java written completely in Java 11.
This is an educational sampling profiler from Johannes Bechberger that helps demystify profilers, but is not limited to it.
The changes I have made here are exclusively to the operability of the profiler with Java 11.
This profiler is a sampling profiler with can output method tables and
flame graphs (via d3-flame-graph).
The sampling is based on the Thread.getAllStackTraces() method, making it simple but also safepoint-biased.
The profiler should work on any platform with a JDK 11 or newer. The usage is fairly simple:
# build it
mvn package

# run your program and print the table of methods sorted by their sample count
# and the flame graph, taking a sample every 10ms
java -javaagent:target/tiny-profiler.jar=flamegraph=flame.html ...
Example:
Profiling the included fibonacci benchmark:
> java -javaagent:target/tiny-profiler.jar=flamegraph=flames.html Fib.java 40
===== method table ======
Total samples: 54
Method                                                          Samples Percentage     On top Percentage
com.sun.tools.javac.launcher.Main.run                                53      98,15          0       0,00
com.sun.tools.javac.launcher.Main.main                               53      98,15          0       0,00
com.sun.tools.javac.launcher.Main.compile                            28      51,85          0       0,00
java.lang.reflect.Method.invoke                                      25      46,30          0       0,00
Profiling the Renaissance benchmark suite:
# download a benchmark
> test -e renaissance.jar || wget https://github.com/renaissance-benchmarks/renaissance/releases/download/v0.14.2/renaissance-gpl-0.14.2.jar -O renaissance.jar

> java -javaagent:./target/tiny-profiler.jar=flamegraph=flames.html -jar renaissance.jar dotty
...
===== method table ======
Total samples: 11217
Method                                                          Samples Percentage     On top Percentage
dotty.tools.dotc.typer.Typer.typed                                59499     530.44          2       0.02
dotty.tools.dotc.typer.Typer.typedUnadapted                       31050     276.81          7       0.06
scala.runtime.function.JProcedure1.apply                          24283     216.48         13       0.12
dotty.tools.dotc.Driver.process                                   19012     169.49          0       0.00
dotty.tools.dotc.typer.Typer.typedUnnamed$1                       18774     167.37          7       0.06
dotty.tools.dotc.typer.Typer.typedExpr                            18072     161.11          0       0.00
scala.collection.immutable.List.foreach                           16271     145.06          3       0.03
...
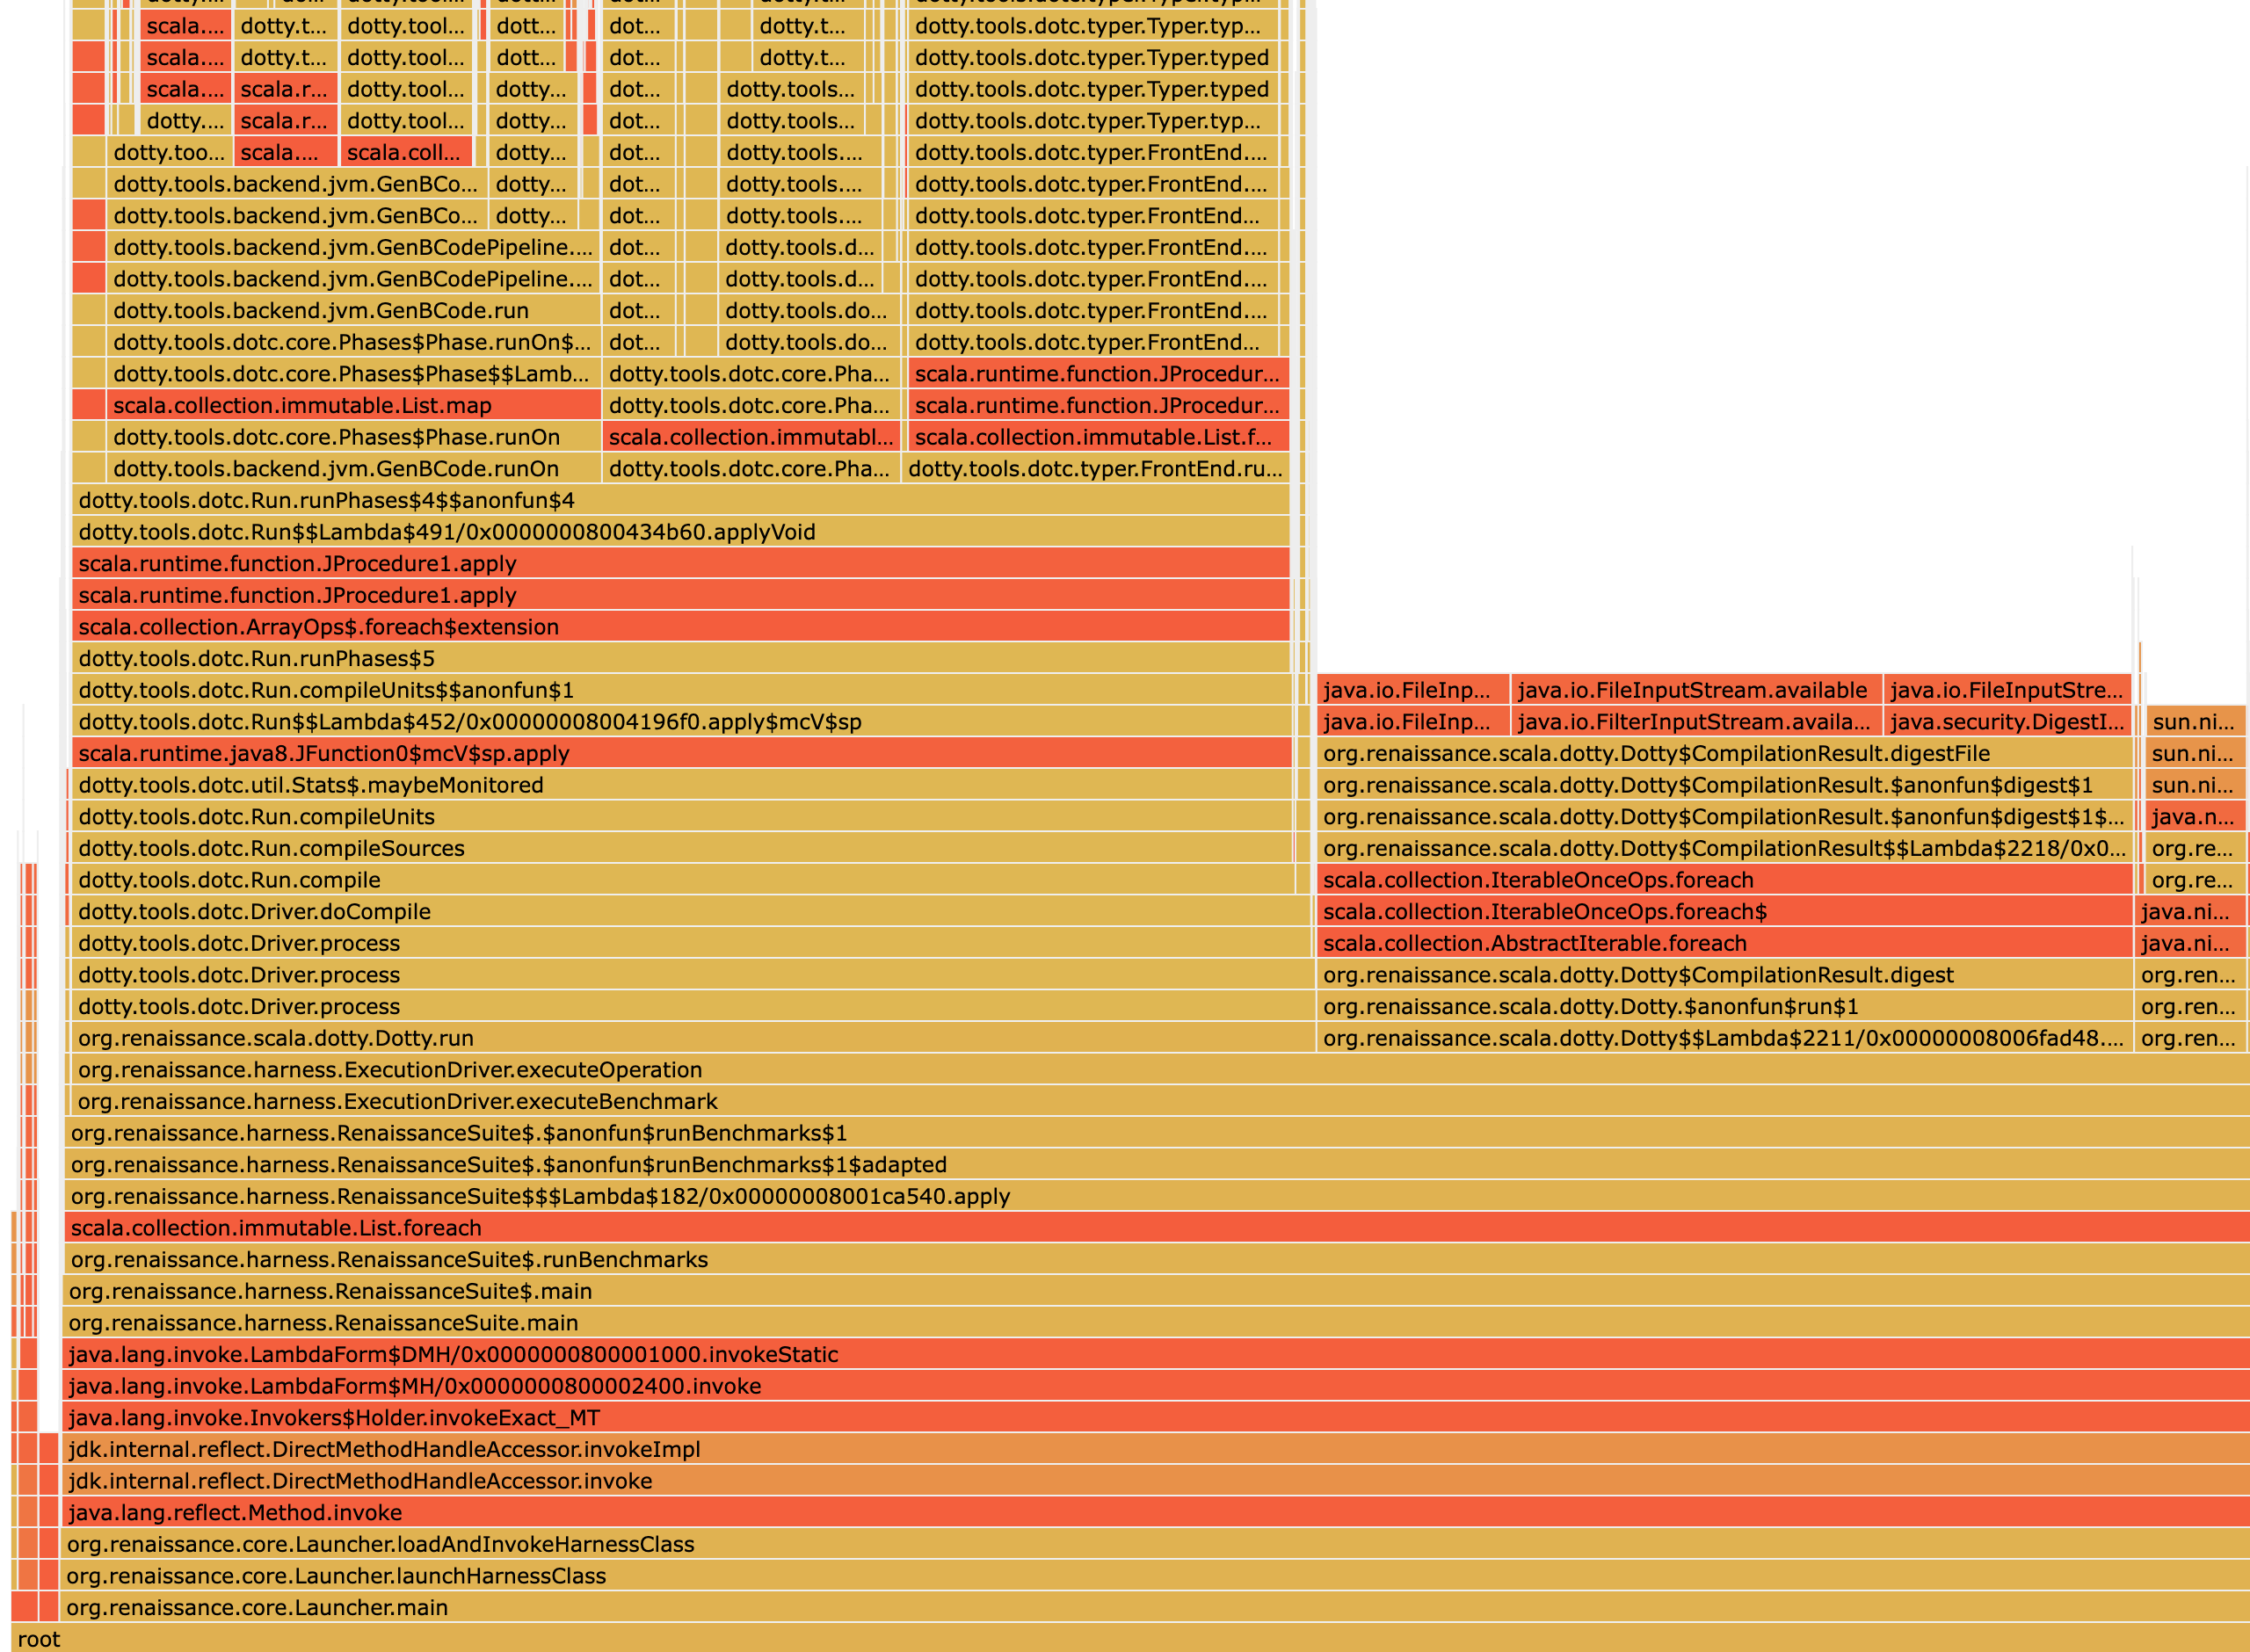
This results in the following flamegraph:
The overhead for this example is around 2% on my MacBook Pro 13" for a 10ms interval, which makes the profiler usable when you ignore the safepoint-bias.
- Main class: Entry point of the Java agent
- Options: Parses and stores the agent options
- Profiler: Contains the profiling loop
- Store: Stores and outputs the collected results
- MethodTableEntry: Replacement of record for Java 11
MIT, Copyright 2023 SAP SE or an SAP affiliate company, Johannes Bechberger and tiny profiler contributors
This project is a prototype of the SapMachine team at SAP SE
