
Grafana dashboards for AWS CloudWatch
Set of AWS Grafana dashboards published on grafana.com - 20k+ downloads.
Doc:
Feel free to create pull request for additional AWS resources/printscreens/...
Please set your dashboard variables (Region, ...) after dashboard import.
Empty dashboard variables are reason of initial "Unable to call AWS API" or "Metric request error" error.
Import all Monitoring Artist AWS dashboards in one go (example script,
bash/curl/jq required):
#!/bin/bash
### Please edit grafana_* variables to match your Grafana setup:
grafana_host="http://localhost:3000"
grafana_cred="admin:admin"
grafana_datasource="cloudwatch"
ds=(1516 677 139 674 590 659 758 623 617 551 653 969 650 644 607 593 707 575 1519 581 584 2969 8050);
for d in "${ds[@]}"; do
  echo -n "Processing $d: "
  j=$(curl -s -k -u "$grafana_cred" $grafana_host/api/gnet/dashboards/$d | jq .json)
  curl -s -k -u "$grafana_cred" -XPOST -H "Accept: application/json" \
    -H "Content-Type: application/json" \
    -d "{\"dashboard\":$j,\"overwrite\":true, \
        \"inputs\":[{\"name\":\"DS_CLOUDWATCH\",\"type\":\"datasource\", \
        \"pluginId\":\"cloudwatch\",\"value\":\"$grafana_datasource\"}]}" \
    $grafana_host/api/dashboards/import; echo ""
done
Use AWS Policy Generator, which fits your needs. Example of minimal IAM role for Grafana (CloudWatch + EC2 metrics):
{
    "Version": "2012-10-17",
    "Statement": [
        {
            "Sid": "AllowReadingMetricsFromCloudWatch",
            "Effect": "Allow",
            "Action": [
                "cloudwatch:ListMetrics",
                "cloudwatch:GetMetricStatistics"
            ],
            "Resource": "*"
        },
        {
            "Sid": "AllowReadingTagsFromEC2",
            "Effect": "Allow",
            "Action": [
                "ec2:DescribeTags",
                "ec2:DescribeInstances"
            ],
            "Resource": "*"
        }
    ]
}
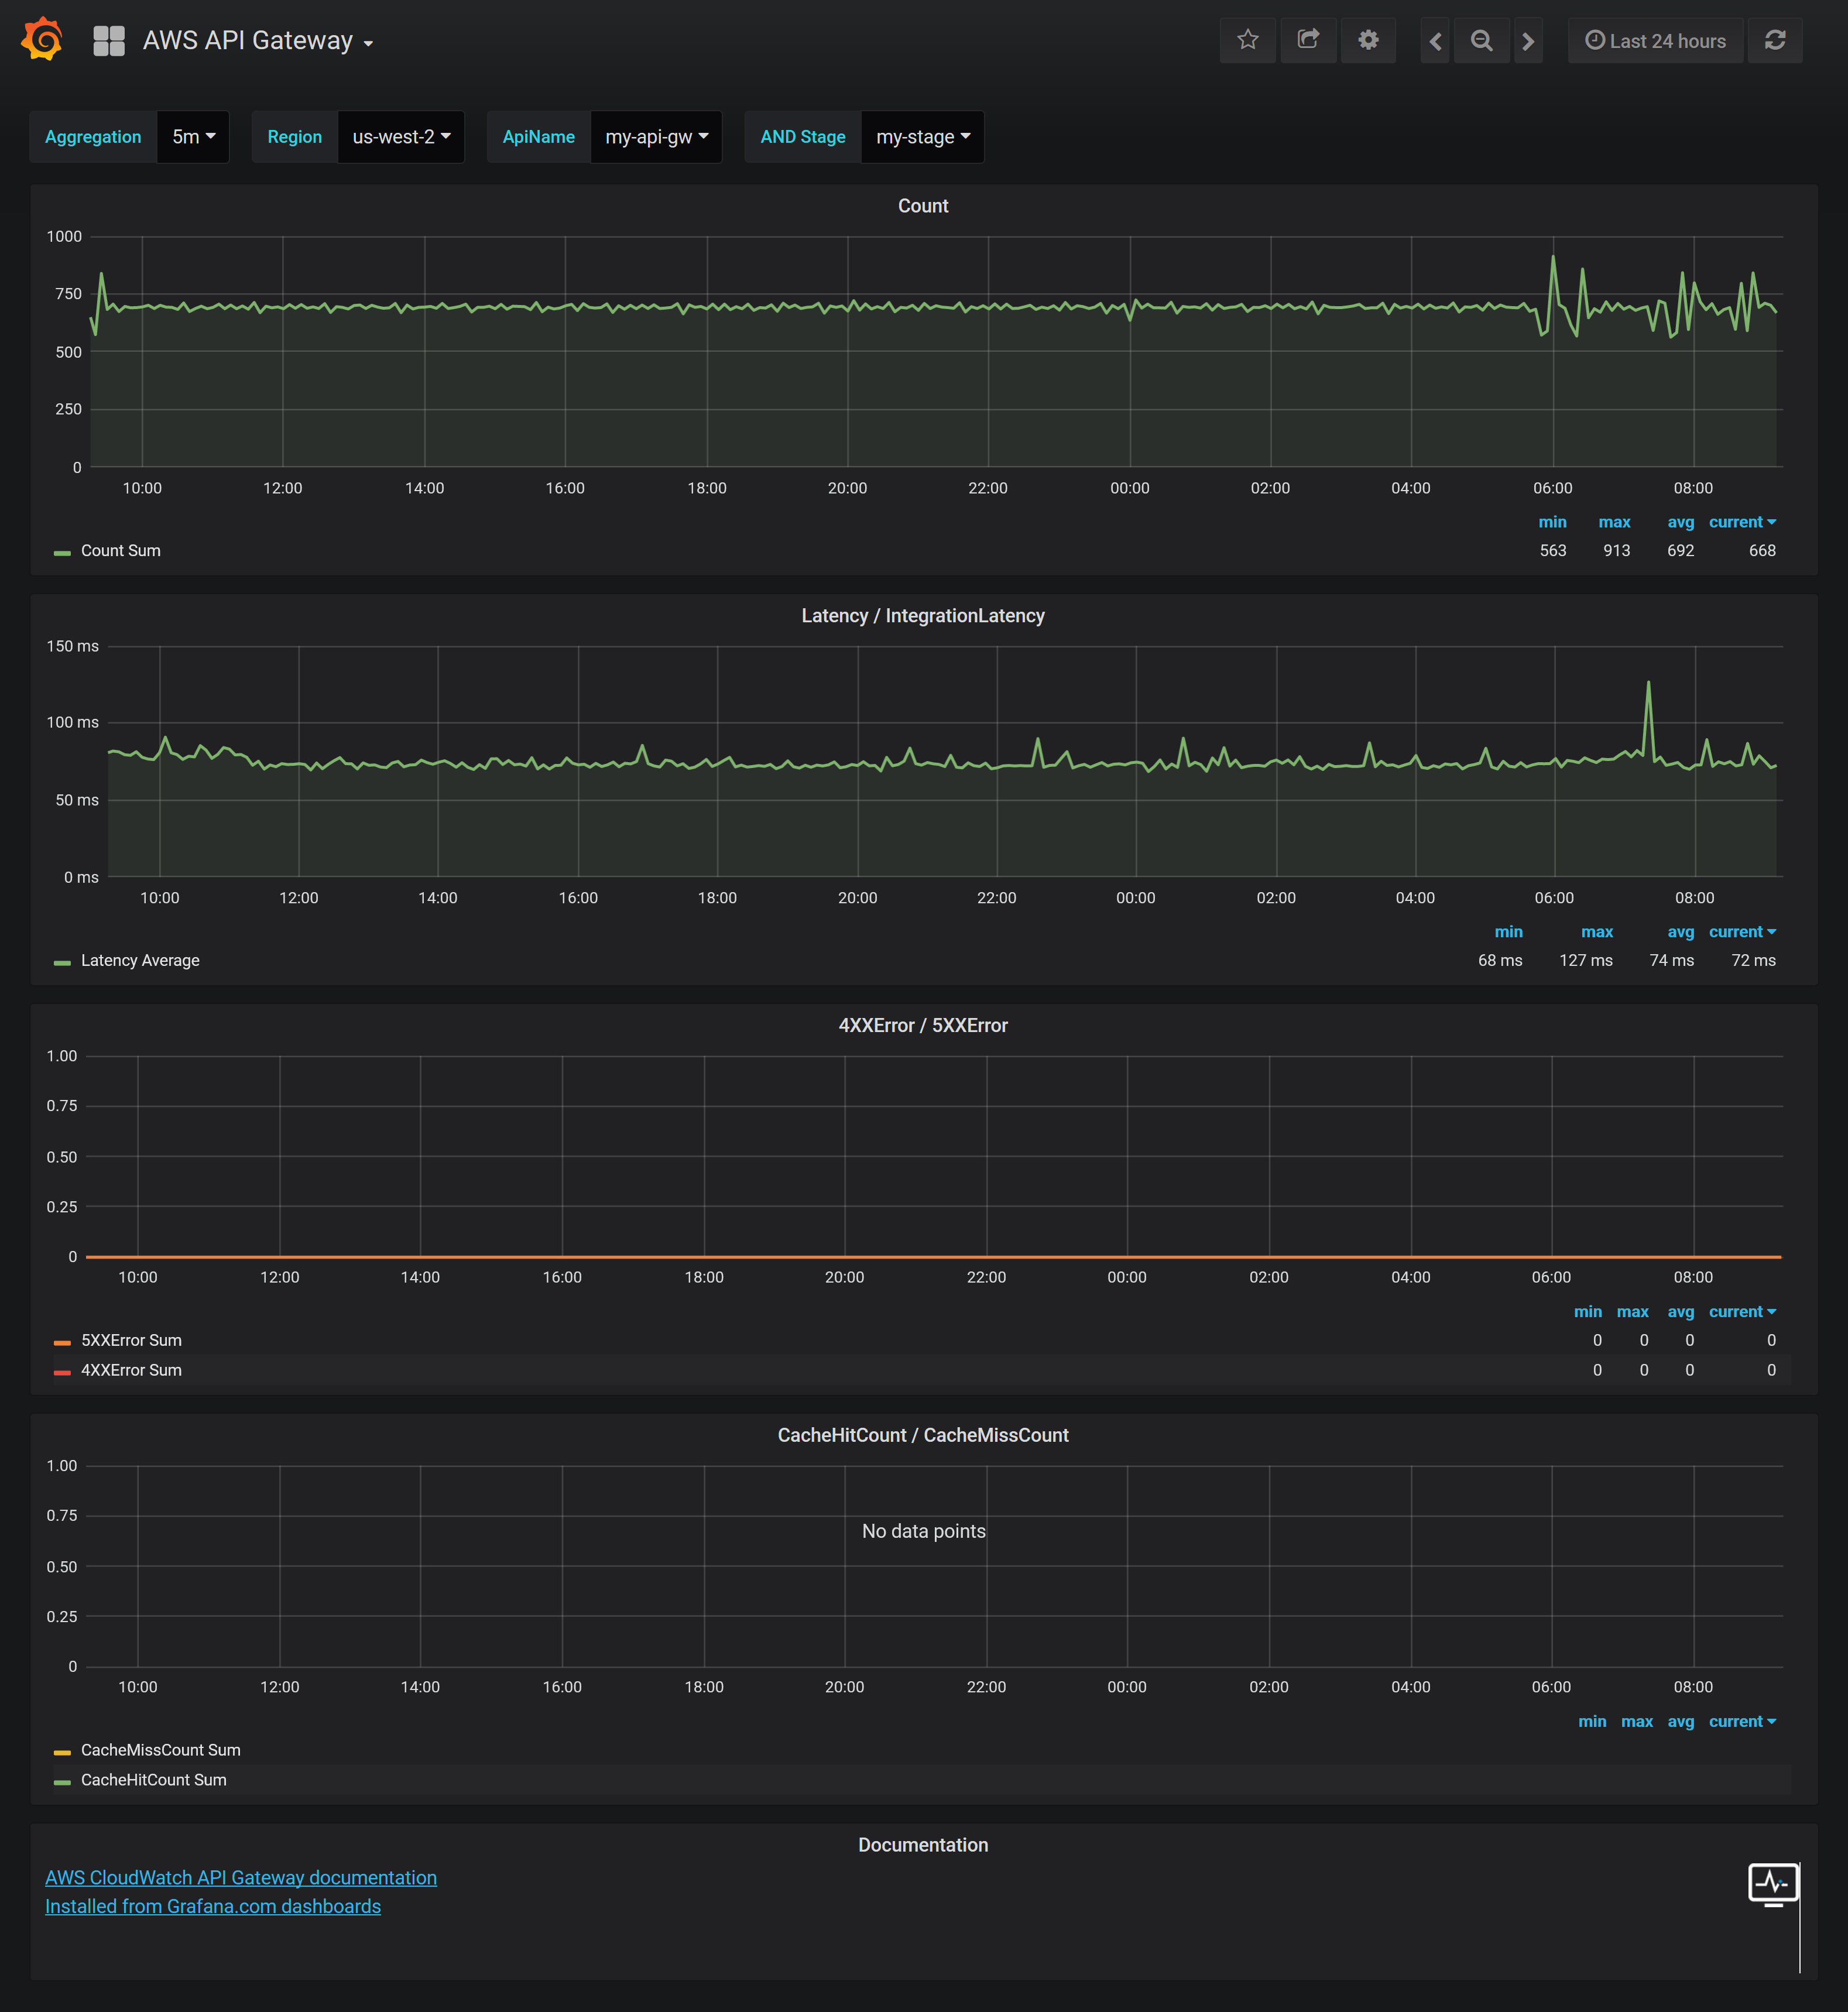
AWS API Gateway
AWS Auto Scaling
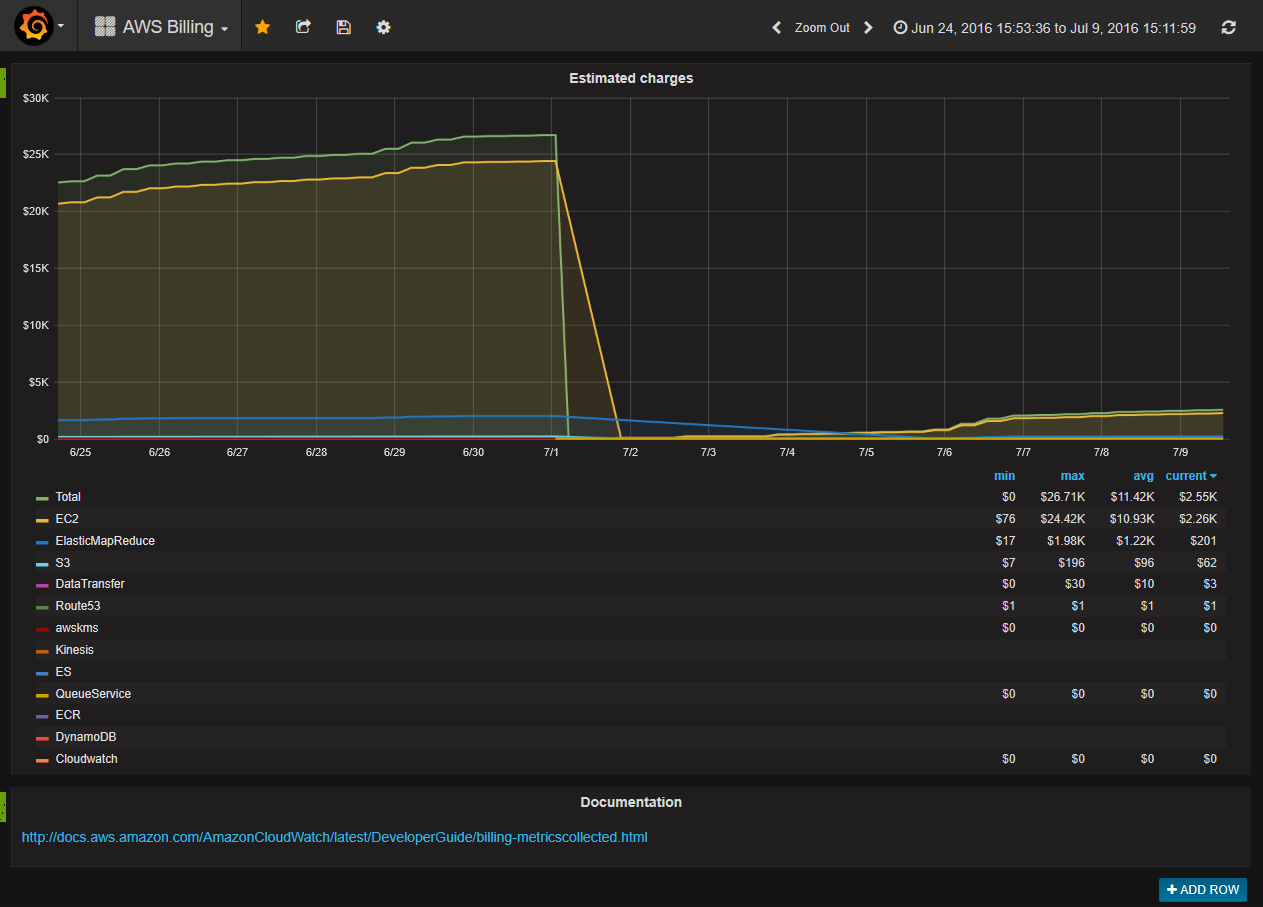
AWS Billing
AWS CloudFront
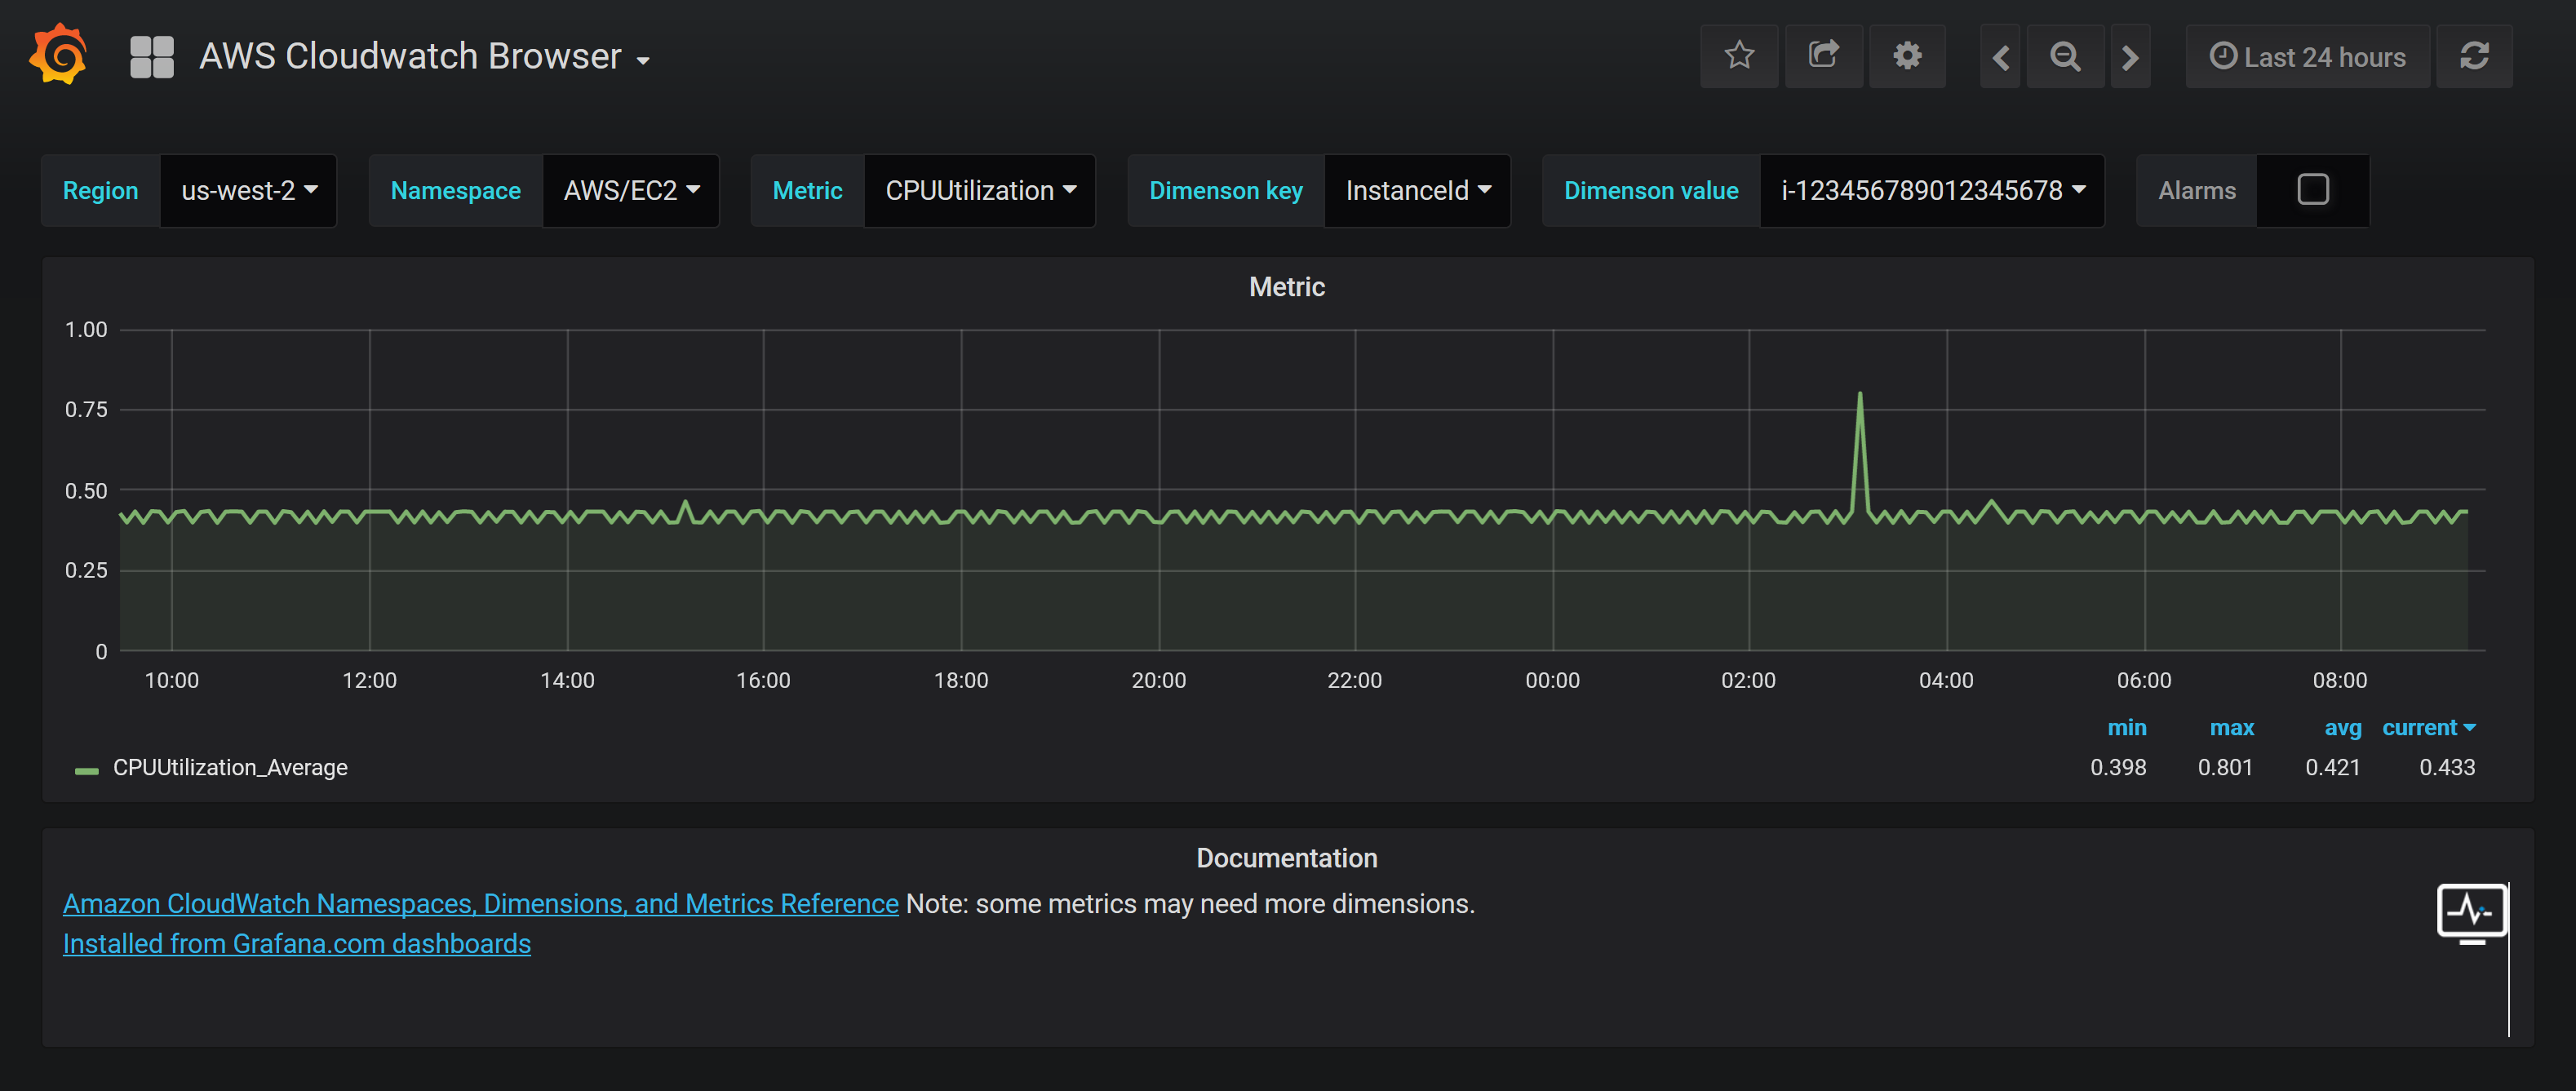
AWS CloudWatch Browser
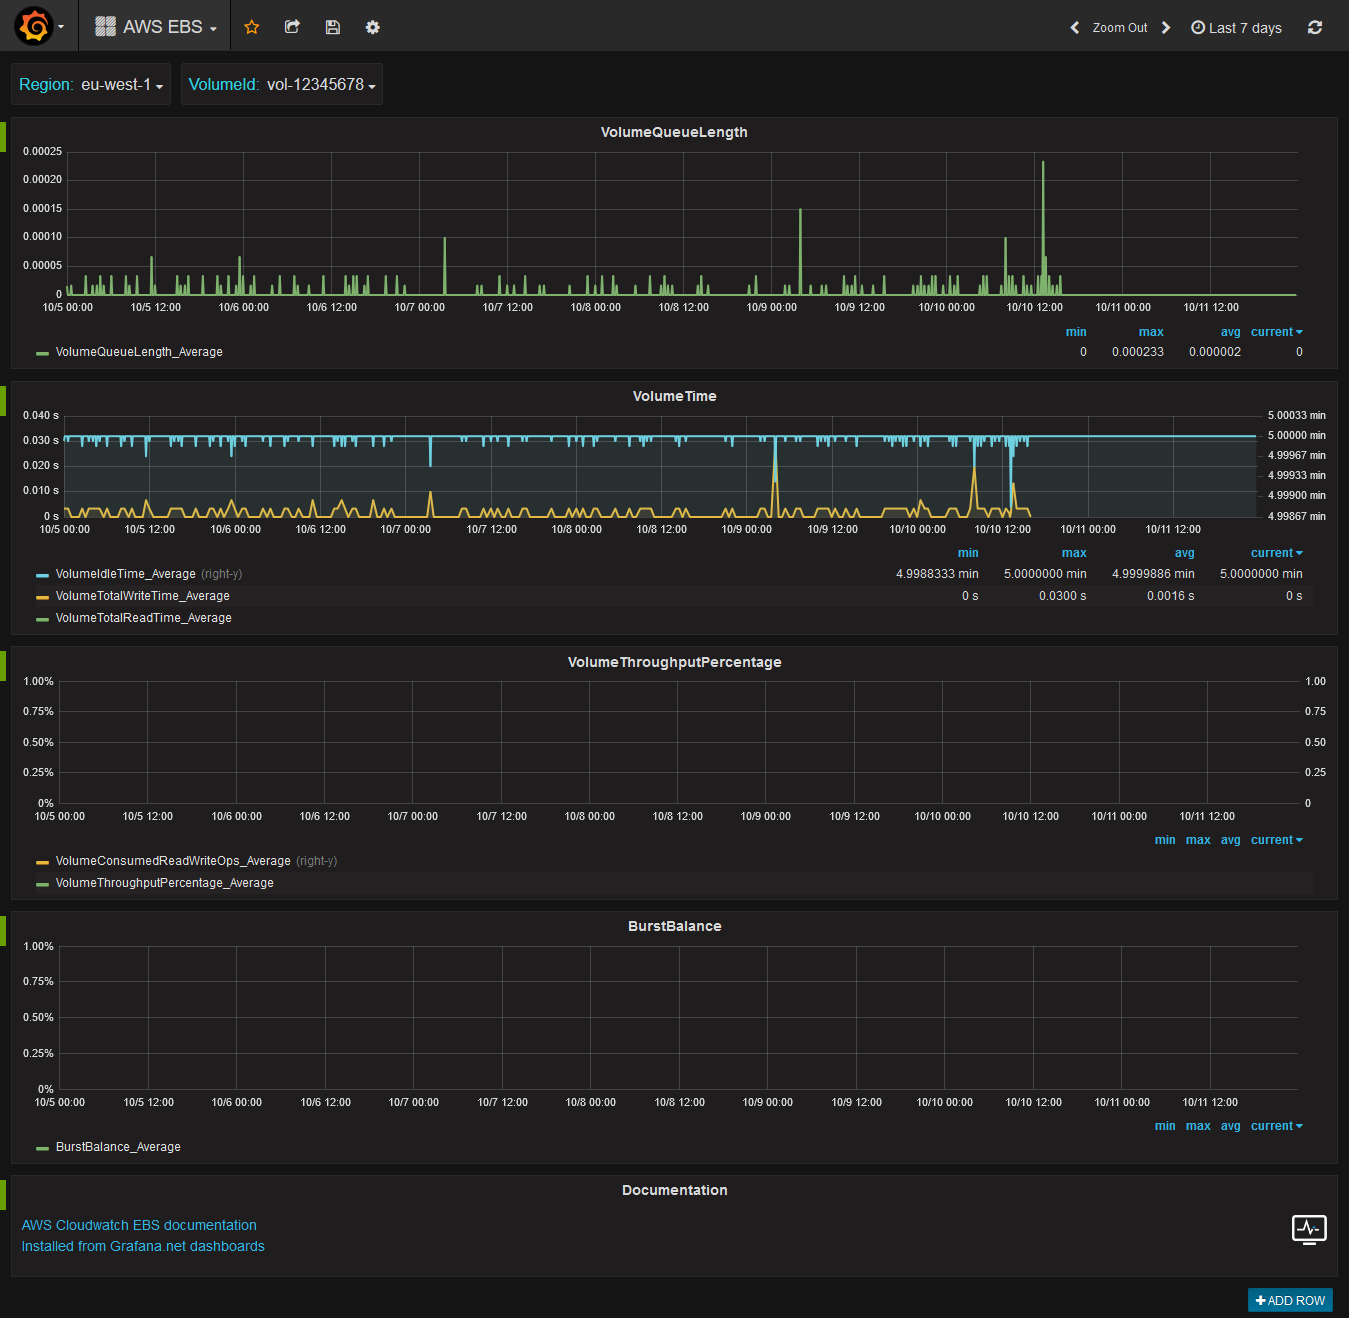
AWS EBS
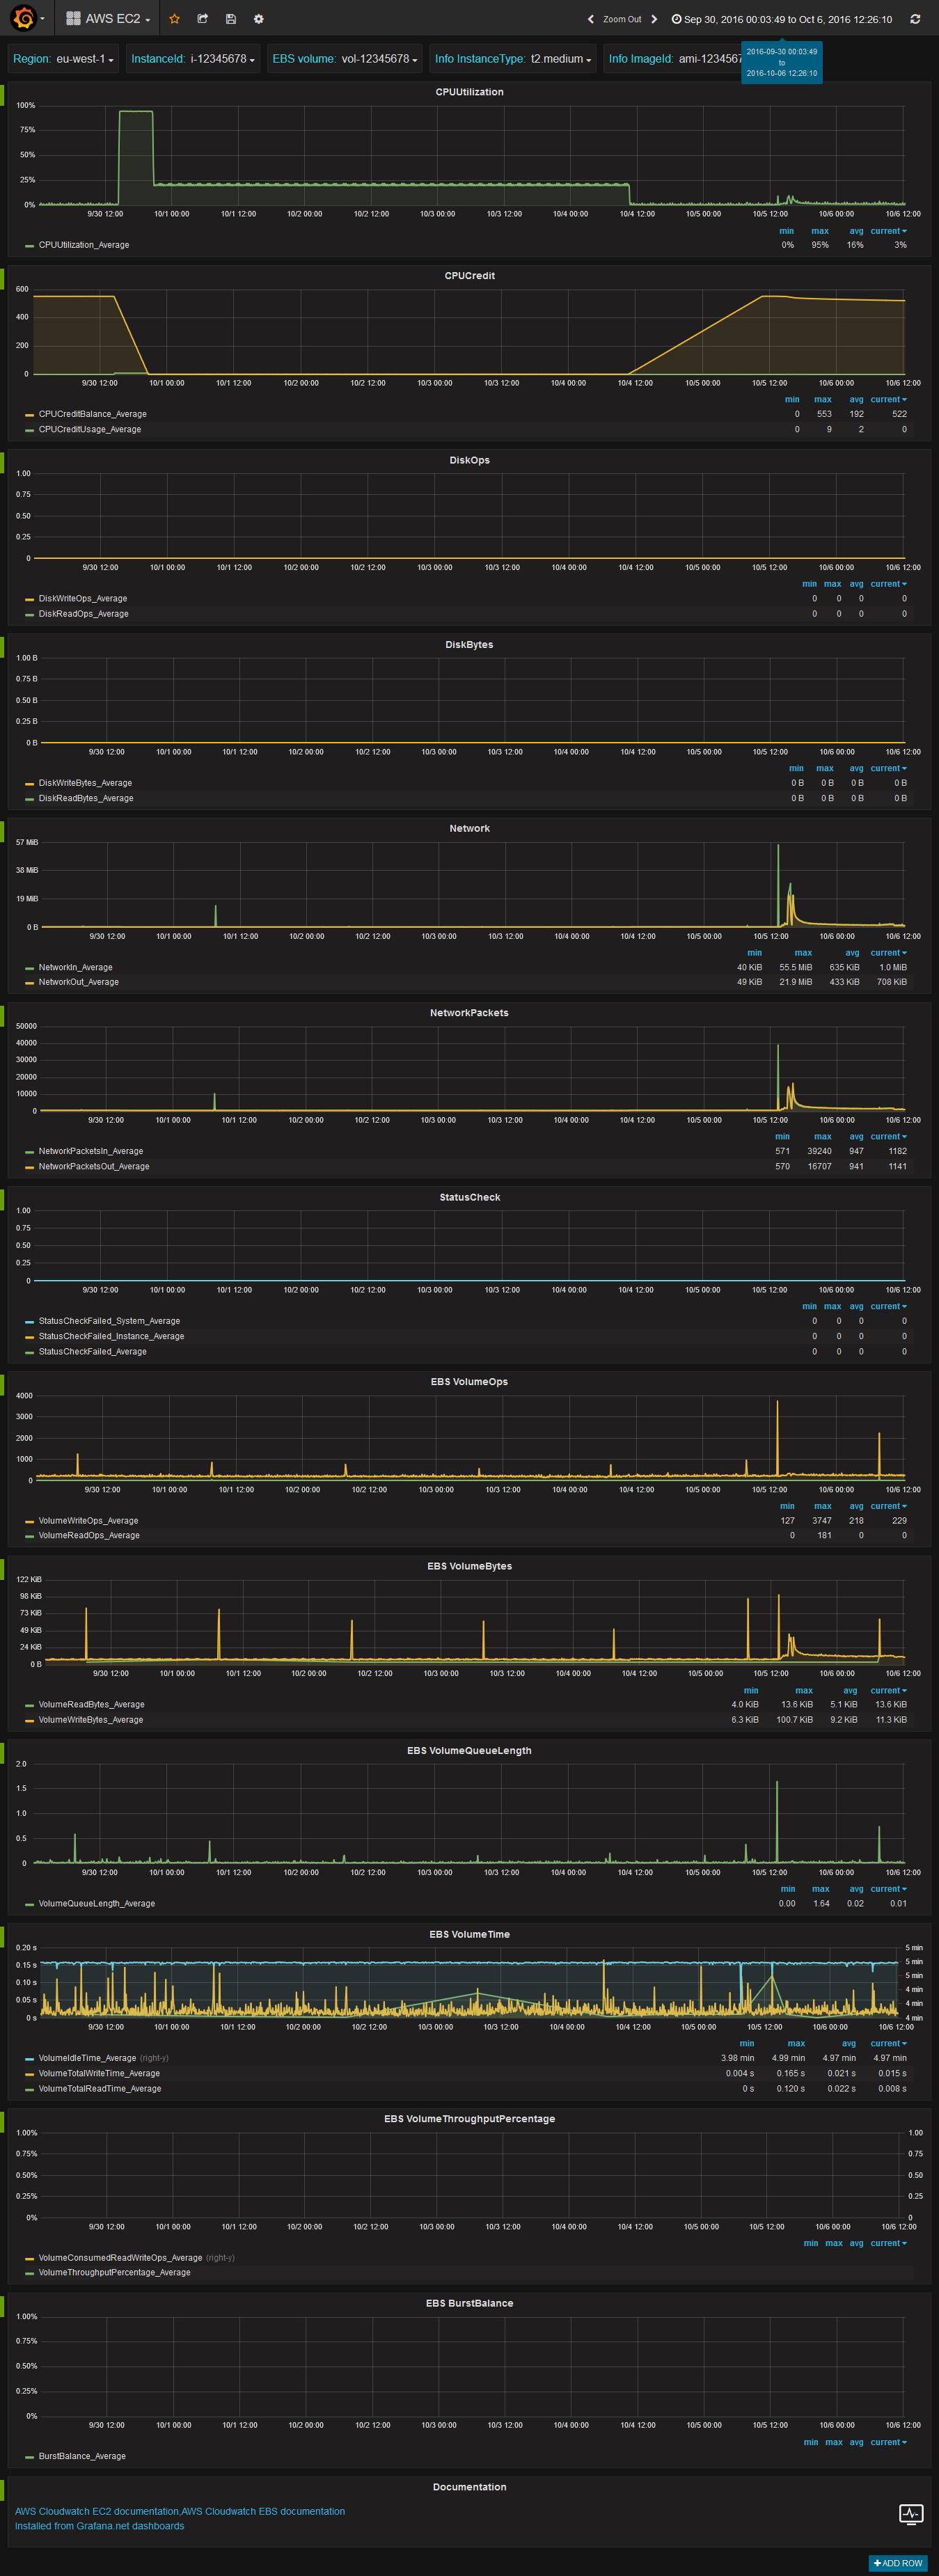
AWS EC2
AWS ECS
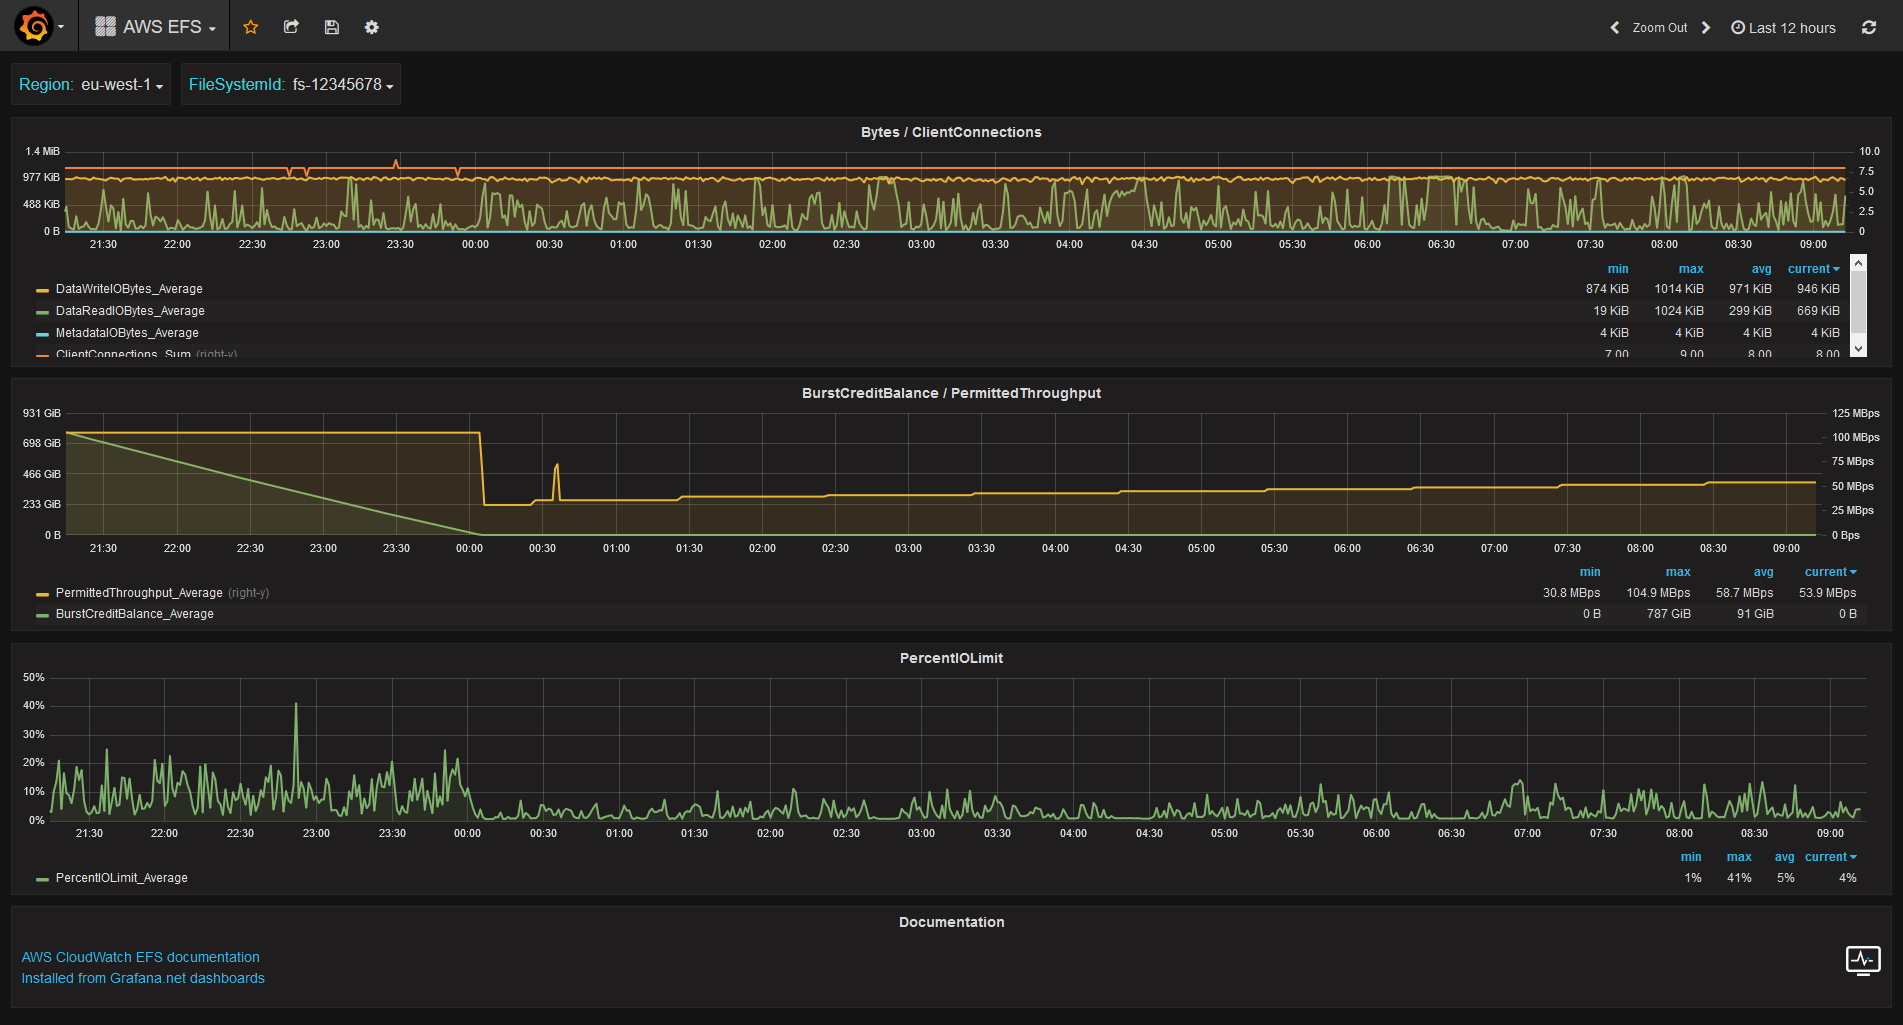
AWS EFS
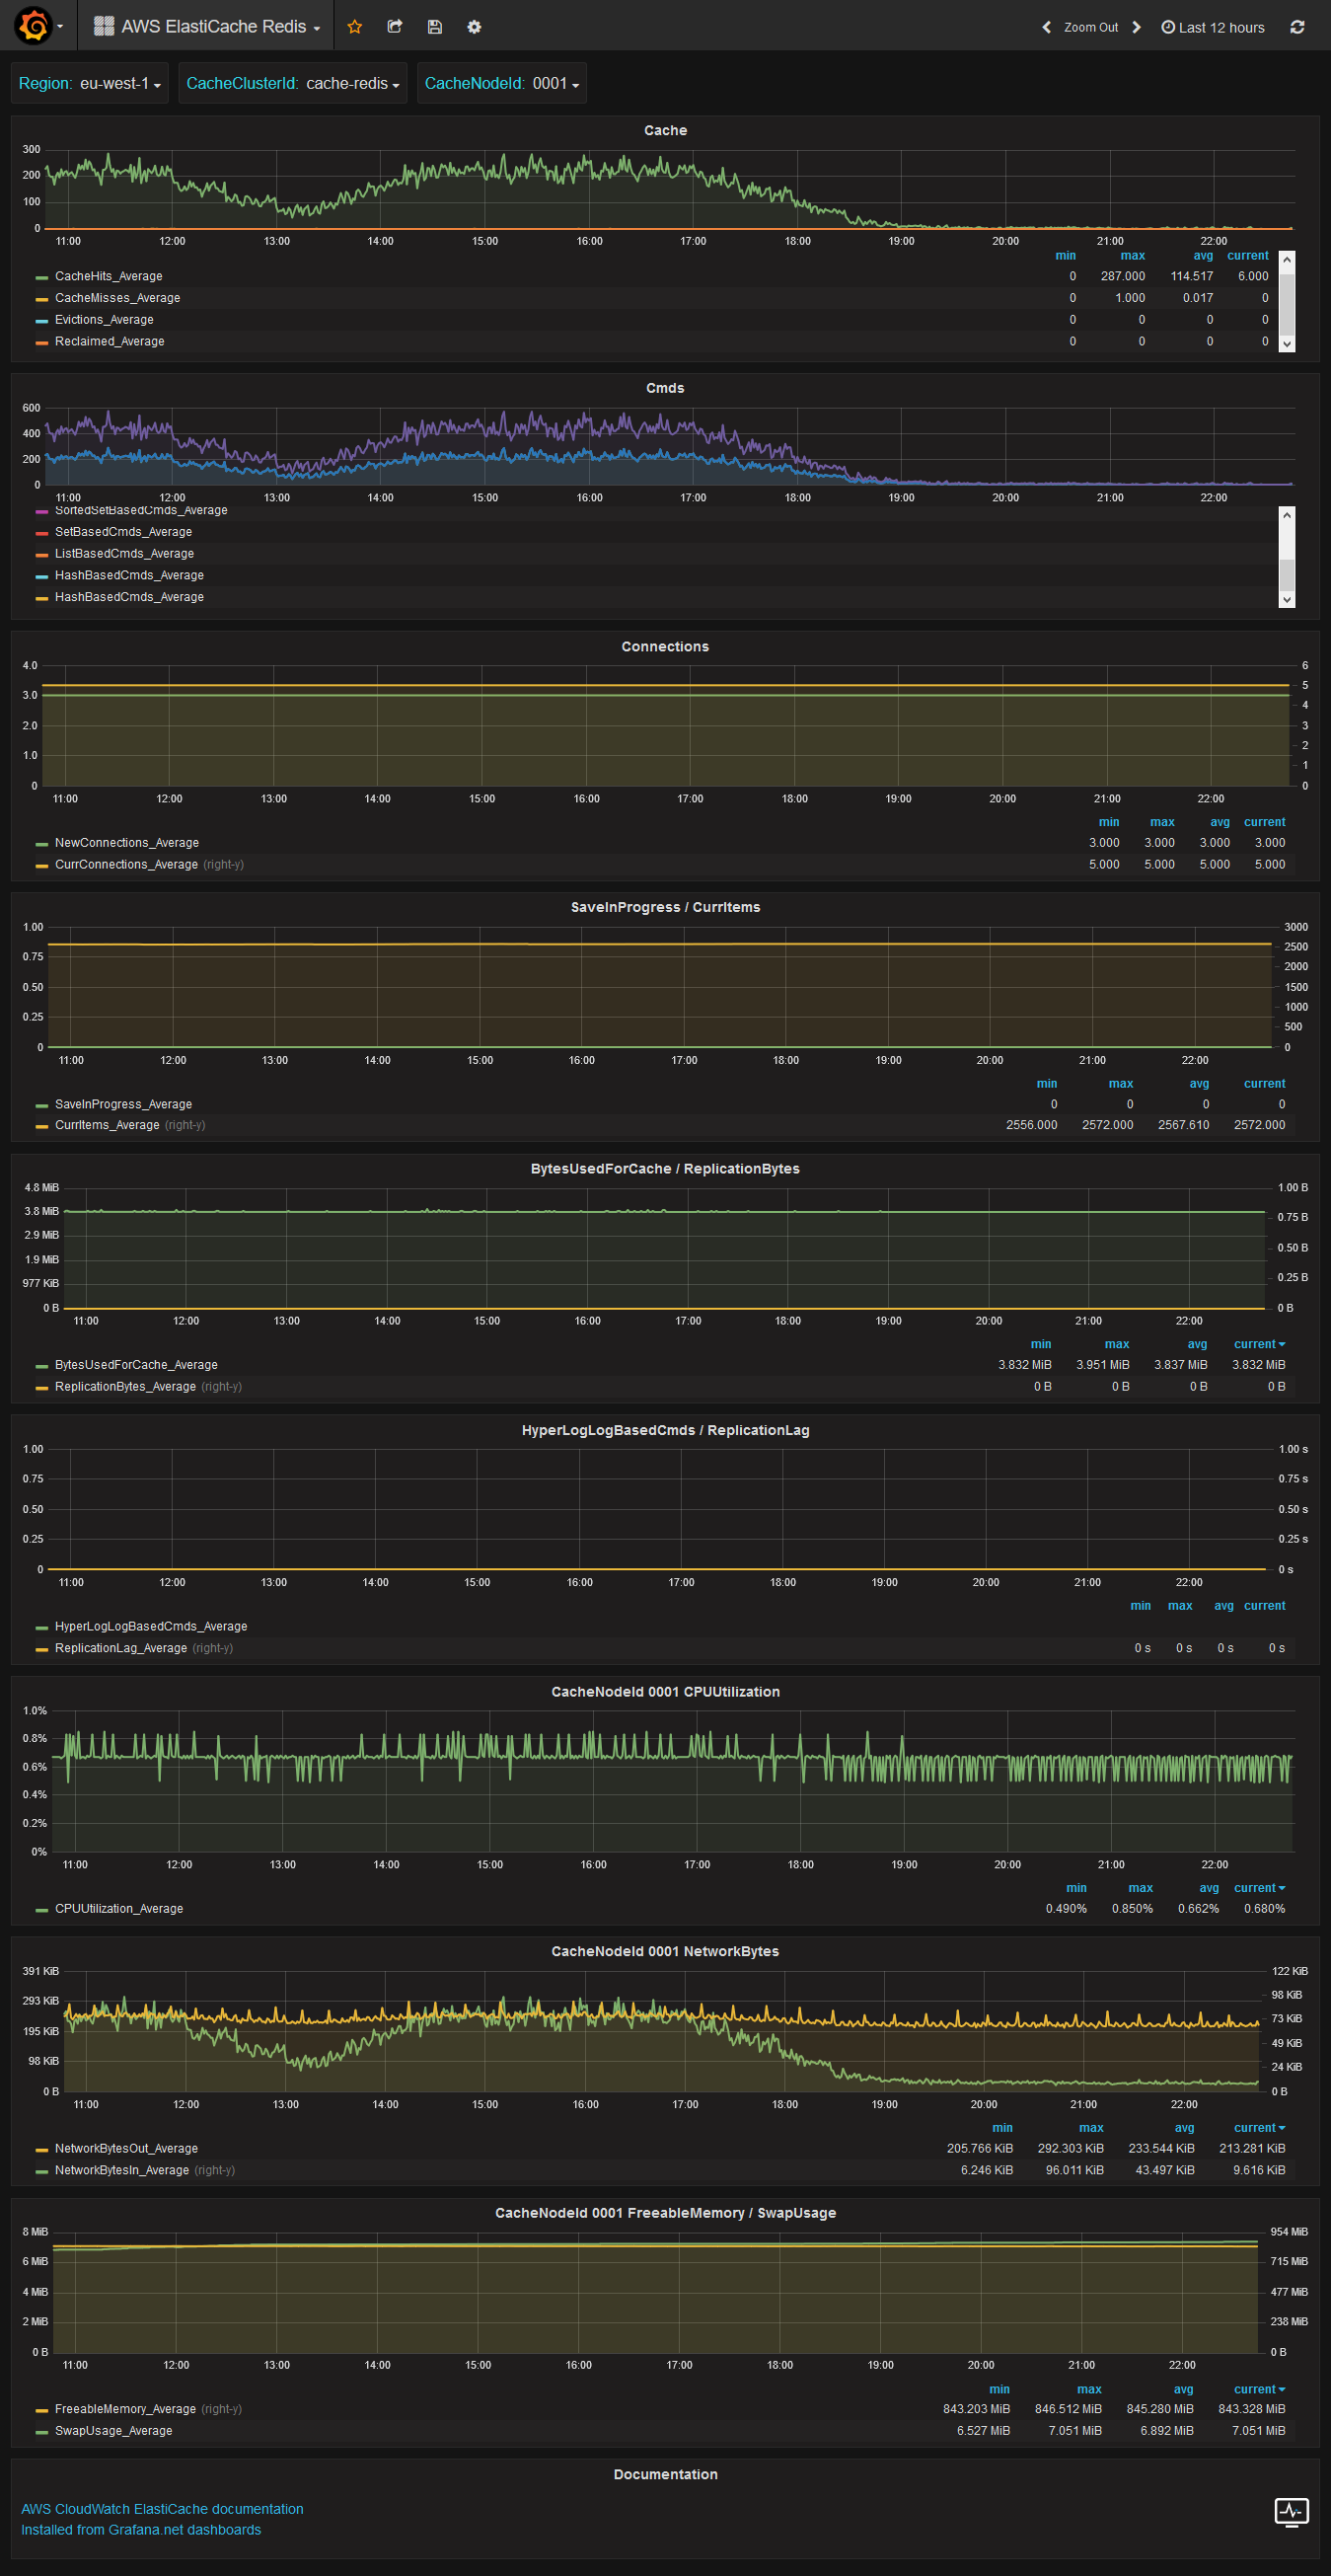
AWS ElastiCache Redis
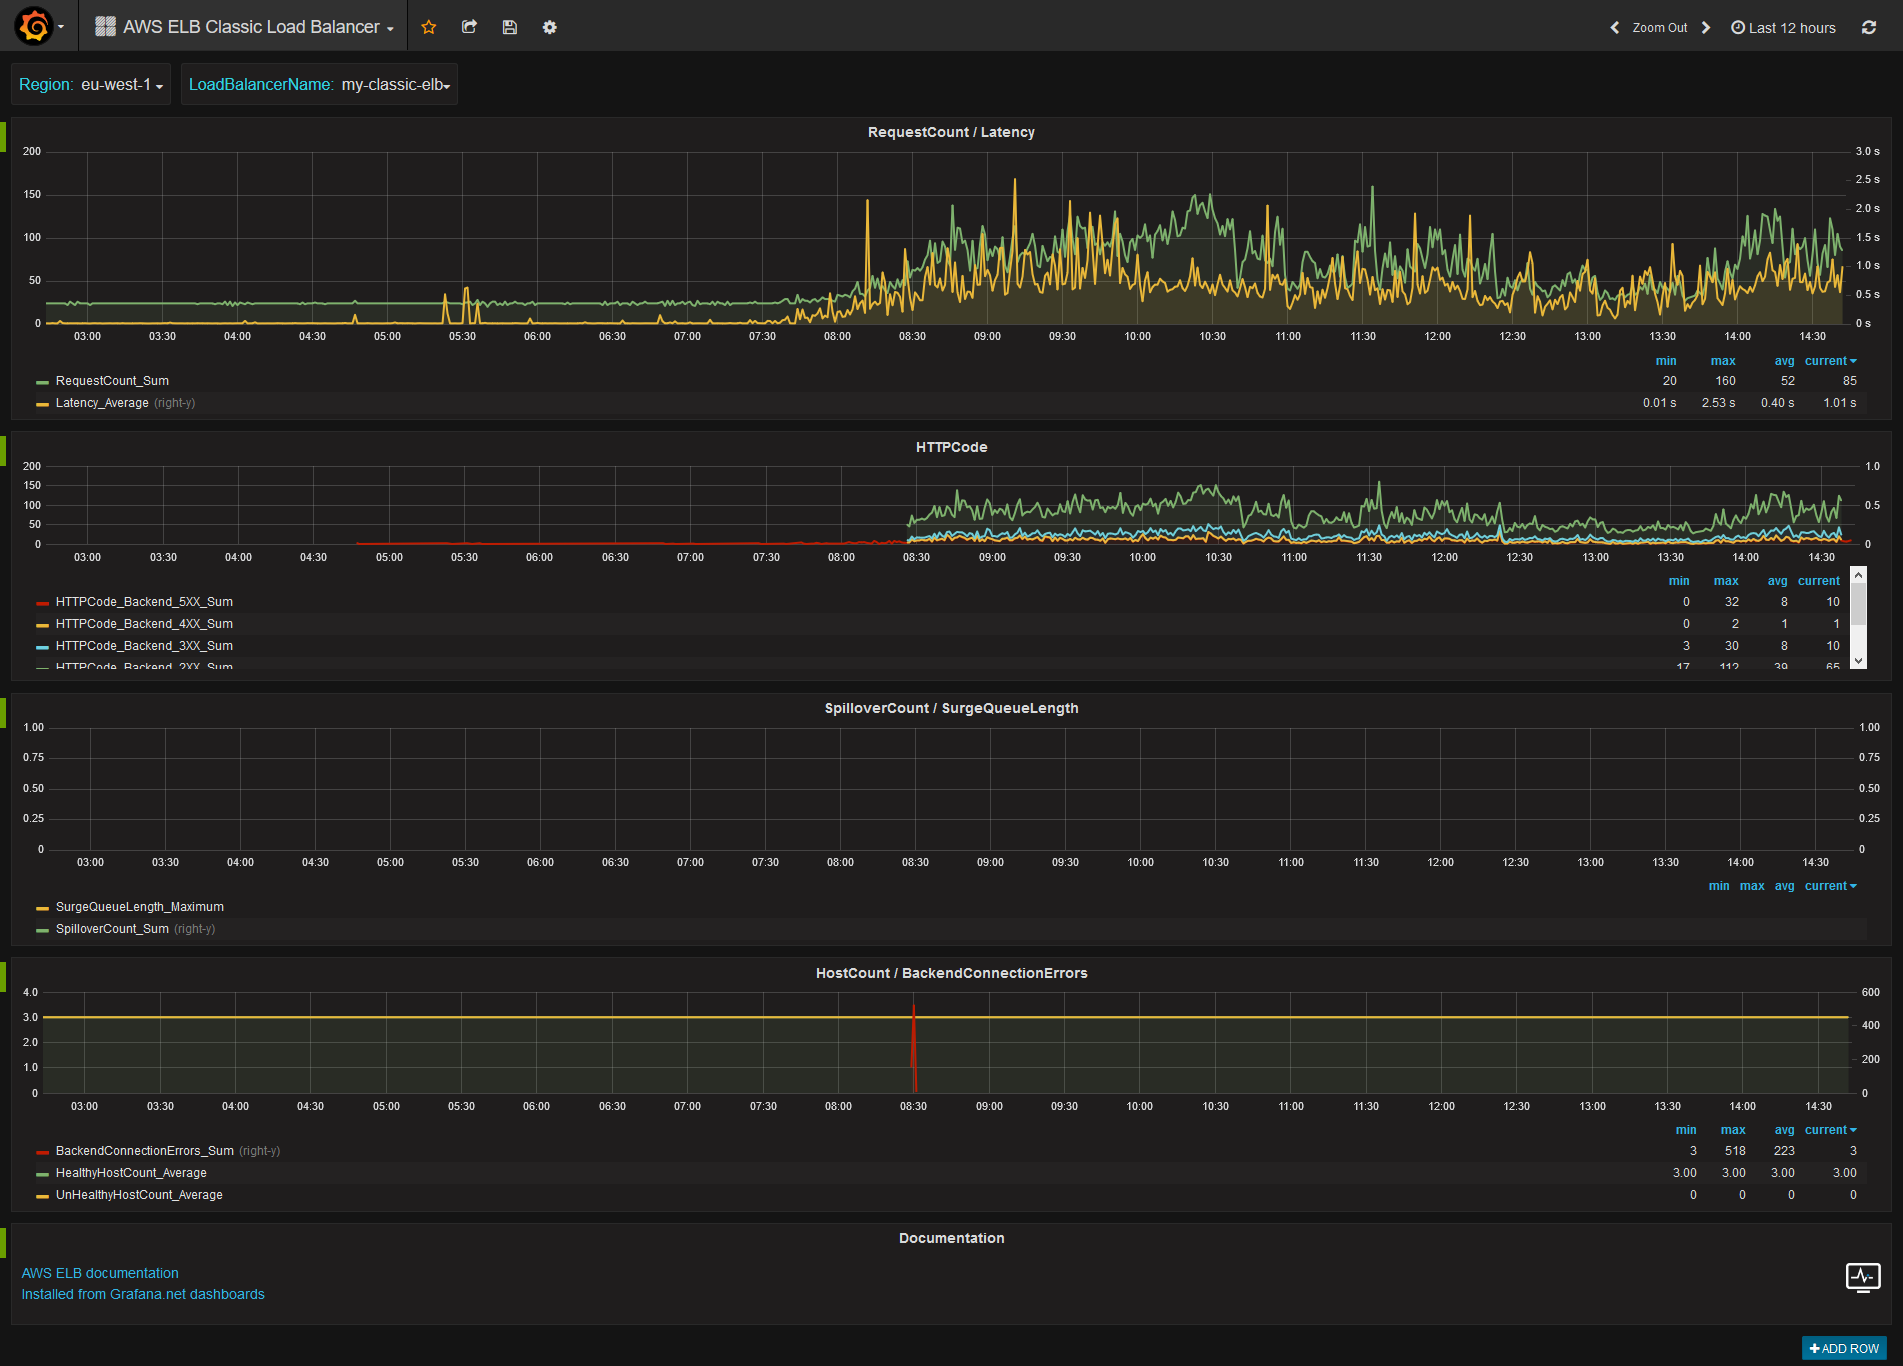
AWS ELB Classic Load Balancer
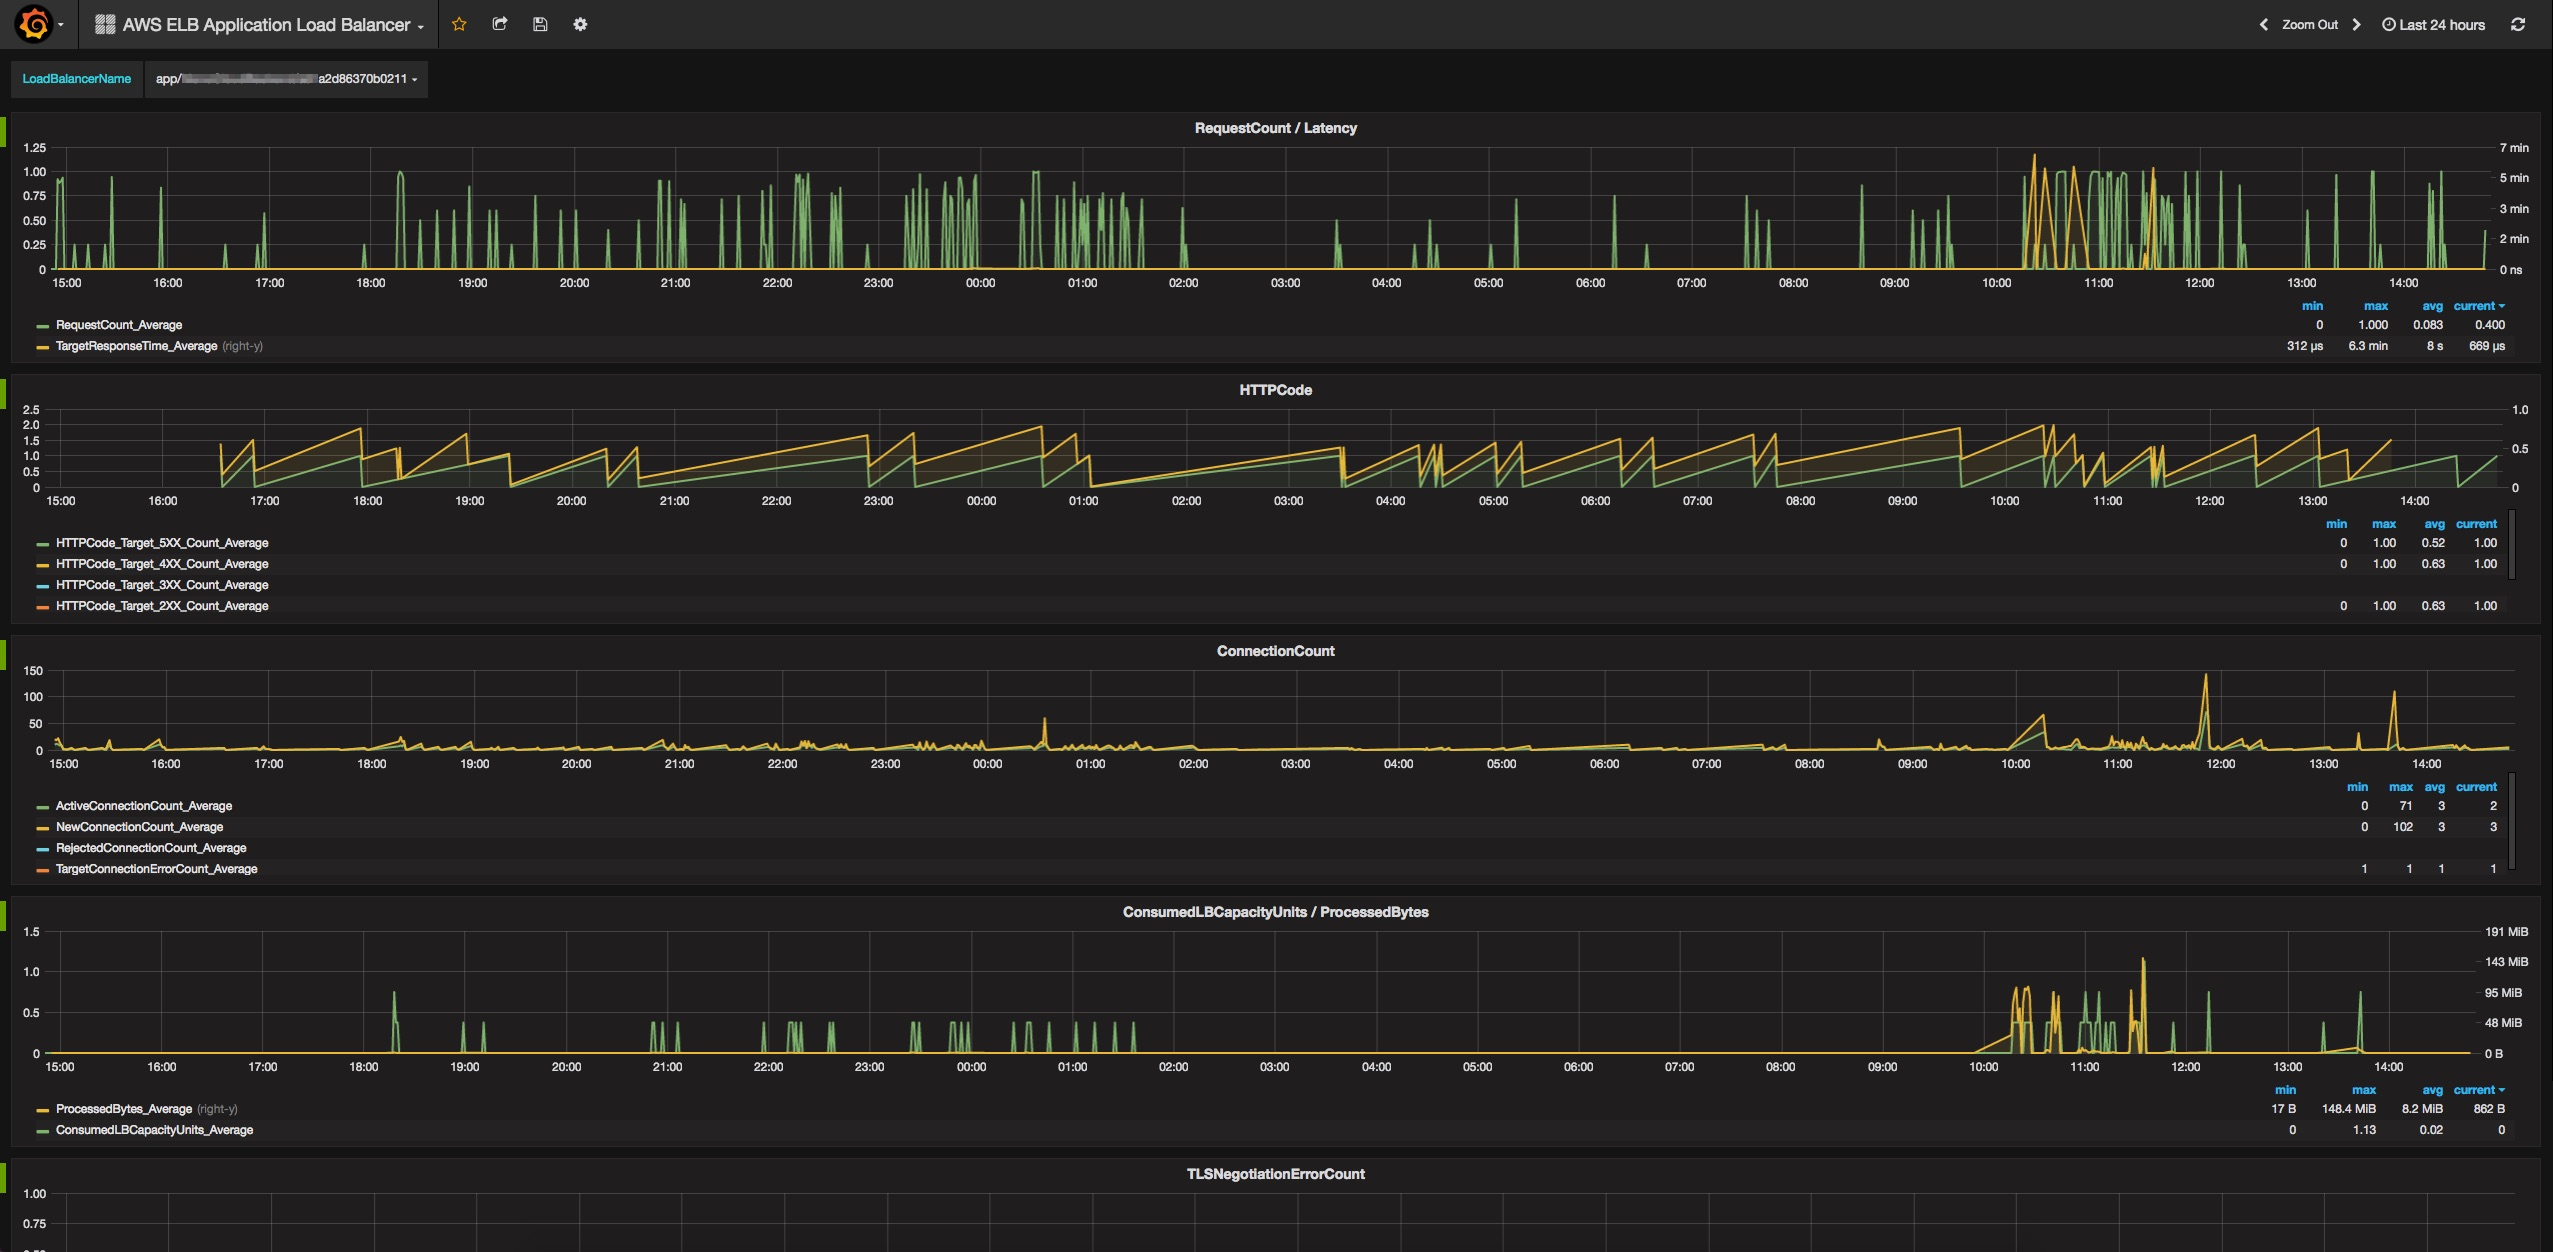
AWS ELB Application Load Balancer
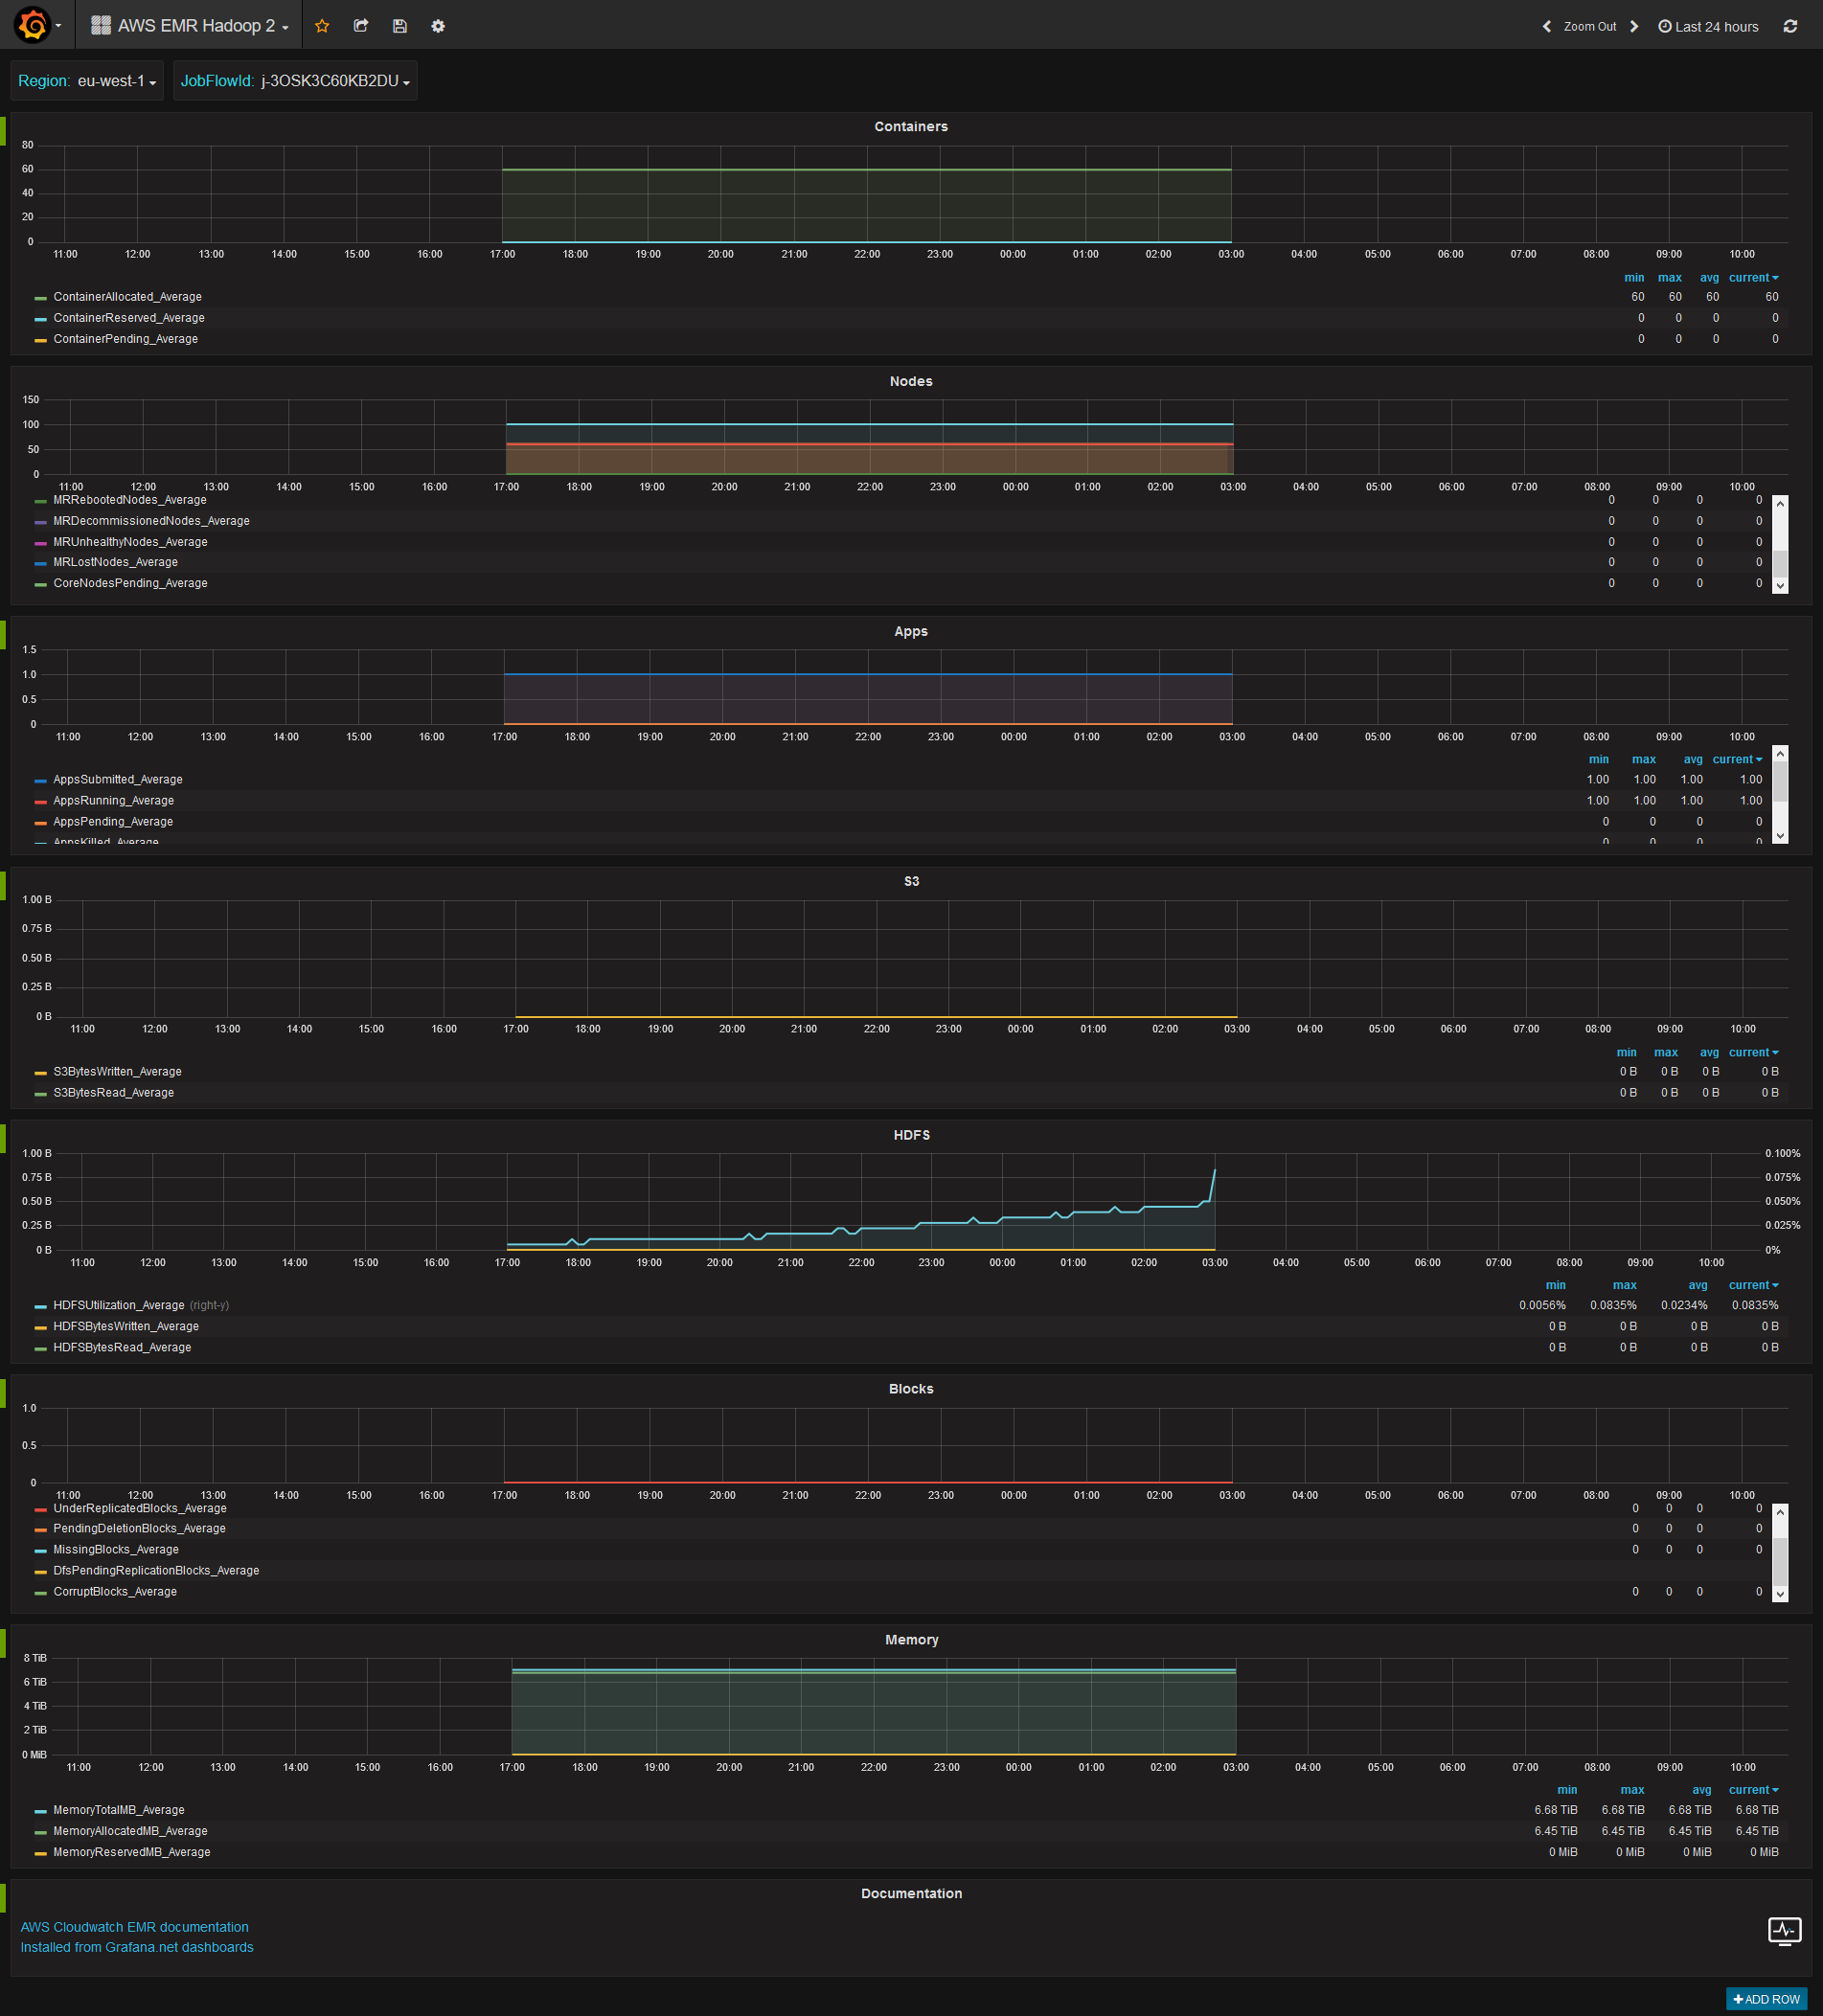
AWS EMR Hadoop 2
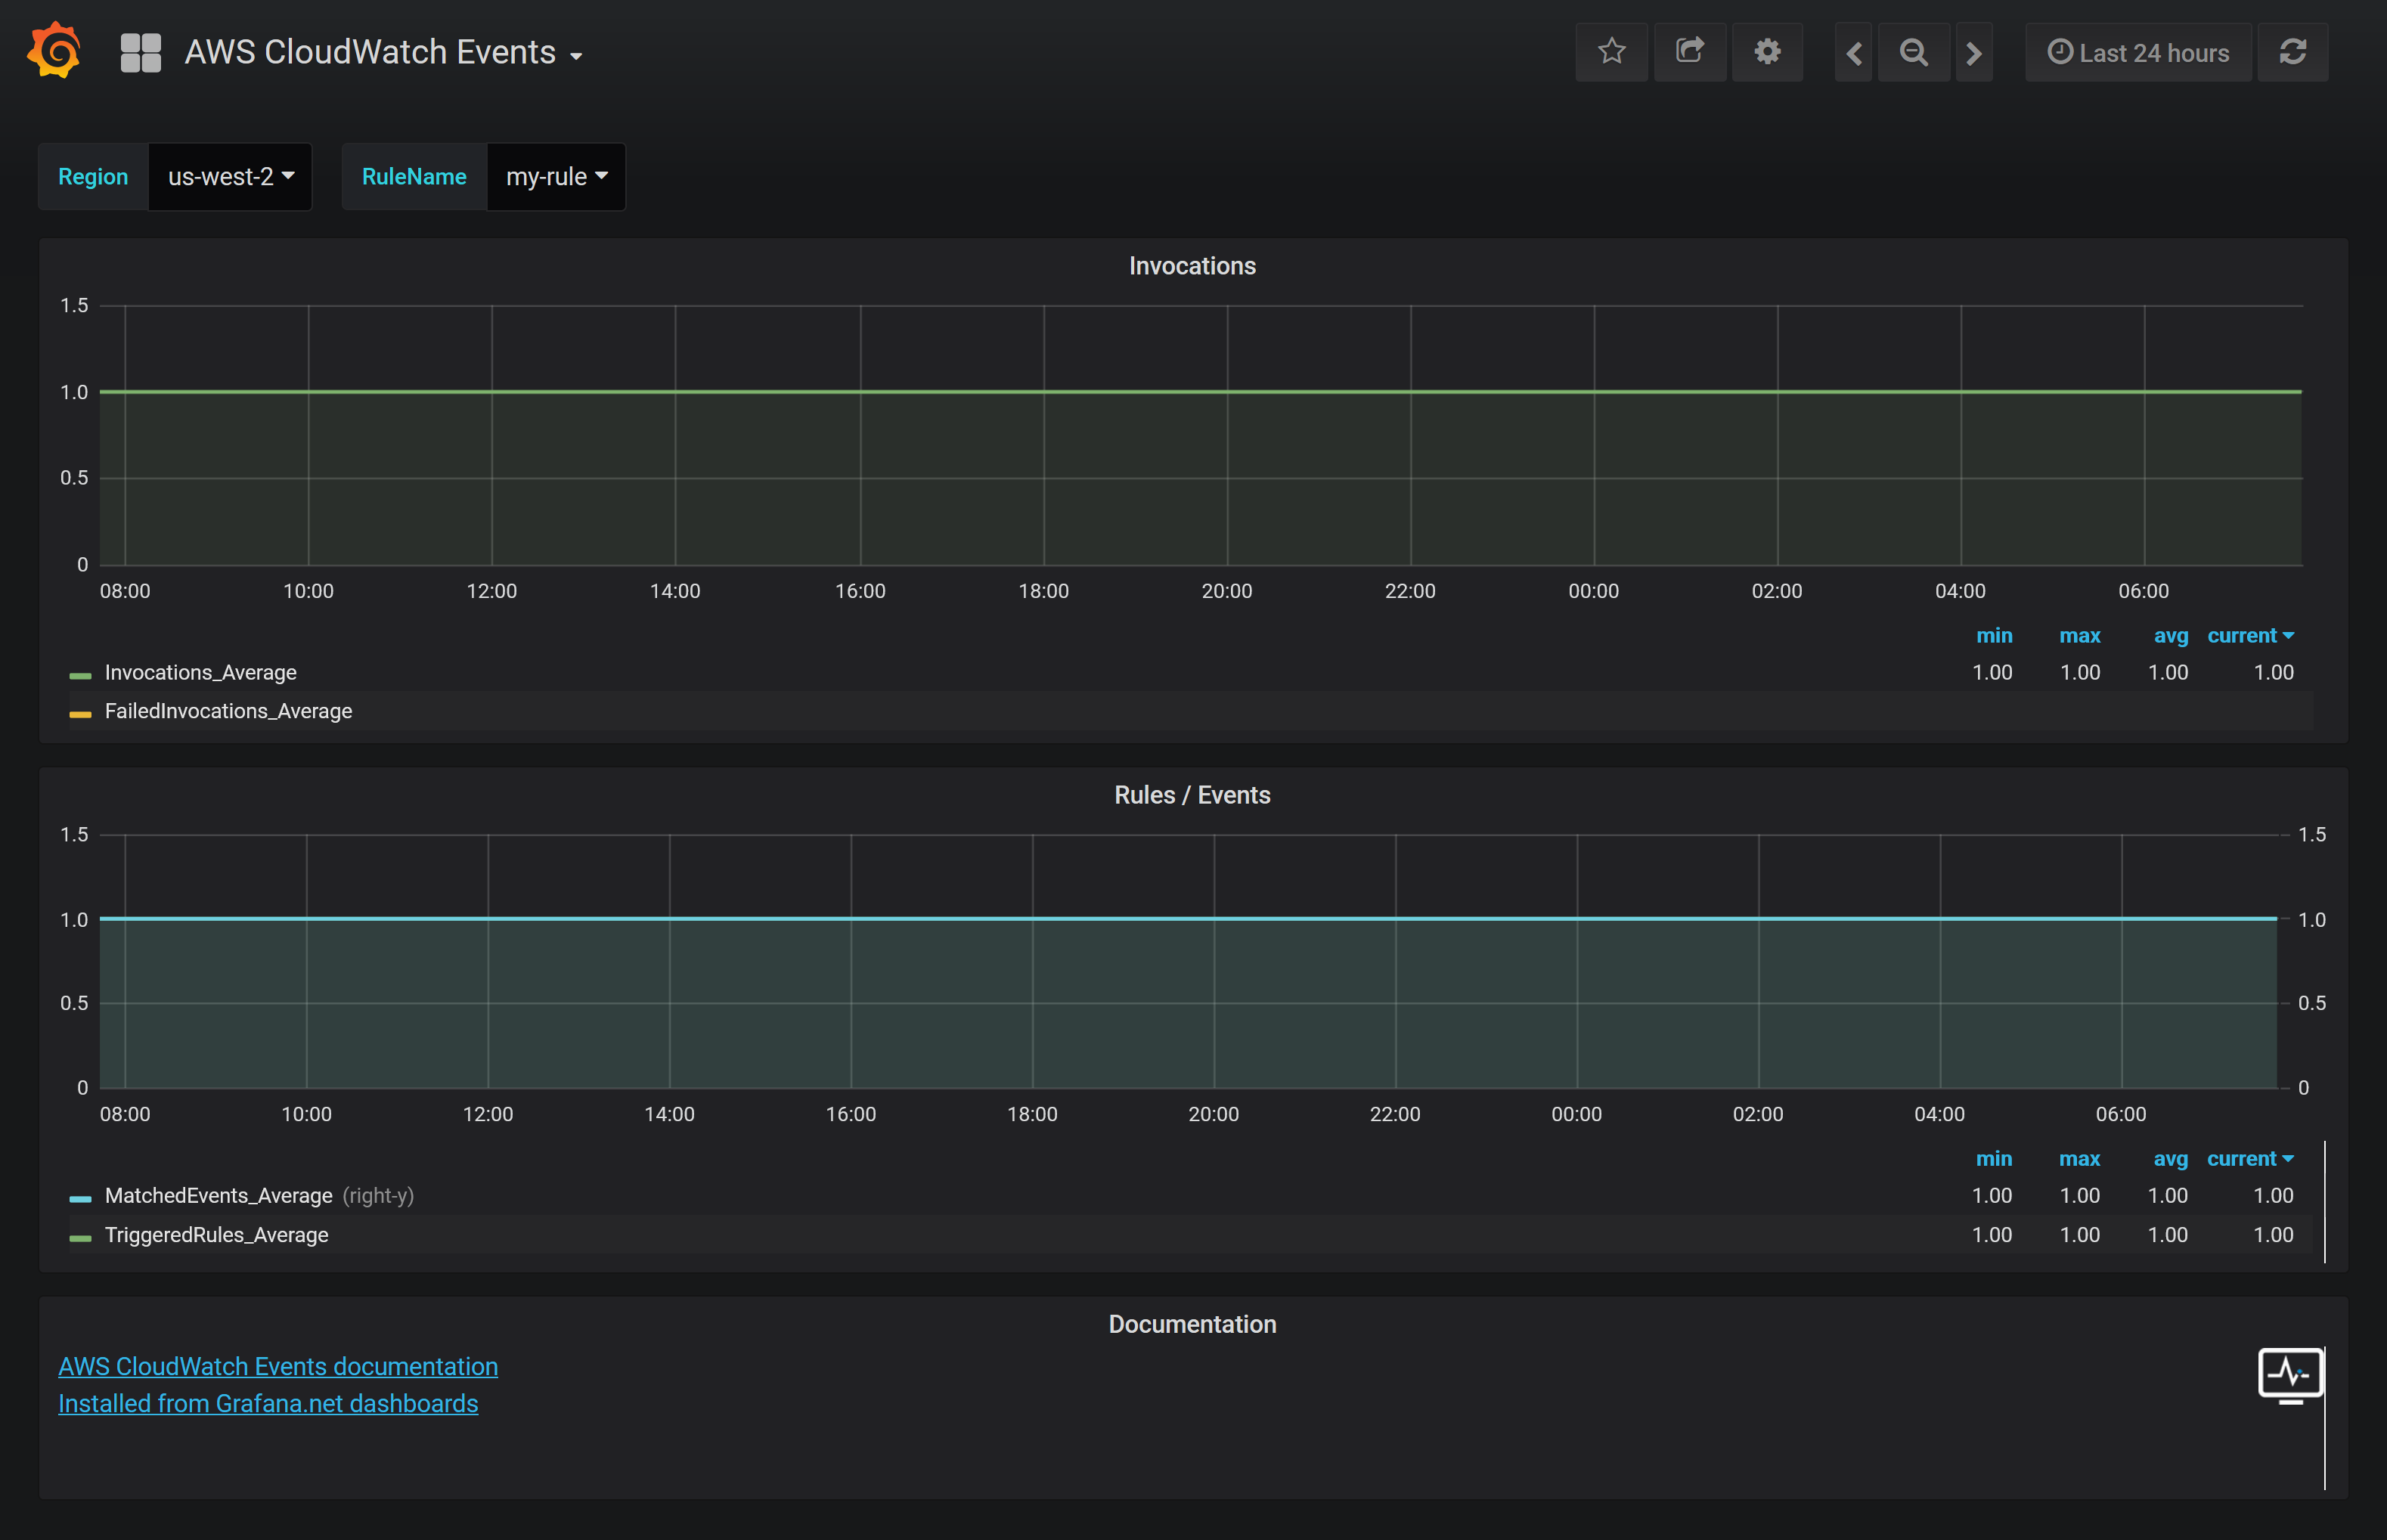
AWS Events
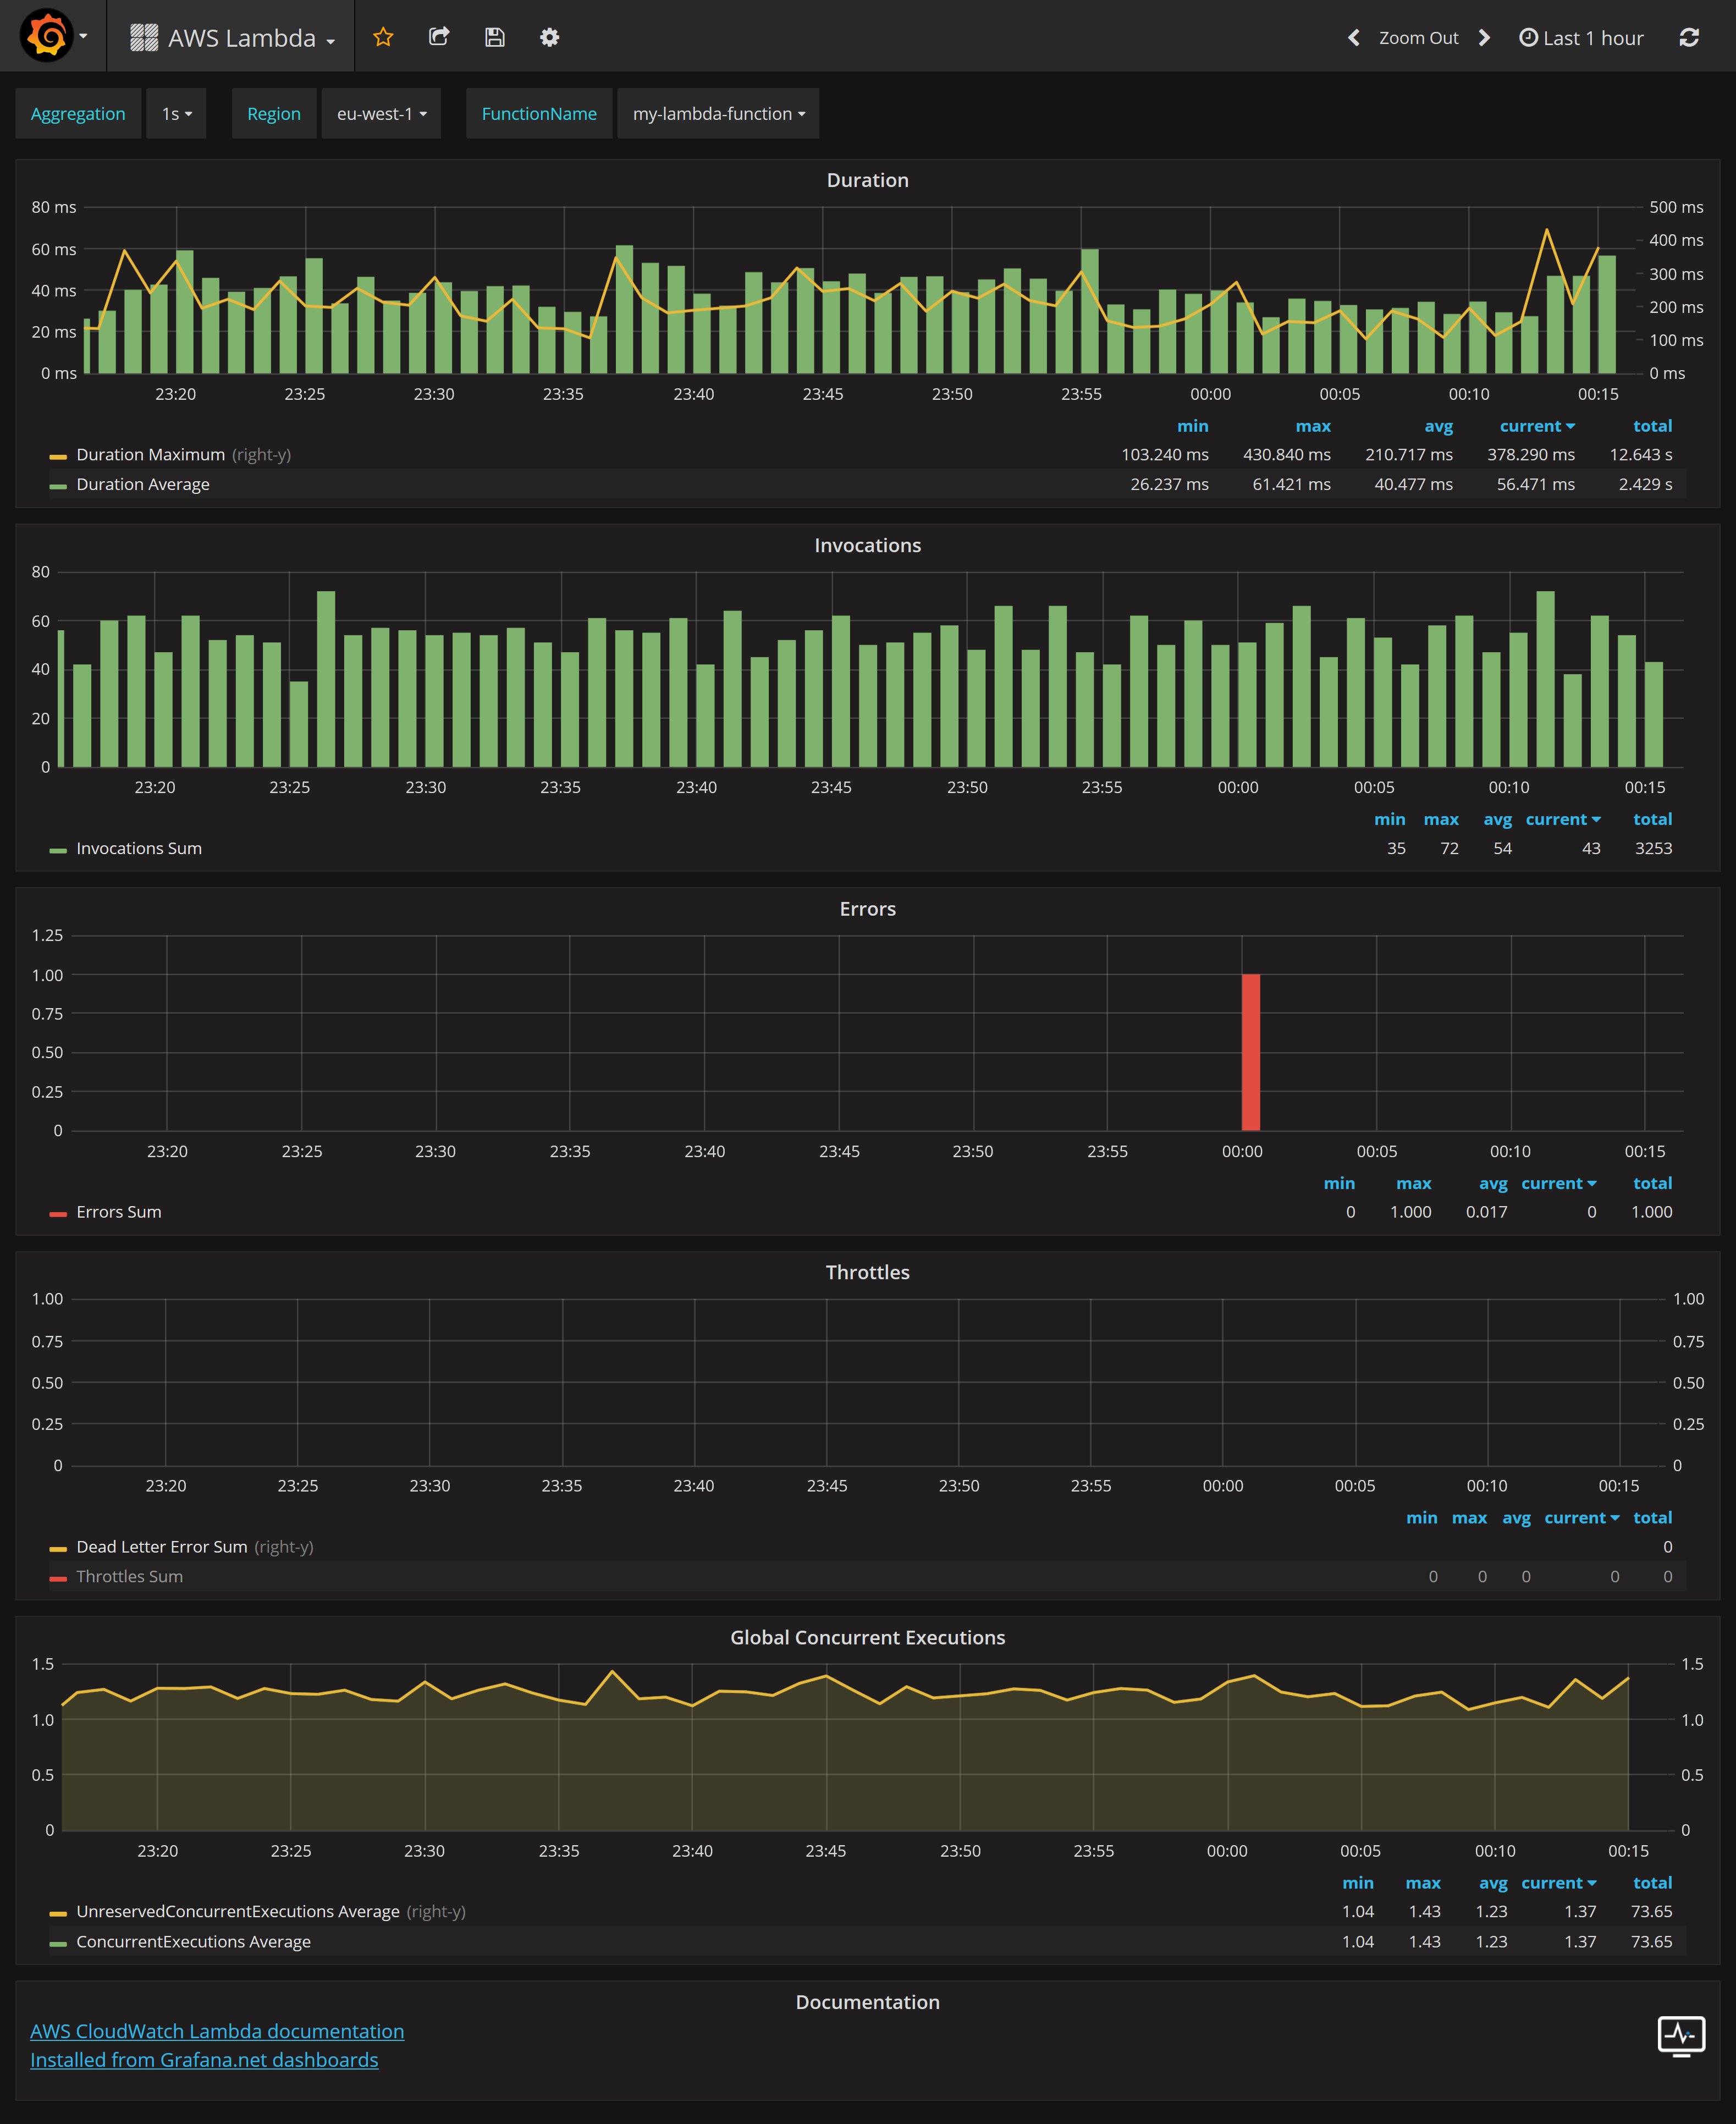
AWS Lambda
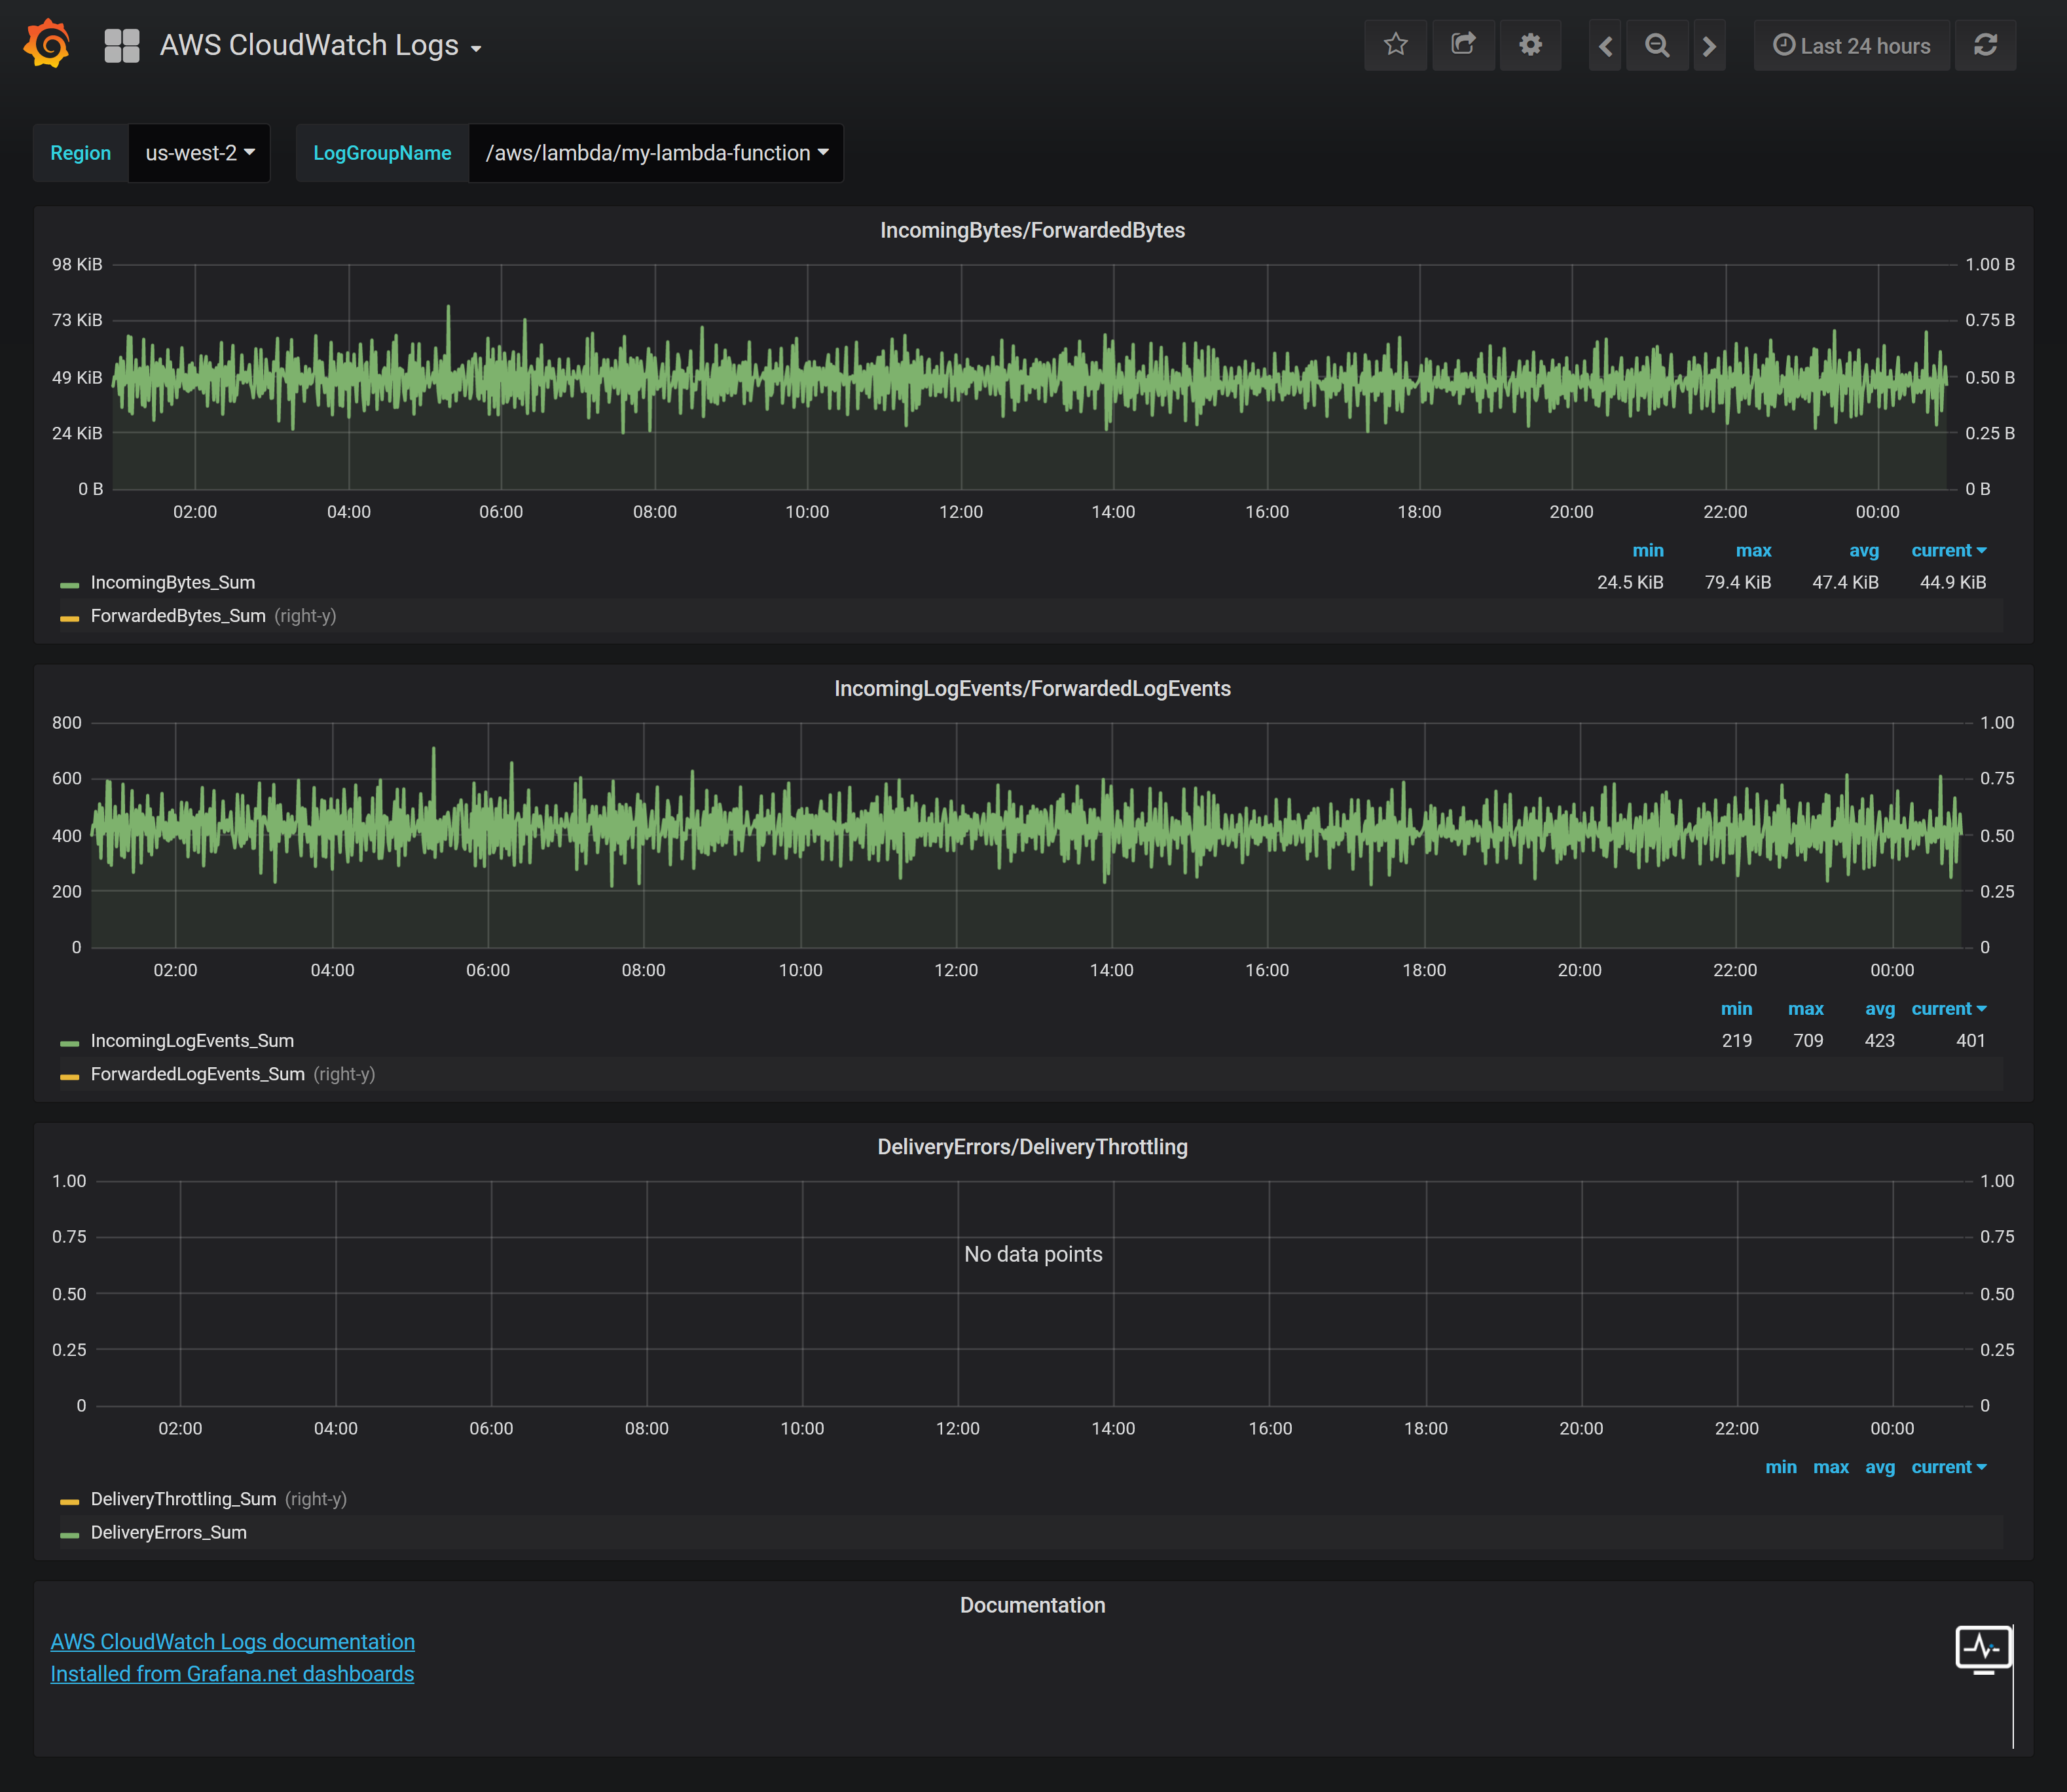
AWS Logs
AWS RDS
AWS Redshift
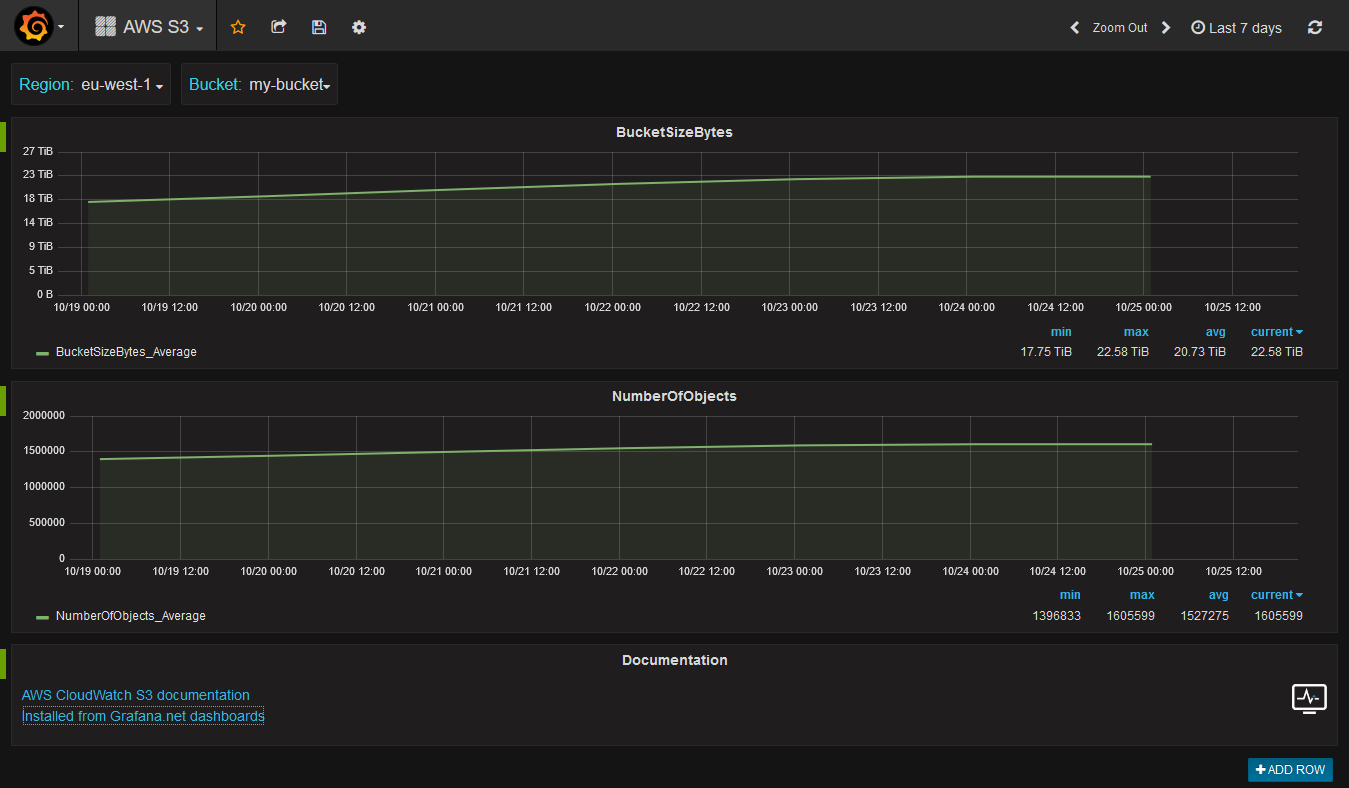
AWS S3
AWS SES
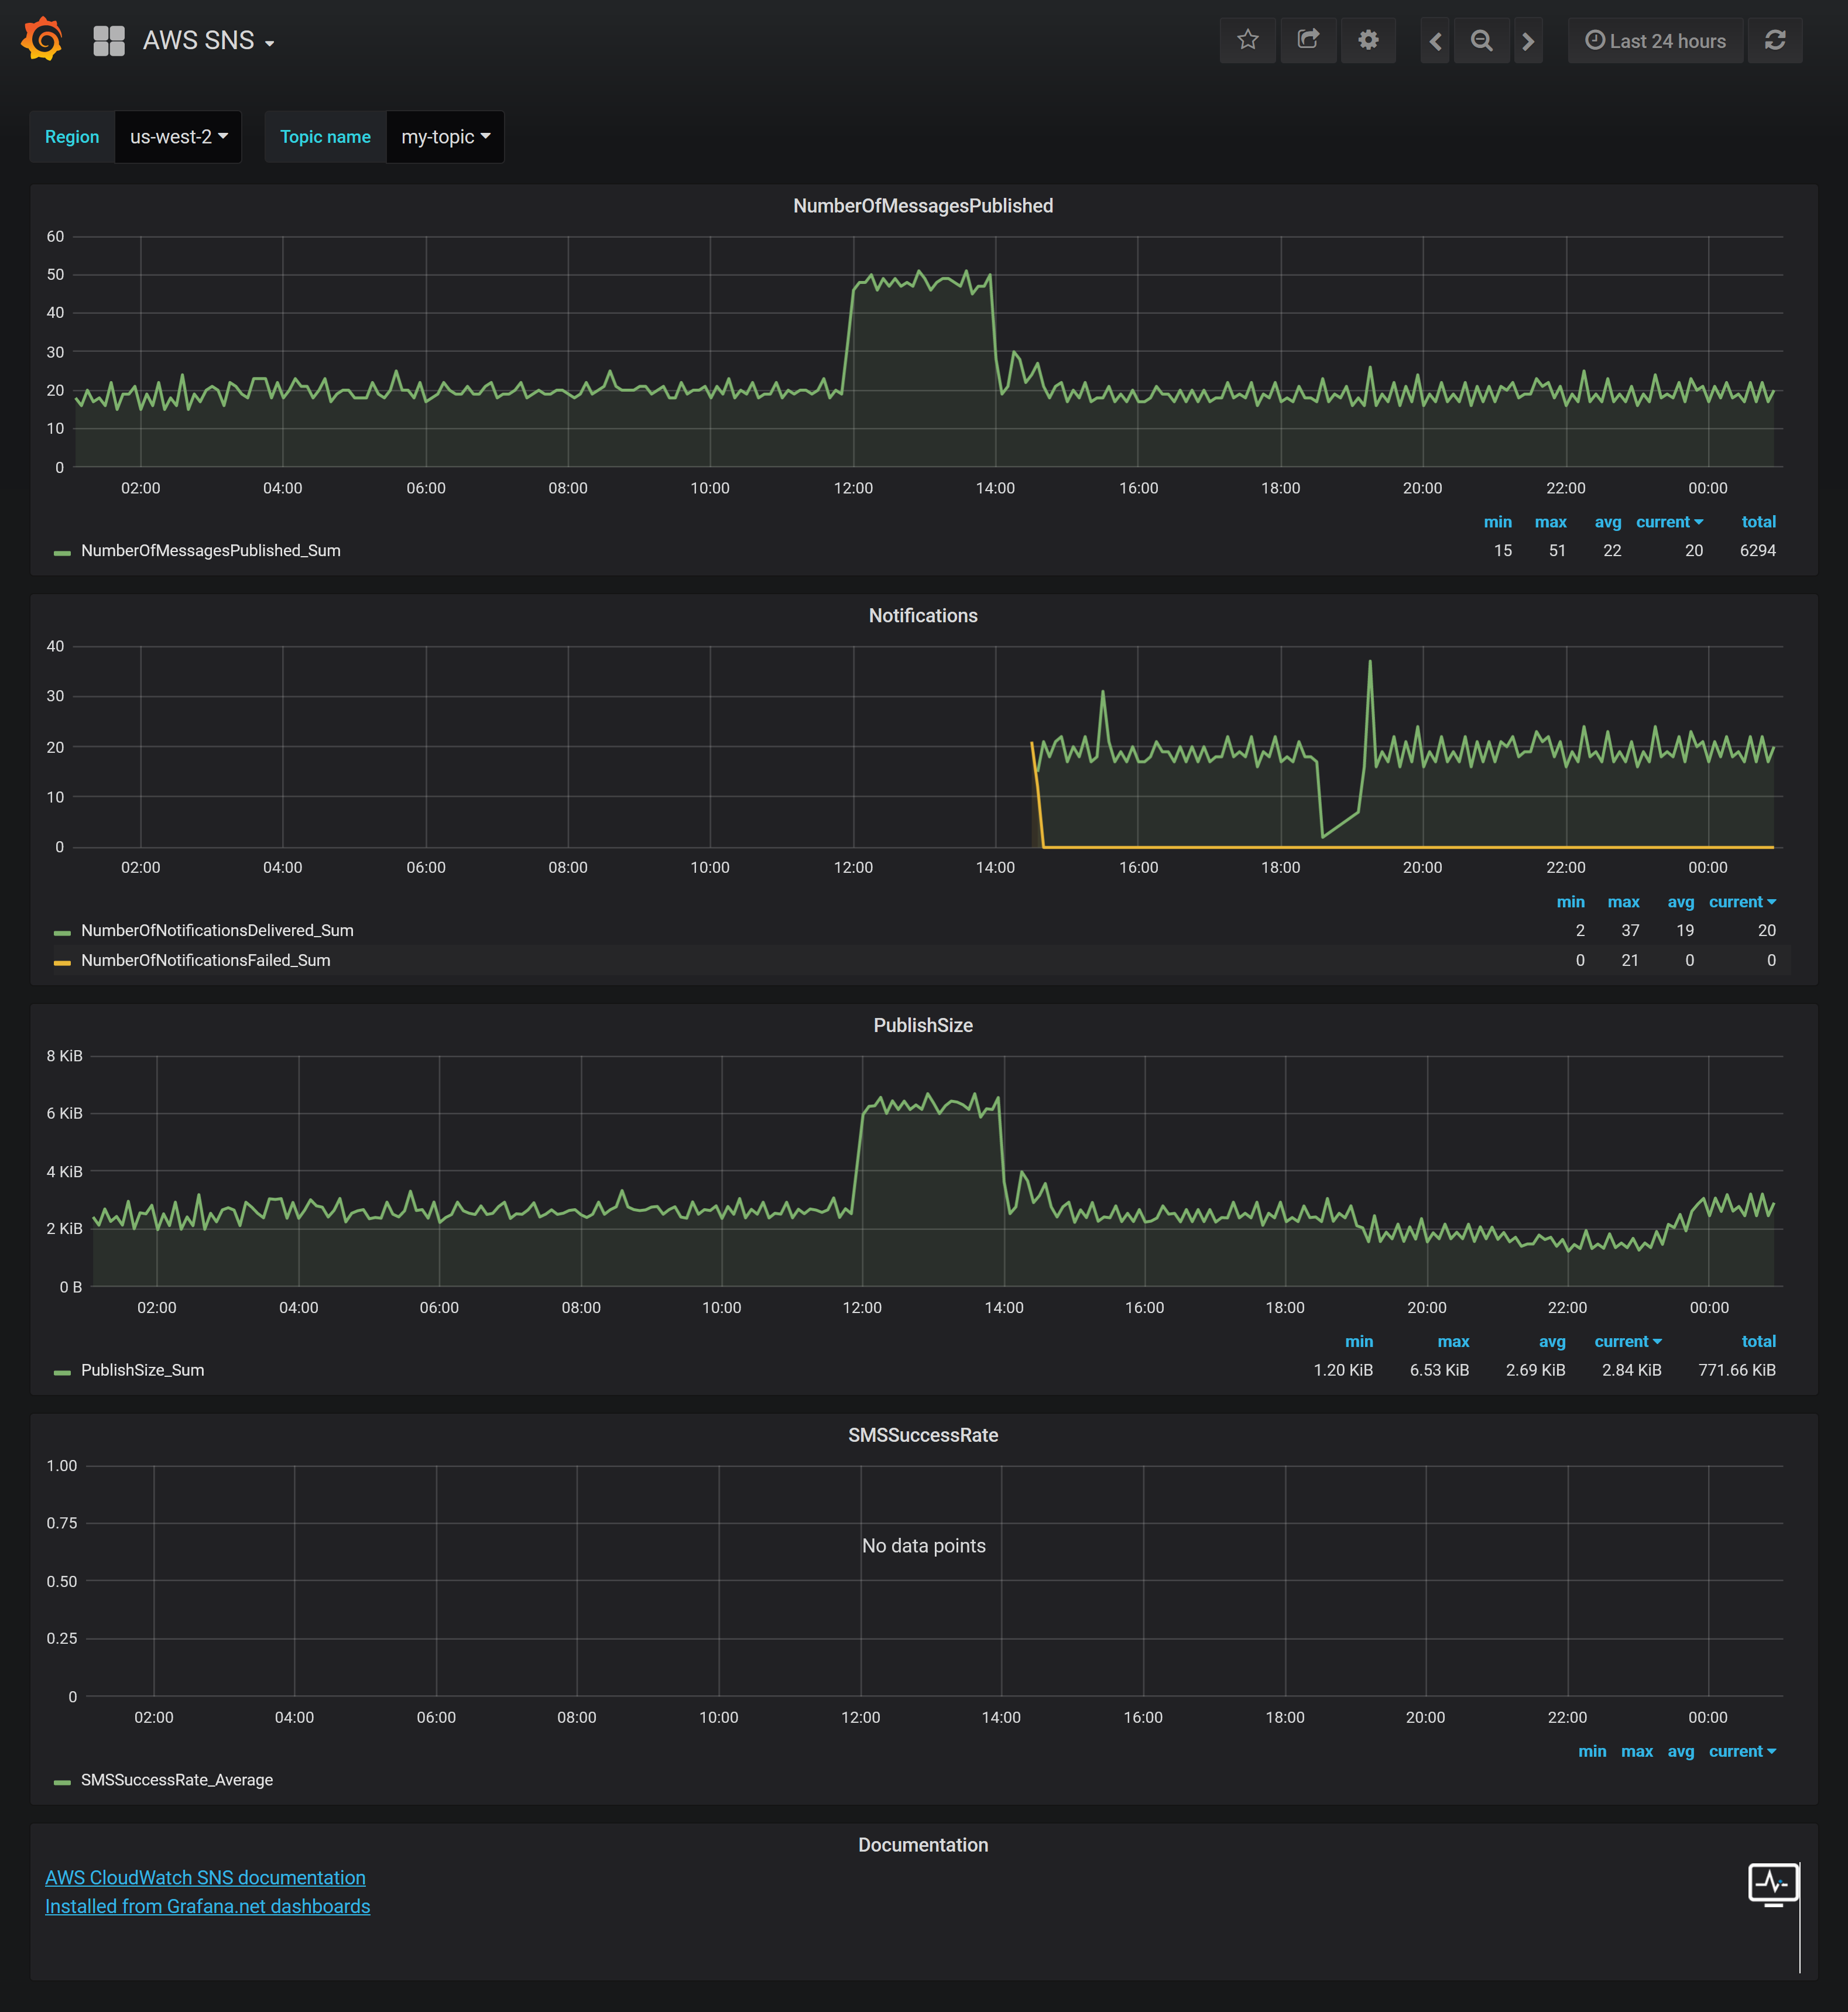
AWS SNS
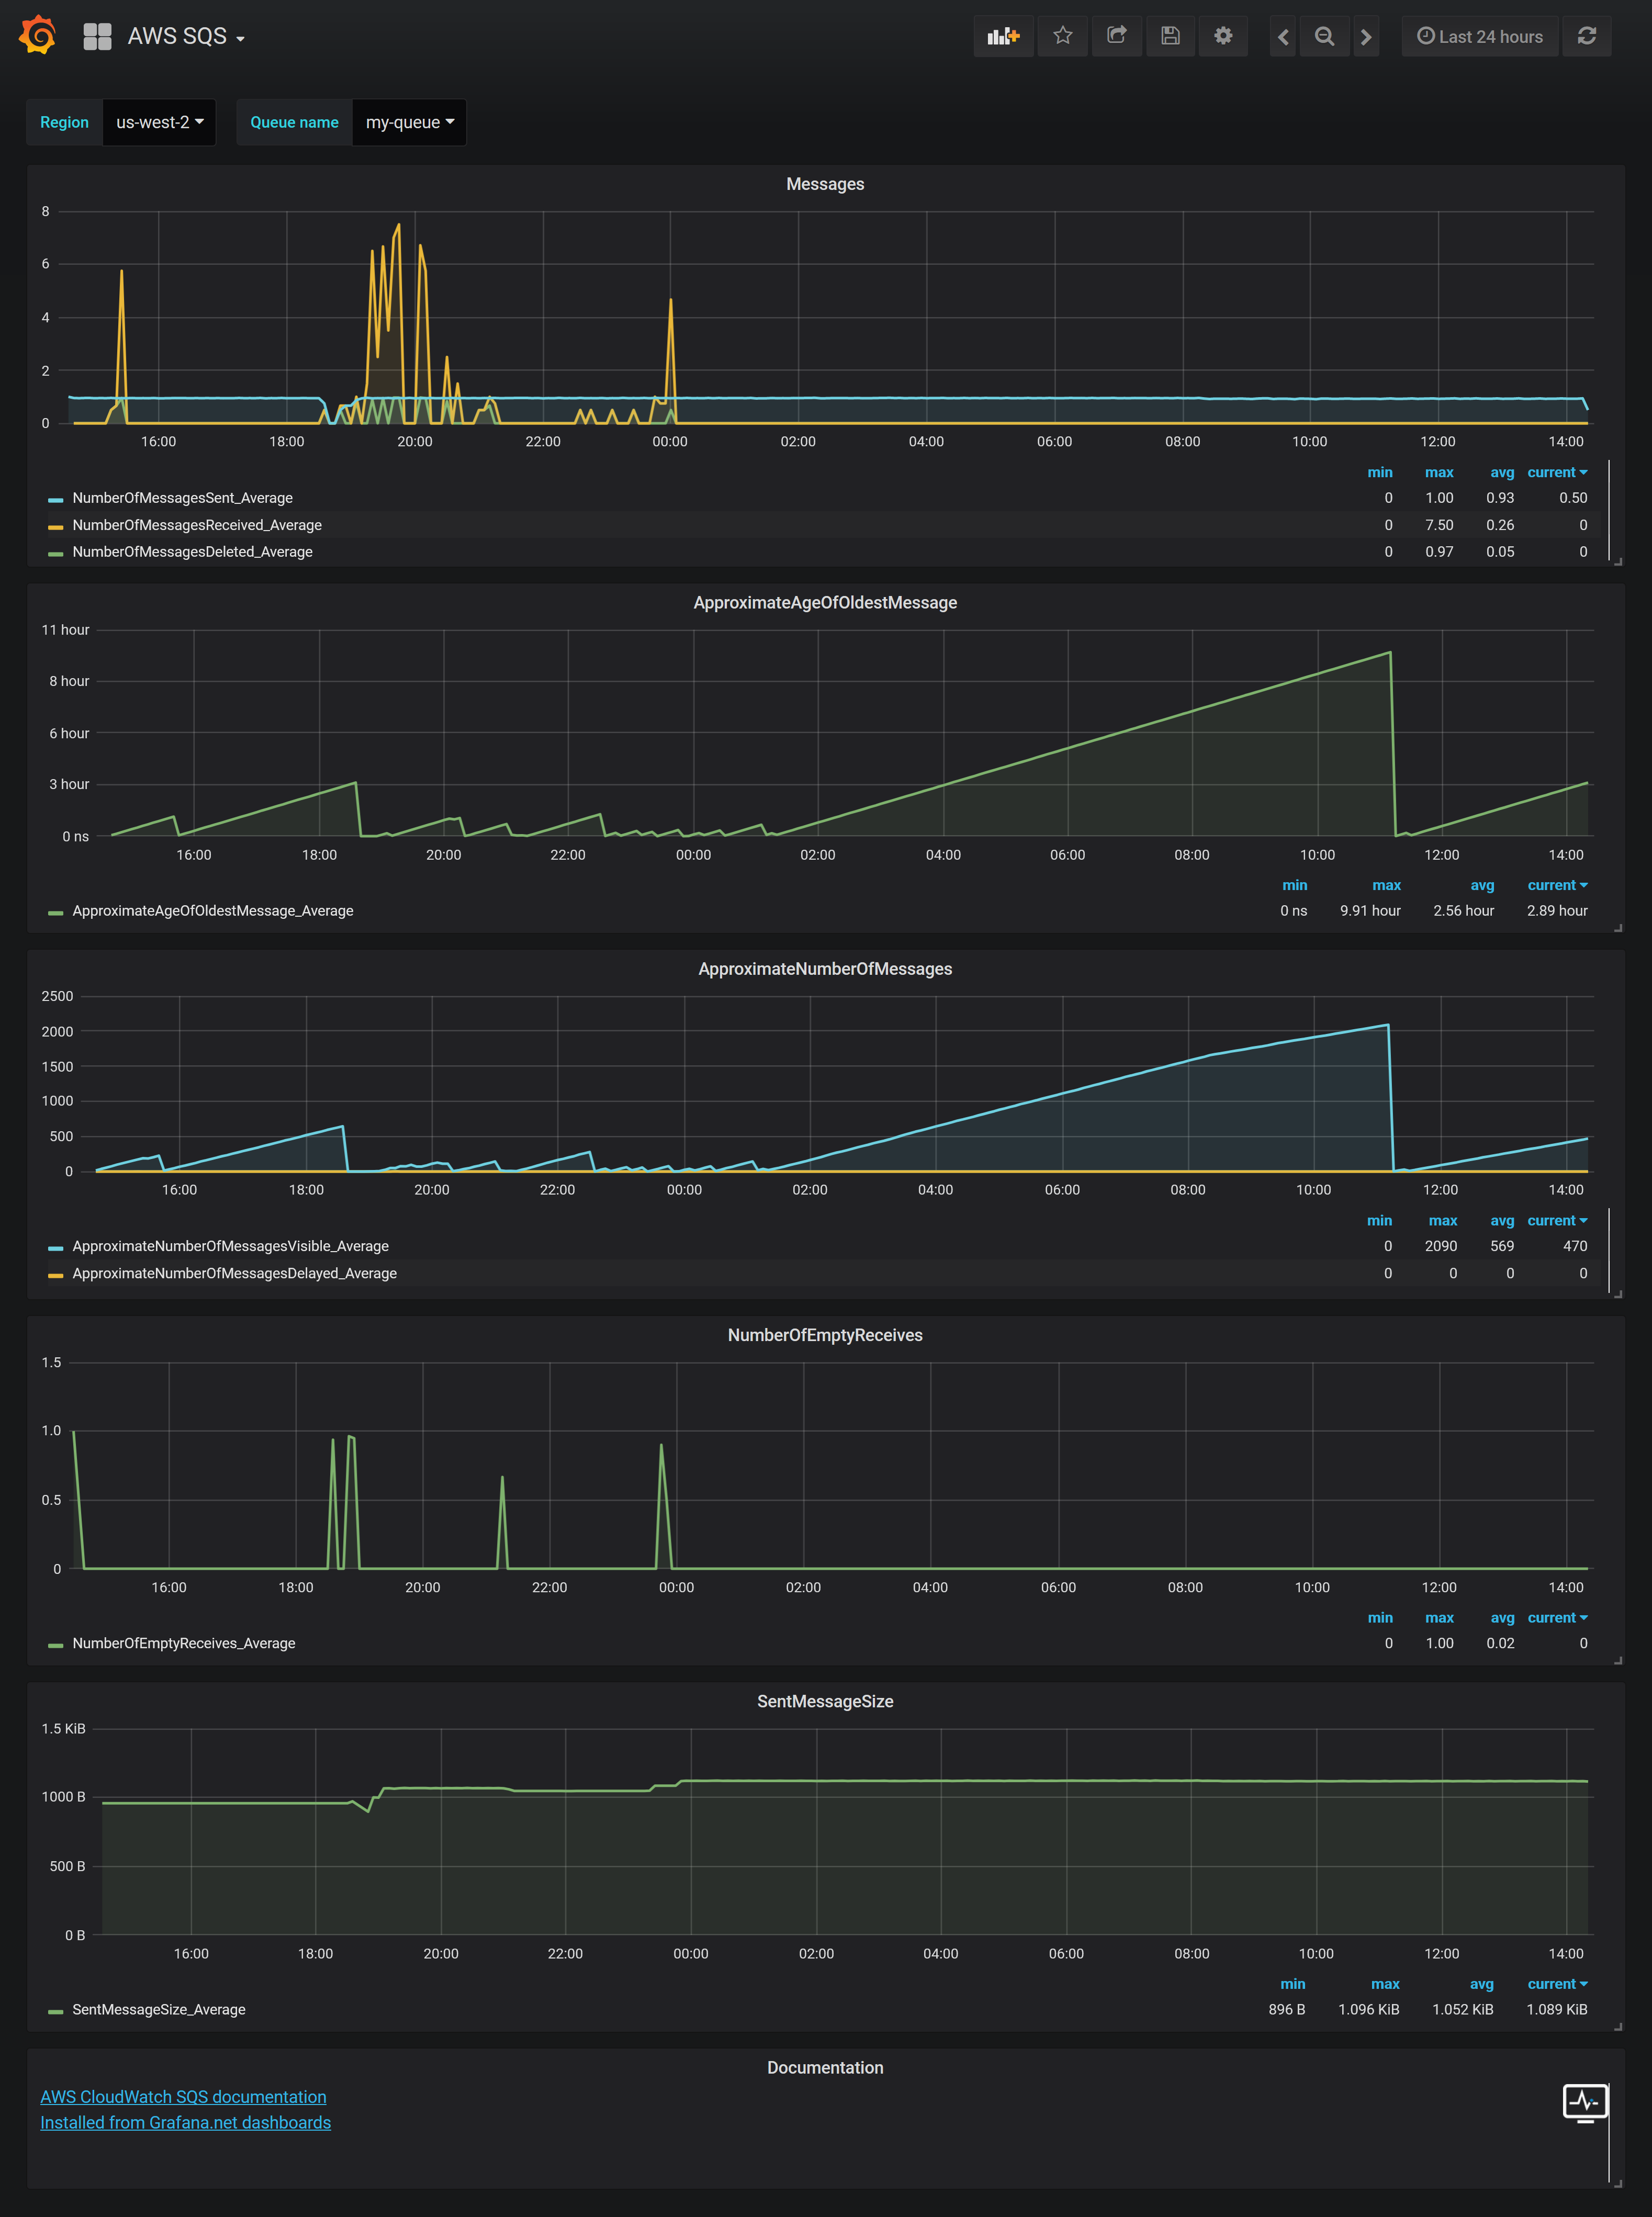
AWS SQS
AWS VPN
Author
Devops Monitoring Expert, who loves monitoring systems and cutting/bleeding edge technologies: Docker, Kubernetes, ECS, AWS, Google GCP, Terraform, Lambda, Zabbix, Grafana, Elasticsearch, Kibana, Prometheus, Sysdig,...
Summary:
- 2000+ GitHub stars
- 15 000+ Grafana dashboard downloads
- 1 000 000+ Docker image pulls
Professional devops / monitoring / consulting services: