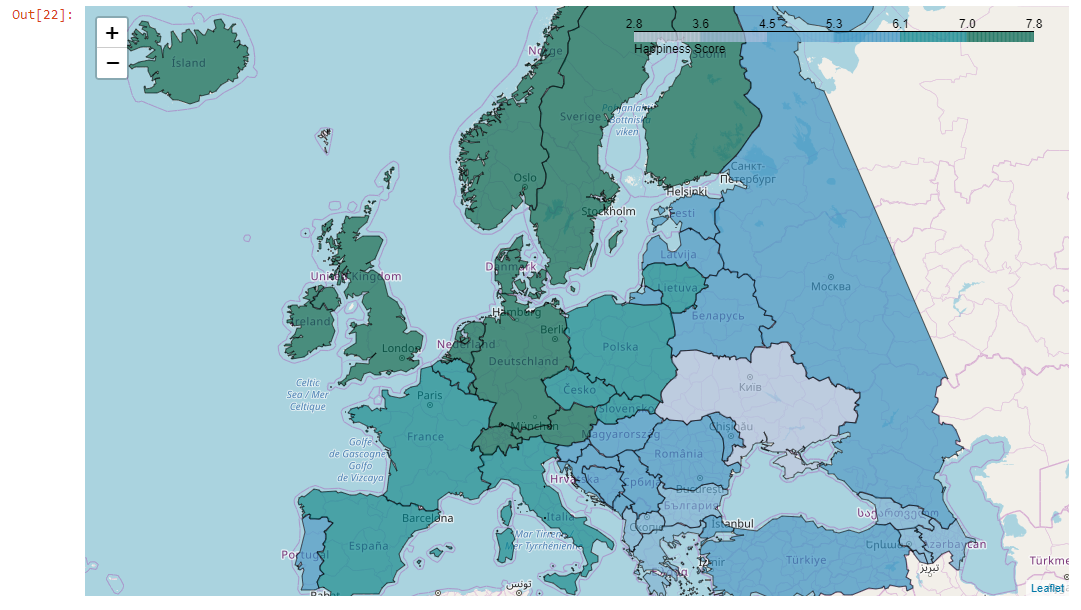
In this Jupyter notebook I will explore the happiness levels of Greece, during the period from 2015 to 2019.
I will use Python for data analysis and data visualization. More specifically I will use these Python Libraries:
- Pandas
- NumPy
- Matplotlib
- Folium
Because the folium maps do not seem to render on GitHub natively. Here's a screenshot of the Choropleth map of Europe.

To get the full functionality of the choropleth map, please visit nbviewer
The happiness scores and rankings use data from the Gallup World Poll.
The scores are based on answers to the main life evaluation question asked in the poll. This question, known as the Cantril ladder, asks respondents to think of a ladder with the best possible life for them being a 10 and the worst possible life being a 0 and to rate their own current lives on that scale.
The columns following the happiness score estimate the extent to which each of six factors – economic production, social support, life expectancy, freedom, absence of corruption, and generosity – contribute to making life evaluations higher in each country than they are in Dystopia, a hypothetical country that has values equal to the world’s lowest national averages for each of the six factors. They have no impact on the total score reported for each country, but they do explain why some countries rank higher than others.
You can find more info about the datasets and how to download them by clicking this link. Europe GeoJSON can be found here. Also you can connect with me via LinkedIn.
This Jupyter notebook is licensed under MIT License.