EventDetectR is an R-package for simulating, detecting and classifiying events in time-series data. It aims to combine multiple well-known R-packages like the forecast, neuralnet package to deliver an easily configurable tool for event detection.
The package can be installed directly from github:
require(devtools)
install_github("frehbach/EventDetectR")
Soon the package will also be available on CRAN.
The main function of the EventDetectR package is:
detectEvents <- function(x,
                         windowSize = 100,
                         nIterationsRefit = 1,
                         verbosityLevel = 0,
                         dataPrepators = "ImputeTSInterpolation",
                         dataPreparationControl = list(),
                         buildModelAlgo = "ForecastETS",
                         buildModelControl = list(),
                         buildNeuralNetModelControl=list(),
                         postProcessors = "bedAlgo",
                         postProcessorControl = list(),
                         ignoreVarianceWarning = TRUE)
'detectEvents' is used to detect events in a multi-dimensional time-series object / data.frame. This is done in a three steps approach:
- Data Preparation
- Model Building
- Result Postprocessing Each of these steps can be configured to use methodologies from multiple available packages. For example, beneath normalization it might be desired to clean the data and impute any existing NA-values. This can be done by simply adding a dataPreparator as a string name in the function call, e.g.:
dataPrepators = c("ImputeTSInterpolation")Additional parameters for the function can be passed via named variables in the control lists:
dataPreparationControl = list("option" = "spline", "useNormalization" = FALSE)All configurable package-functions can be shown via the supportedMethodFunctions:
getSupportedPreparations()
getSupportedModels()
getSupportedPostProcessors()
Default configurations and control lists can be found via:
getDefaultPreparationControl()
getDefaultModelControl()
getDefaultPostControl()
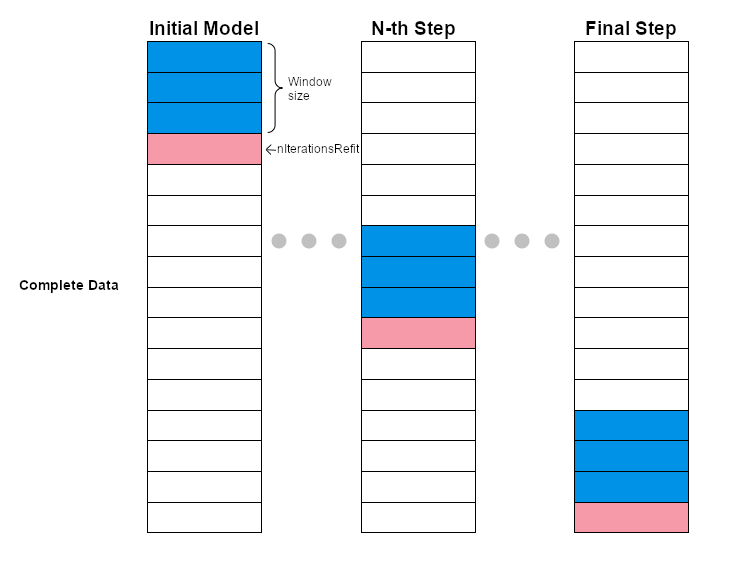
The event classification itself is shown in the graph below. #TODO make this graph look nice
At each classification iteration, a window of 'windowSize' datapoints (shown in blue) is first prepared with the specified data preparators. Next, a model is fitted and used to predict the next 'nIterationsRefit' data into the future. The real data (shown in red) is compared to the prediction in order to calculate residuals. These residuals together with the specified classification threshholds is used to decide which data is considered as event and which is considered background. After the classification, the window is moved by 'nIterationsRefit' rows in the data.frame and the procedure is repeated until the end of the data.frame / time-series is reached, and thus all elements are classified.
The newest version of the package includes the function simulateEvents. This function introduces simulated events into the time series/data.frame. At the moment 4 different types of events are included: Sinusoidal, Ramp, Slowsinusoidal and Square. The strenght and the duration of the event can be controlled on the function call.
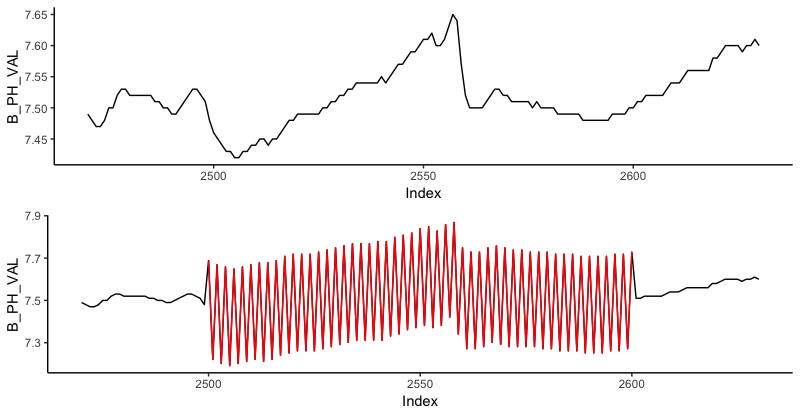
The usage of the function can be illustrated using the data set stationBData, already included on the package. An inconsistency following a sinusoidal pattern can be introduced on the B_PH_VAL in a given index range.
Intro_simulated_event<-simulateEvent(stationBData,
                         Params=c("B_PH_VAL","B_TEMP_VAL"),
                         Event_type = c("sinusoidal", "ramp"),
                         Event_strength = c(1,1),
                         Start_index = 2500,
                         Event_duration = NULL,
                         Percentage = NULL)
Since it was not specified on the function call the event duration defaults to 100 data points (from data index 2500 to 2600). The vizualitation of the changes introduced to B_PH_VAL are showed in red on the graph below.
A graphical user interface (GUI) for the EventDetectR package is currently in development. Check out the most recent status at: EventDetectGUI
Parts of this work were supported by the ''Ministerium für Kultur und Wissenschaft des Landes Nordrhein-Westfalen'' (FKZ: 005-1703-0011).


