This project encapsulates using multiple regression for modeling home sales data.
We are a small company looking for properties to purchase and remodel to either sell or rent in the King’s County, WA housing market. We will analyze housing data in order to understand the differing areas and factors which could lead to investment property strategy.
In the data directory is the kc_house_data.csv. The data is over 21,000 records of home sales from Kings County, Washington. The data columns are:
id - unique identified for a house
date - house was sold
price - is prediction target
bedrooms- of Bedrooms/House
bathrooms- of bathrooms/bedrooms
sqft_living - footage of the home
sqft_lot - footage of the lot
floors - Total floors (levels) in house
waterfront - House which has a view to a waterfront
view - Has been viewed
condition - How good the condition is ( Overall )
grade - overall grade given to the housing unit, based on King County grading system
sqft_above - square footage of house apart from basement
sqft_basement - square footage of the basement
yr_built - Built Year
yr_renovated - Year when house was renovated
zipcode - zip
lat - Latitude coordinate
long - Longitude coordinate
sqft_living15 - The avg square footage of interior housing living space for the nearest 15 neighbors
sqft_lot15 - The avg square footage of the land lots of the nearest 15 neighbors
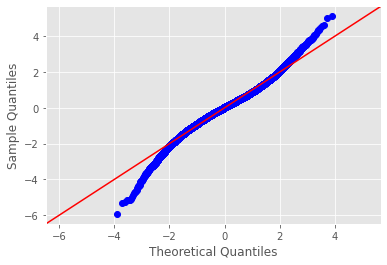
We performed Inferential Analysis on over 21,000 home sales from Kings County and by removing any data with a outliers which had a z score larger than 3. In a normal distribution 99% or all data falls with a z score of under 3.
We also performed a multiple regression analysis which allows us to build a pricing model and assess the strength and relationship and importance of the different features and their relation to an estimate price of a property.
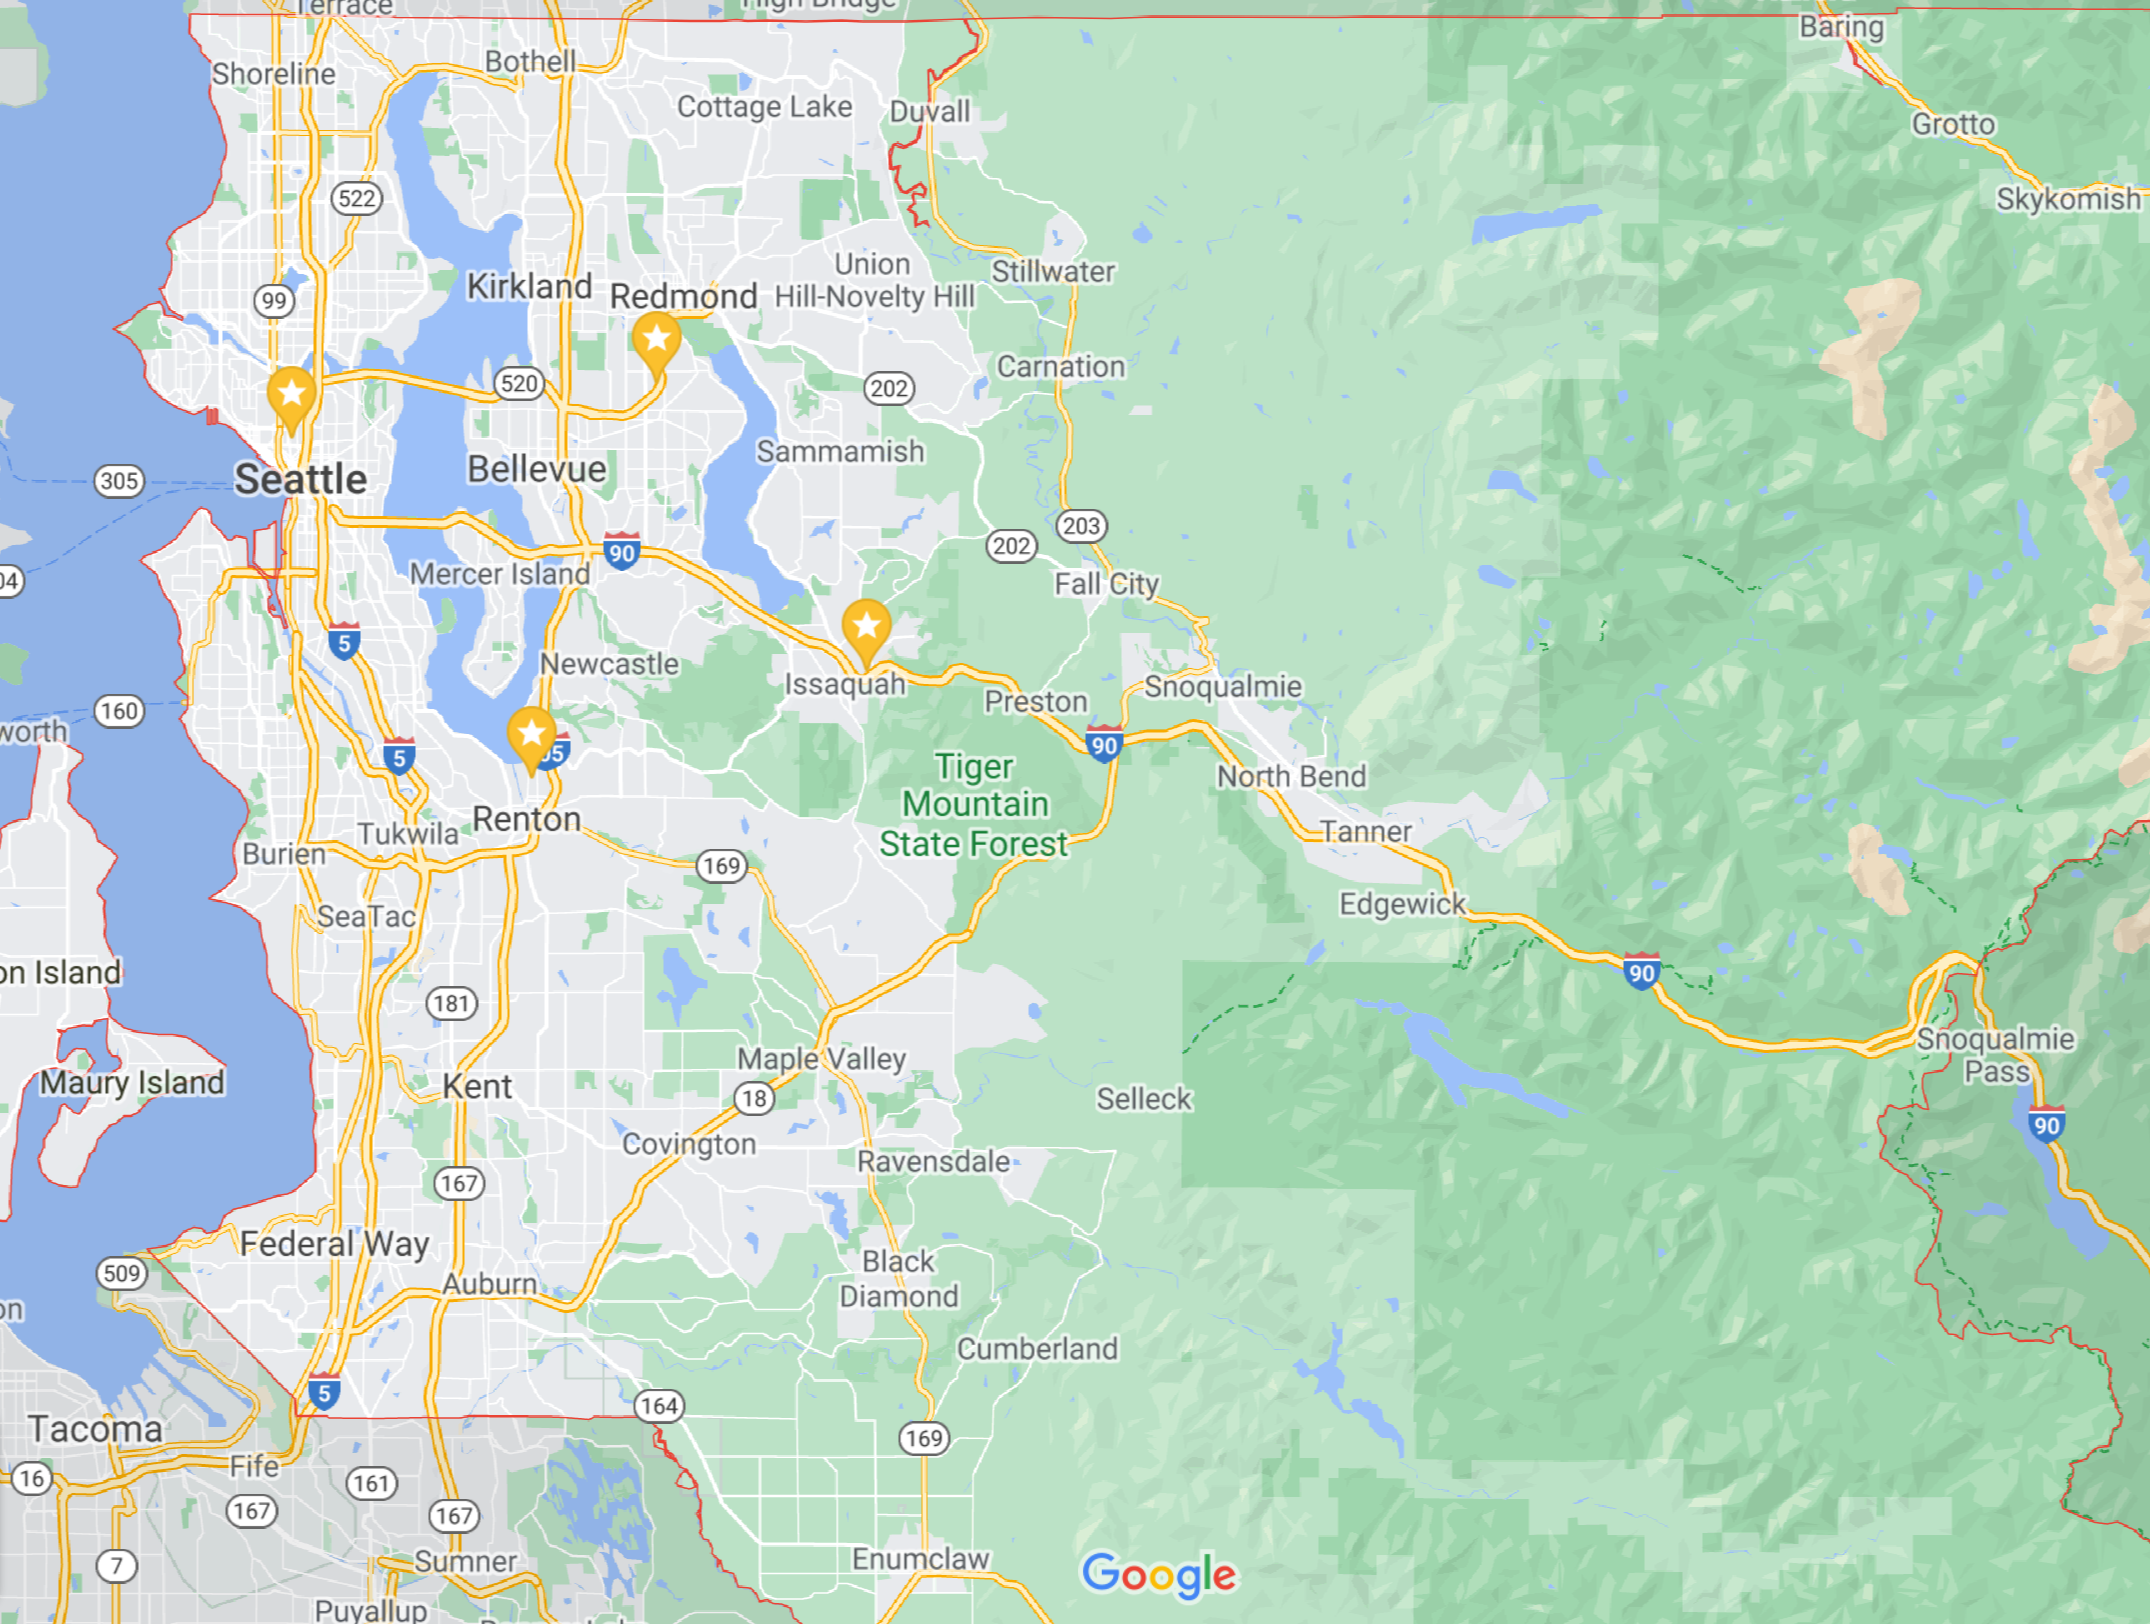
A new feature we created was distance from four major employment locations in Kings County.
Using the haversine formlula mentioned in the following blogs as reference:
Blog1
Blog2
Blog3
, I adjusted the approach to measure the distance from the top four employers instead of two cities.
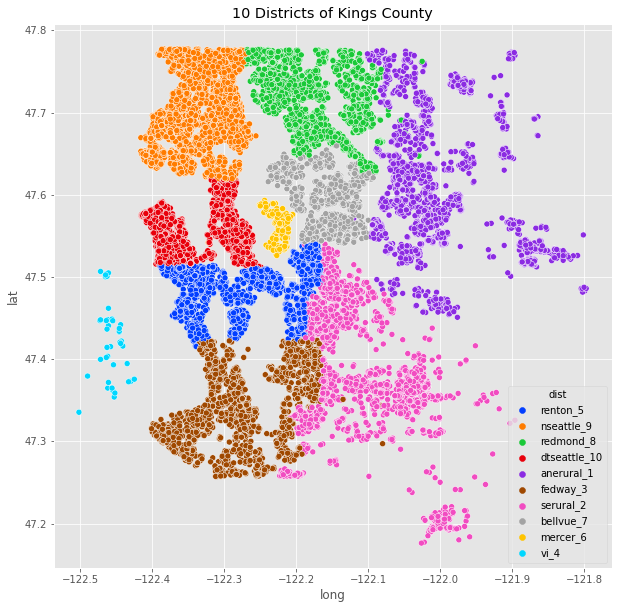
 We also created the district feature to divid the county into 10 separate districts based on zipcodes.

We also binned the Grade category into 3 bins, Low grade <=6, Medium 6-8, Hight Grade >8 to 13.
Our Model accounts for 80% of variance in the pricing data.
$$ log(price) = 8.1479 - 0.027 * (bedrooms) + 0.0464 * (bathrooms)
+ 0.0007 * (age) + 0.1495 * (view_1)
+ 0.1371 * (view_2) + 0.5490 * log(sqft_living)
+ 0.0606 * log(sqft_living15)
- 0.0226 * (distance) + 0.0970 * (grade_6_8)
+ 0.2341 * (grade_8_13)
+ 0.2098 * (d_anerural_1) + 0.4056 * (d_bellvue_7)
+ 0.2134 * (d_dtseattle_10) + 0.6221 * (d_mercer_6)
+ 0.6783 * (d_nseattle_9) + 0.2568 * (d_redmond_8)
- 0.0420 * (d_renton_5)
+ 0.0940 * (d_serural_2) + 0.1877 * (d_vi_4)
- 0.0546 * (distance * d_nseattle_9) $$
A significant interaction we included is the distance multiplied by the existance of d_nseattle_9 category.

Final RMSE of 112742
We have observed with our analysis that the districts of N Seattle and Mercer Island increase the estimated house price the most in regard to the 10 districts. A major opportunity is to find home which fall into the low grade category and possibly renovate them in order to change the grade to the middle to high categories in order to to increase the estimated sales price.
Influential factors in the model are the existence of a home in the N seattle district as compared to the base Fedway district increases the estimated price by 67%. If a home is on Mercer Island the estimated price is increased by 62% compared to a home in Fedway district. A home with a grade of 8 to 13 has a price increase of 23% compared to a home with grade of <6. The grading system ranks from 4 to 13 with 13 being top grade. Distance away from a major employer has a negative effect on the estimated price.
Identify other location options instead of the defined 10 districts.
Is the OLS the best model to use for this data? Identify other models to use with multiple regression.
See the full analysis in the Jupyter Notebook or review this presentation
For additional info, contact Daniel M. Smith at danielmsmith1@gmail.com
├── code
│ ├── init.py
│ ├── districts.py
│ ├── outliers.py
├── data
├── images
├── init.py
├── README.md
├── presentation.pdf
├── gitbhub.pdf
├── notebook_HomeRegression.pdf
├── HomeRegression.ipynb
