A simple library to benchmark performance of machine learning methods across different datasets. mlgauge is also a wrapper around PMLB and OpenML which provide benchmark datasets for machine learning.
mlgauge can help you if
- You are developing a machine learning method or an automl system and want to compare and analyze how it performs against other methods.
- You are learning different machine learning methods and would like to understand how different methods behave under different conditions.
Checkout the documentation to learn more.
pip install mlgauge
This is the workflow for setting up and running a comparison benchmark with mlgauge:
- Set up your methods by defining a
Methodclass. If your method follows the sklearn API, you can directly use theSklearnMethodwhich provides a typical sklearn workflow for estimators. - Set up the experiments with the
Analysisclass. - Collect the results for further comparative analysis.
from mlgauge import Analysis, SklearnMethod
from xgboost import XGBClassifier
from lightgbm import LGBMClassifier
from catboost import CatBoostClassifier
from sklearn.ensemble import GradientBoostingClassifier
import matplotlib.pyplot as plt

SEED = 42

methods = [
    ("xgboost", SklearnMethod(XGBClassifier(n_jobs=-1,verbose=0), ["accuracy", "f1_micro"])),
    ("lightgbm", SklearnMethod(LGBMClassifier(n_jobs=-1,verbose=0), ["accuracy", "f1_micro"])),
    ("catboost", SklearnMethod(CatBoostClassifier(thread_count=-1,verbose=0), ["accuracy", "f1_micro"])),
    ("gbm", SklearnMethod(GradientBoostingClassifier(verbose=0), ["accuracy", "f1_micro"])),
]

an = Analysis(
    methods=methods,
    metric_names=["accuracy", "f1 score"],
    datasets="classification",
    n_datasets=10,
    random_state=SEED,
)
an.run()

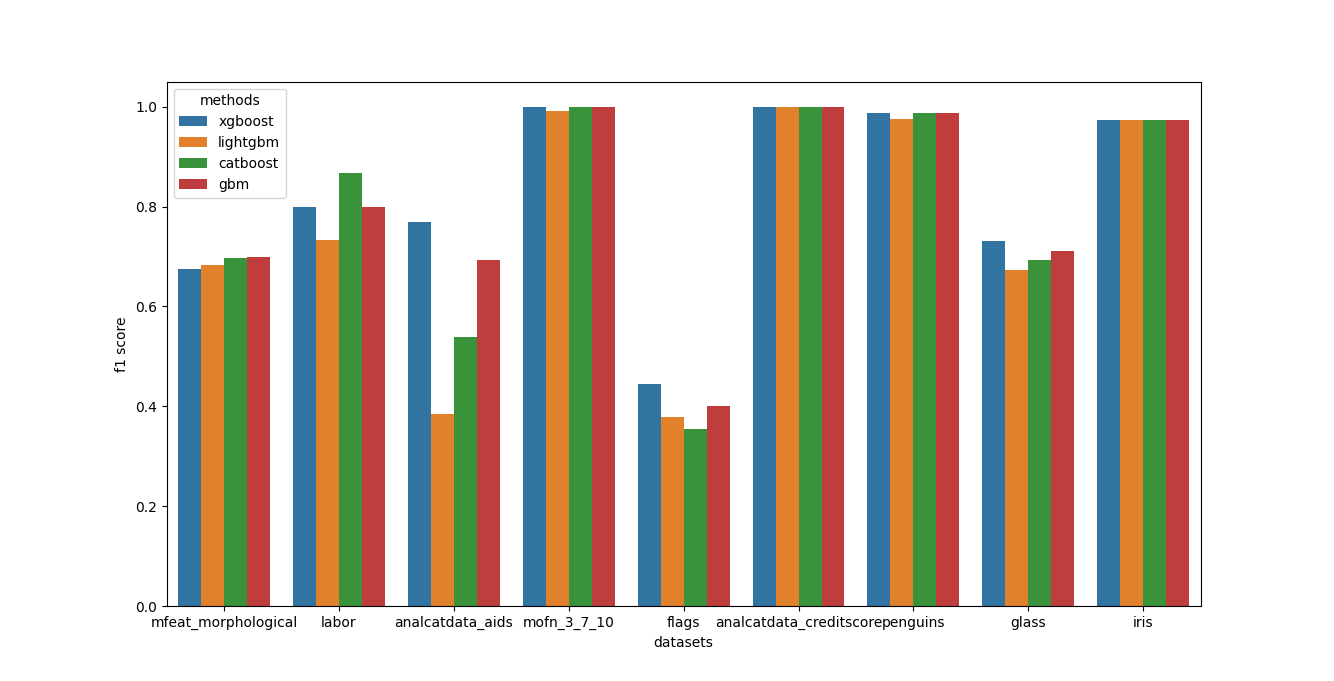
print(an.get_result_as_df("f1 score"))
xgboost lightgbm catboost gbm
datasets
mfeat_morphological 0.674000 0.682000 0.698000 0.700000
labor 0.800000 0.733333 0.866667 0.800000
analcatdata_aids 0.769231 0.384615 0.538462 0.692308
mofn_3_7_10 1.000000 0.990937 1.000000 1.000000
flags 0.444444 0.377778 0.355556 0.400000
analcatdata_creditscore 1.000000 1.000000 1.000000 1.000000
mfeat_morphological 0.674000 0.682000 0.698000 0.700000
penguins 0.988095 0.976190 0.988095 0.988095
glass 0.730769 0.673077 0.692308 0.711538
iris 0.973684 0.973684 0.973684 0.973684
an.plot_results("f1 score")More examples are available in the documentation.
Logo designed by the talented Neha Balasundaram.


