- JFrog Extension for VS Code & Eclipse Theia
- Table of Contents
- About this Extension
- Getting Started
- Set Up a FREE JFrog Environment in the Cloud
- Connecting VS Code to Your JFrog Environment
- Applying Your Xray Policies
- Proxy Configuration
- Extension Settings
- Using the Extension
- The Local View
- The CI View
- Troubleshooting
- License
- Building and Testing the Sources
- Code Contributions
The cost of remediating a vulnerability is akin to the cost of fixing a bug. The earlier you remediate a vulnerability in the release cycle, the lower the cost. JFrog Xray is instrumental in flagging components when vulnerabilities are discovered in production systems at runtime, or even sooner, during the development.
The JFrog VS Code Extension adds JFrog Xray scanning of project dependencies to your VS Code IDE. It allows developers to view panels displaying vulnerability information about the components and their dependencies directly in their VS Code IDE. The extension also allows developers to track the status of the code while it is being built, tested and scanned on the CI server.
The extension also applies JFrog File Spec JSON schema on the following file patterns: **/filespecs/*.json, *filespec*.json and *.filespec. Read more about JFrog File specs here.
- Install the JFrog extension in VS Code
- Need a FREE JFrog environment in the cloud? Create one now and connect VS Code to it
- Already have a working JFrog environment? Connect VS Code to it
- Start using the extension
Need a FREE JFrog environment in the cloud, so that VS Code can connect to it? Just run one of the following commands in your terminal. The commands will do the following:
- Install JFrog CLI on your machine.
- Create a FREE JFrog environment in the cloud for you.
- Configure VS Code to connect to your new environment.
MacOS and Linux using cUrl
curl -fL https://getcli.jfrog.io?setup | sh
Windows using PowerShell
powershell "Start-Process -Wait -Verb RunAs powershell '-NoProfile iwr https://releases.jfrog.io/artifactory/jfrog-cli/v2-jf/[RELEASE]/jfrog-cli-windows-amd64/jf.exe -OutFile $env:SYSTEMROOT\system32\jf.exe'" ; jf setup
Connect to your JFrog environment by clicking on the green Connect  button:
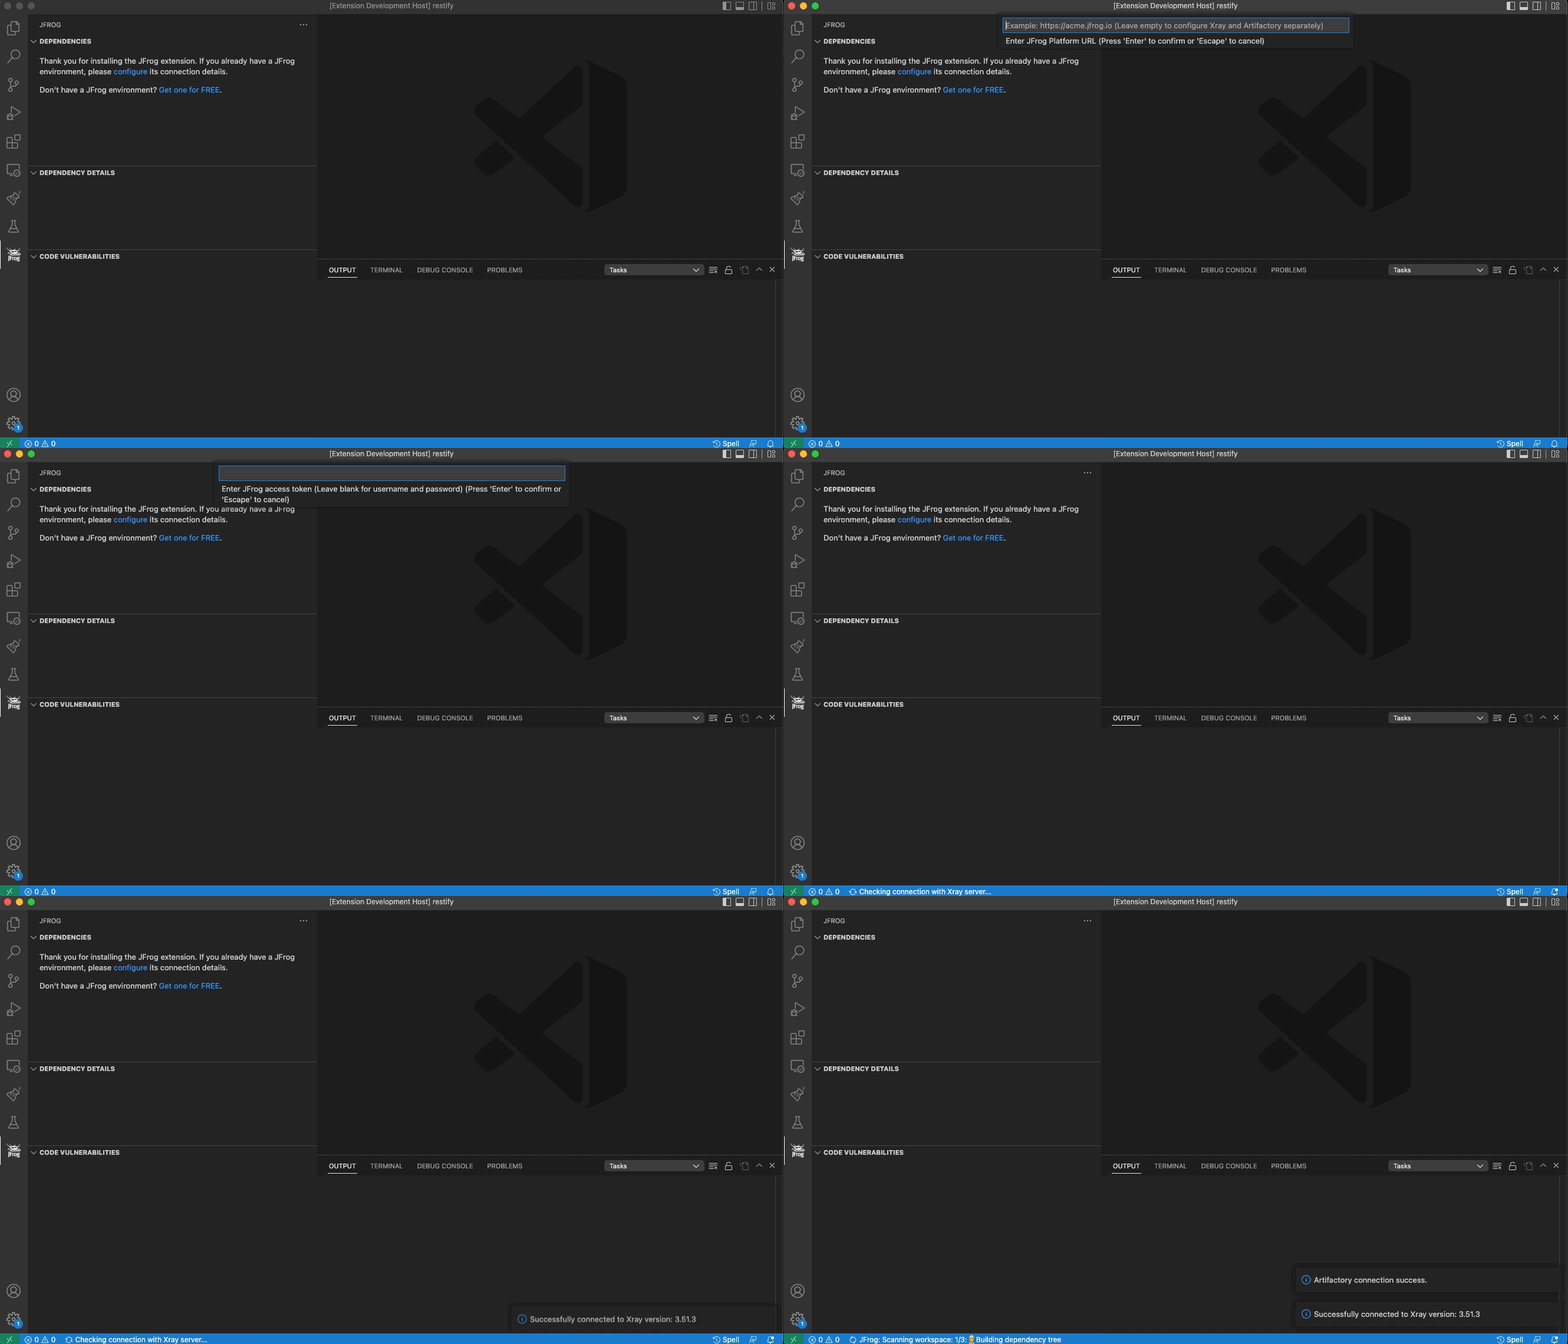
You can leave the platform URL empty, to enter the separate URLs for Artifactory and Xray.
The extension also supports connecting to your JFrog environment using environment variables. You may provide basic auth credentials or access token as follows:
Note: For security reasons, it is recommended to unset the environment variables after launching VS Code.
JFROG_IDE_URL- JFrog URLJFROG_IDE_USERNAME- JFrog usernameJFROG_IDE_PASSWORD- JFrog passwordJFROG_IDE_ACCESS_TOKEN- JFrog access tokenJFROG_IDE_STORE_CONNECTION- Set the value of this environment variable to true, if you'd like VS Code to store the connection details after reading them from the environment variables.
You can configure the JFrog VS-Code extension to reflect the Security Policies. The policies are configured in JFrog Xray.
If you'd like to use a JFrog Project that is associated with the policy, follow these steps:
- Create a JFrog Project, or obtain the relevant JFrog Project key.
- Create a Policy on JFrog Xray.
- Create a Watch on JFrog Xray and assign your Policy and Project as resources to it.
- Configure your Project key in the Extension Settings.
If however your policies are referenced through an Xray Watch or Watches, follow these steps instead:
- Create one or more Watches on JFrog Xray.
- Configure your Watches in the Extension Settings.
If your JFrog environment is behind an HTTP/S proxy, follow these steps to configure the proxy server:
- Go to Preferences --> Settings --> Application --> Proxy
- Set the proxy URL under 'Proxy'.
- Make sure 'Proxy Support' is 'override' or 'on'.
- Alternatively, you can use the HTTP_PROXY and HTTPS_PROXY environment variables.
If your proxy server requires credentials, follow these steps:
- Follow 1-3 steps under Proxy configuration.
- Encode with base64:
[Username]:[Password]. - Under 'Proxy Authorization' click on 'Edit in settings.json'.
- Add to settings.json:
"http.proxyAuthorization": "Basic [Encoded credentials]".
Username: fooPassword: bar
settings.json:
{
   "http.proxyAuthorization": "Basic Zm9vOmJhcg=="
}To open the extension settings, use the following VS Code menu command:
- On Windows/Linux - File > Preferences > Settings > Extensions > JFrog
- On macOS - Code > Preferences > Settings > Extensions > JFrog
The extension offers two modes, Local and CI. The two modes can be toggled by pressing on their respective buttons that will appear next to the components tree.
- The Local view displays information about the local code as it is being developed in VS Code. JFrog Xray continuously scans the project's dependencies and source code locally. The information is displayed in the Local view.
- The CI view allows the tracking of the code as it is built, tested and scanned by the CI server. It displays information about the status of the build and includes a link to the build log on the CI server.
The local view of the extension adds JFrog Xray scanning of project dependencies to your VS Code IDE. It allows developers to view panels displaying vulnerability information about their dependencies and source code in their VS Code IDE. With this information, a developer can make an informed decision on whether to use a component or not before it gets entrenched into the organization’s product.
| Features | Go | Maven | npm | Yarn v1 | Pypi | .NET |
|---|---|---|---|---|---|---|
| Issues and licenses scanning | ✅ | ✅ | ✅ | ✅ | ✅ | ✅ |
| Filter dependencies by severity, license, and scope | ✅ | ✅ | ✅ | ✅ | ✅ | ✅ |
| Trigger scan on startup | ✅ | ✅ | ✅ | ✅ | ✅ | ✅ |
| Jump from dependency tree to project descriptor | ✅ | ✅ | ✅ | ✅ | ✅ | ❌ |
| Jump from project descriptor to dependency tree | ✅ | ✅ | ✅ | ✅ | ✅ | ❌ |
| Show vulnerabilities inside the project descriptor | ✅ | ✅ | ✅ | ✅ | ✅ | ❌ |
| Upgrade vulnerable dependencies to fixed versions | ✅ | ✅ | ✅ | ✅ | ❌ | ❌ |
| Automatically trigger a scan upon code changes | ✅ | ❌ | ✅ | ✅ | ❌ | ❌ |
| Exclude transitive dependencies from project descriptor | ❌ | ✅ | ❌ | ❌ | ❌ | ❌ |
The icon demonstrates the top severity issue of a selected component and its transitive dependencies. The following table describes the severities from lowest to highest:
View the dependencies used by the project in a tree, where the direct dependencies are at the top.
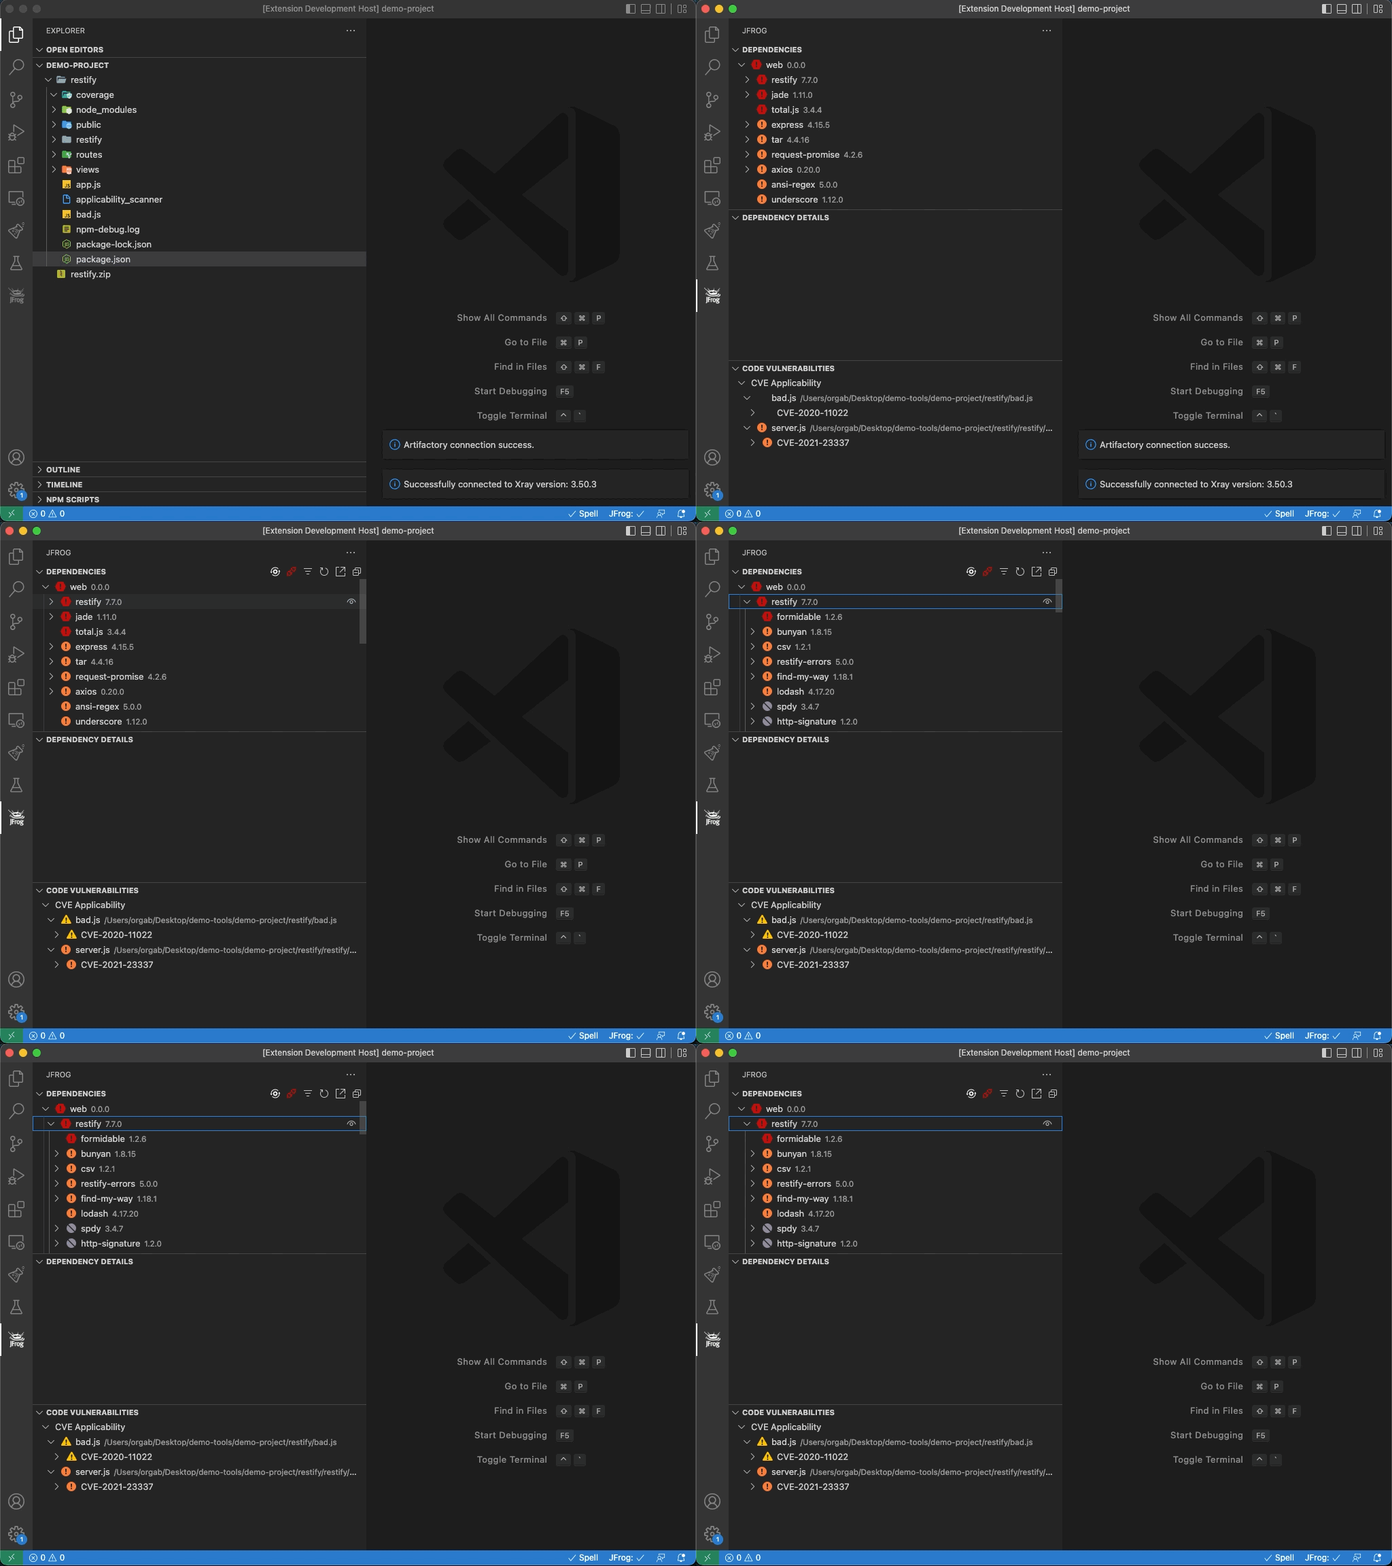
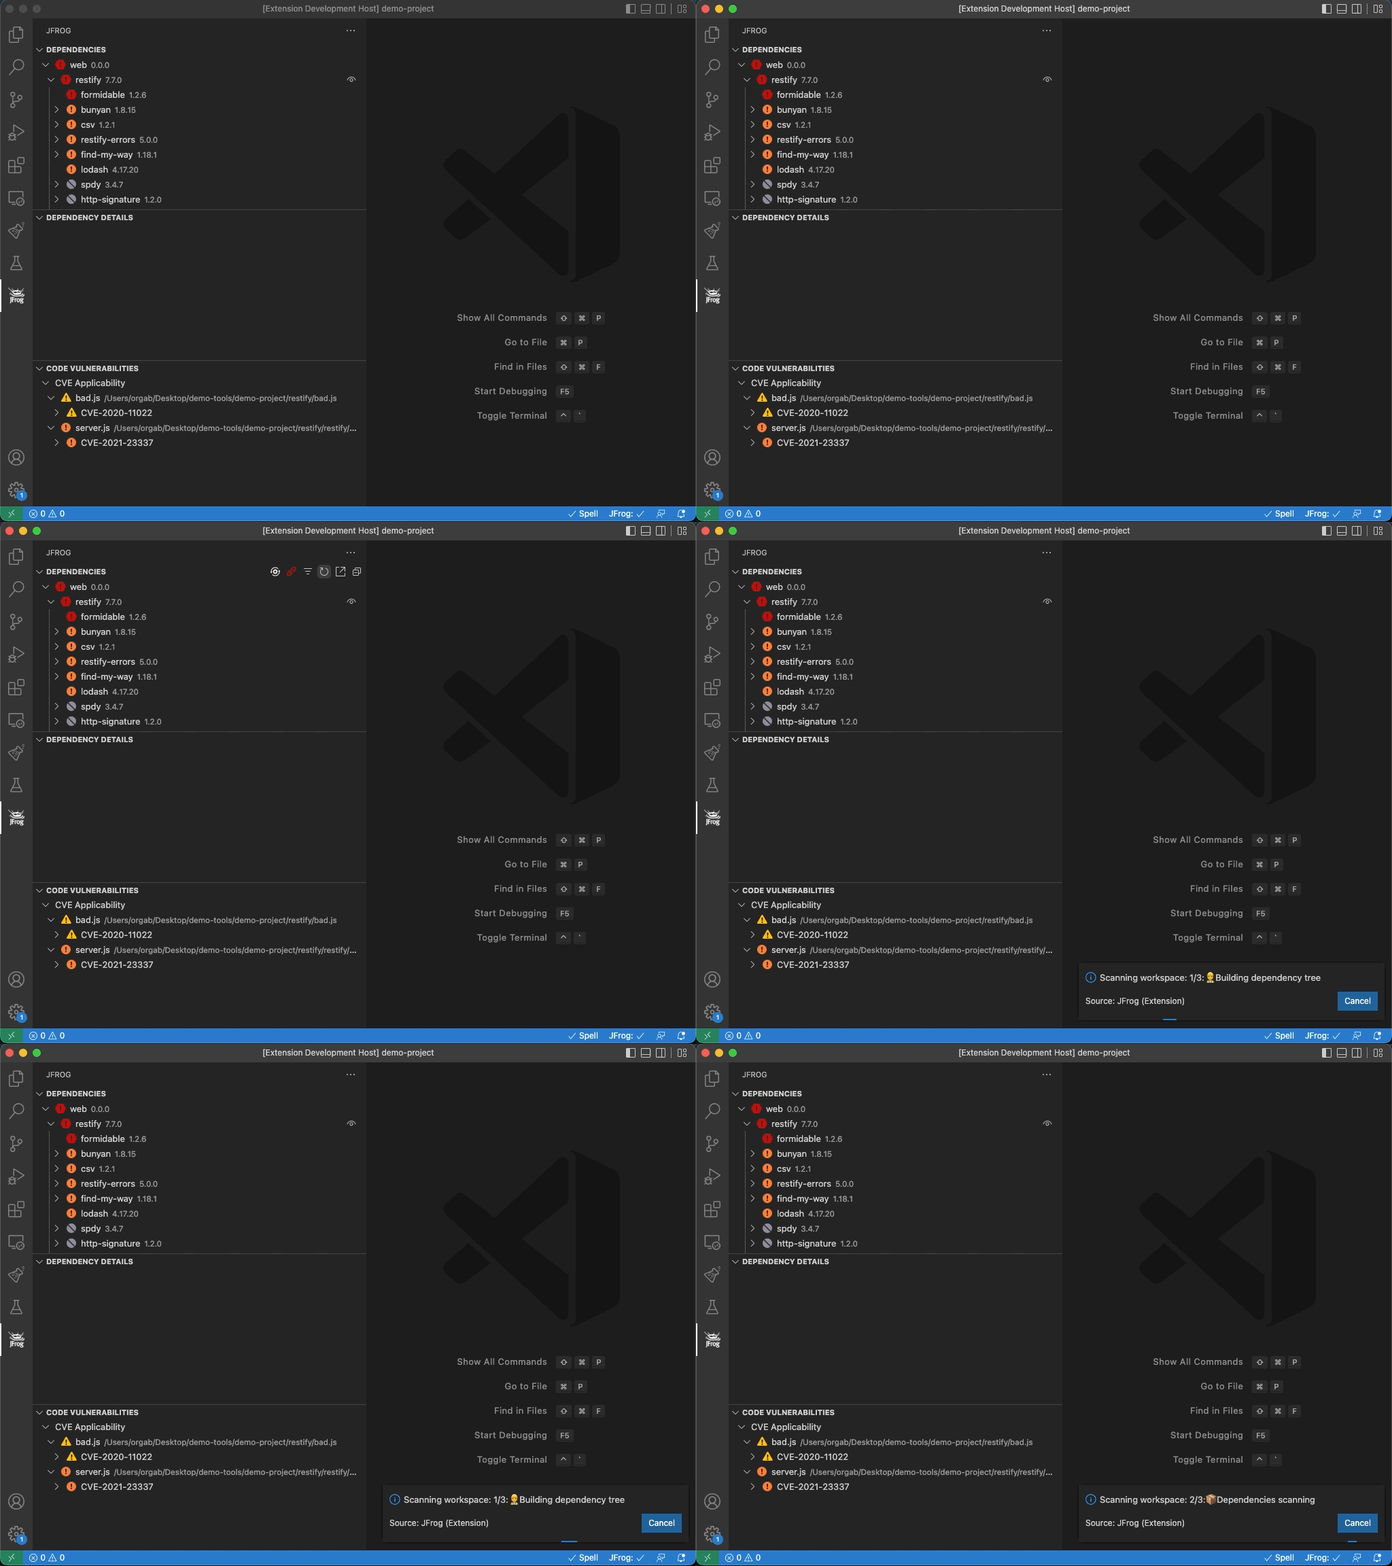
The JFrog extension automatically triggers a scan of the project's dependencies whenever a change is detected after building the code.
To invoke a scan manually, click on the Refresh  button or click on Start Xray Scan from within the editor.
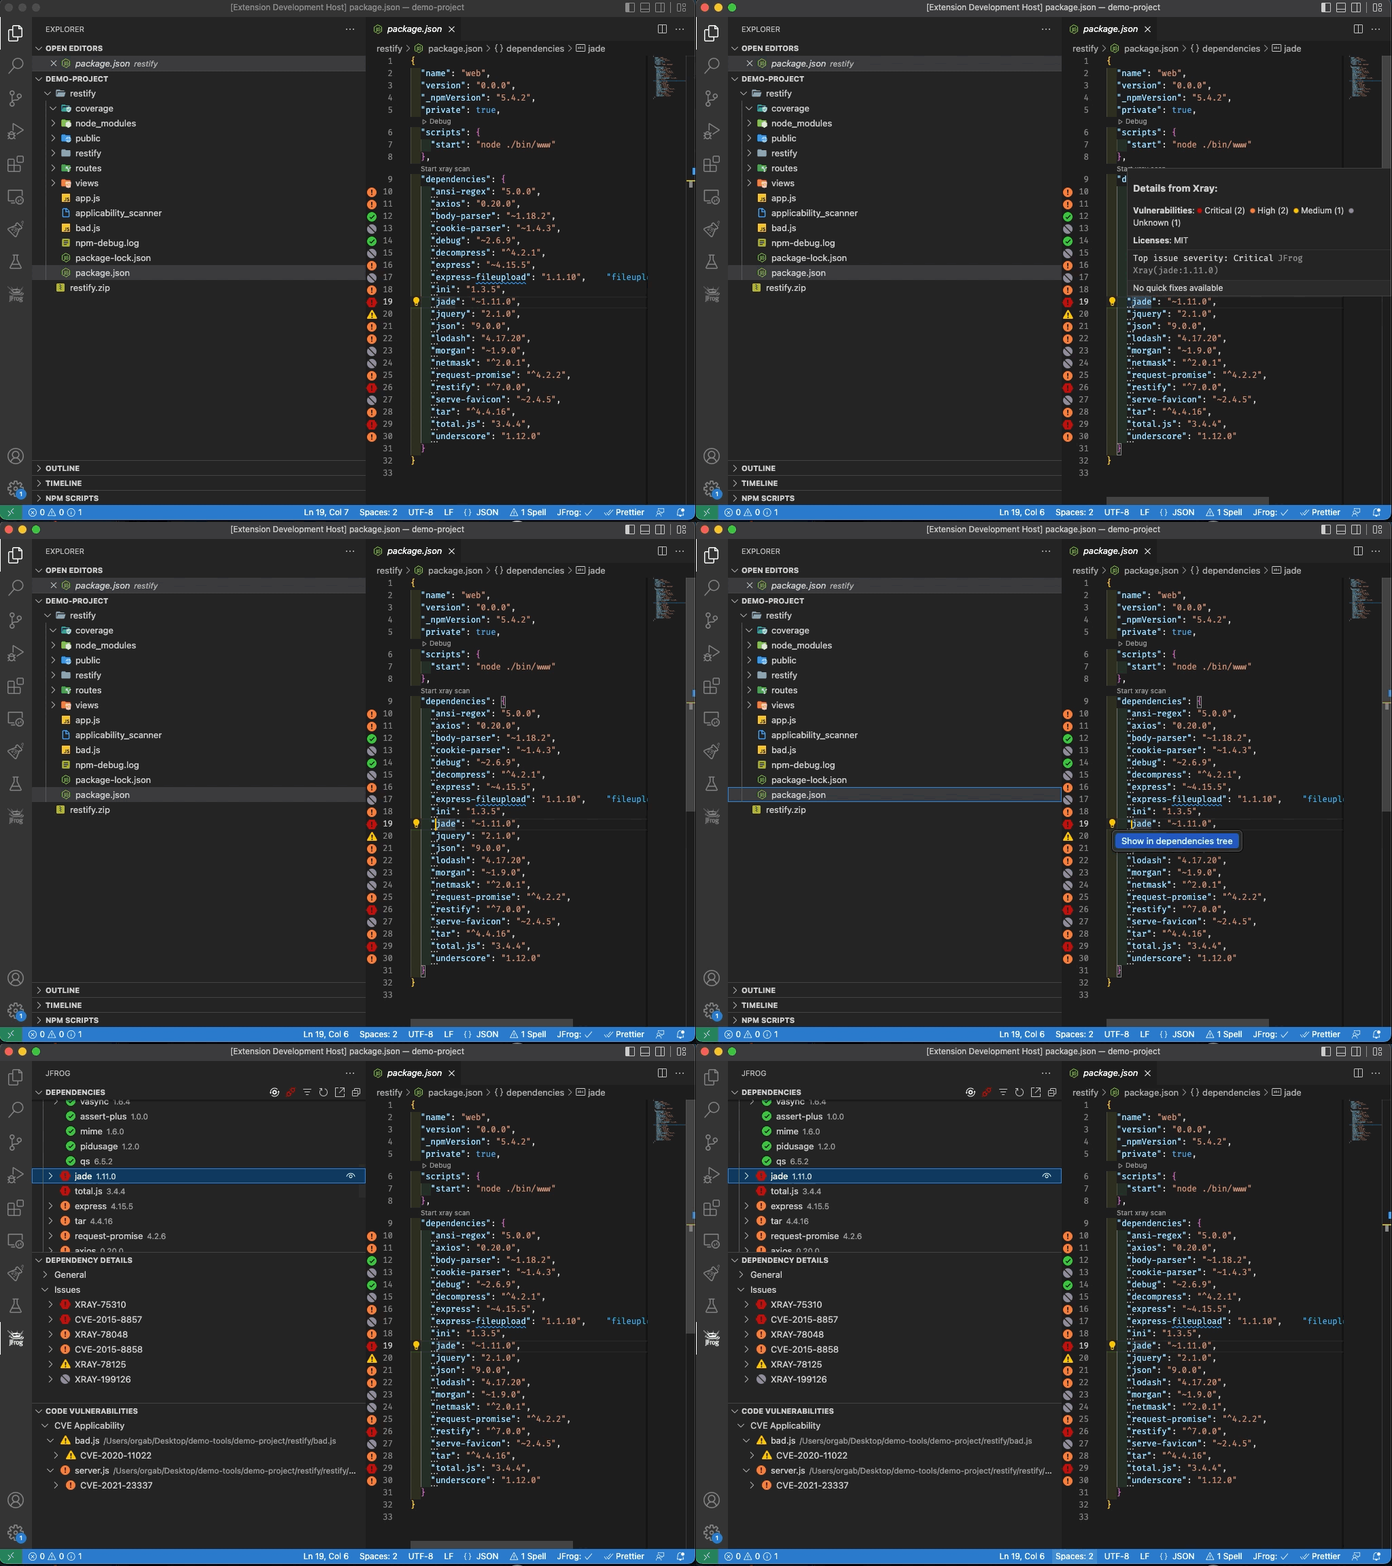
View the security information for a dependency by hovering over it in the editor.
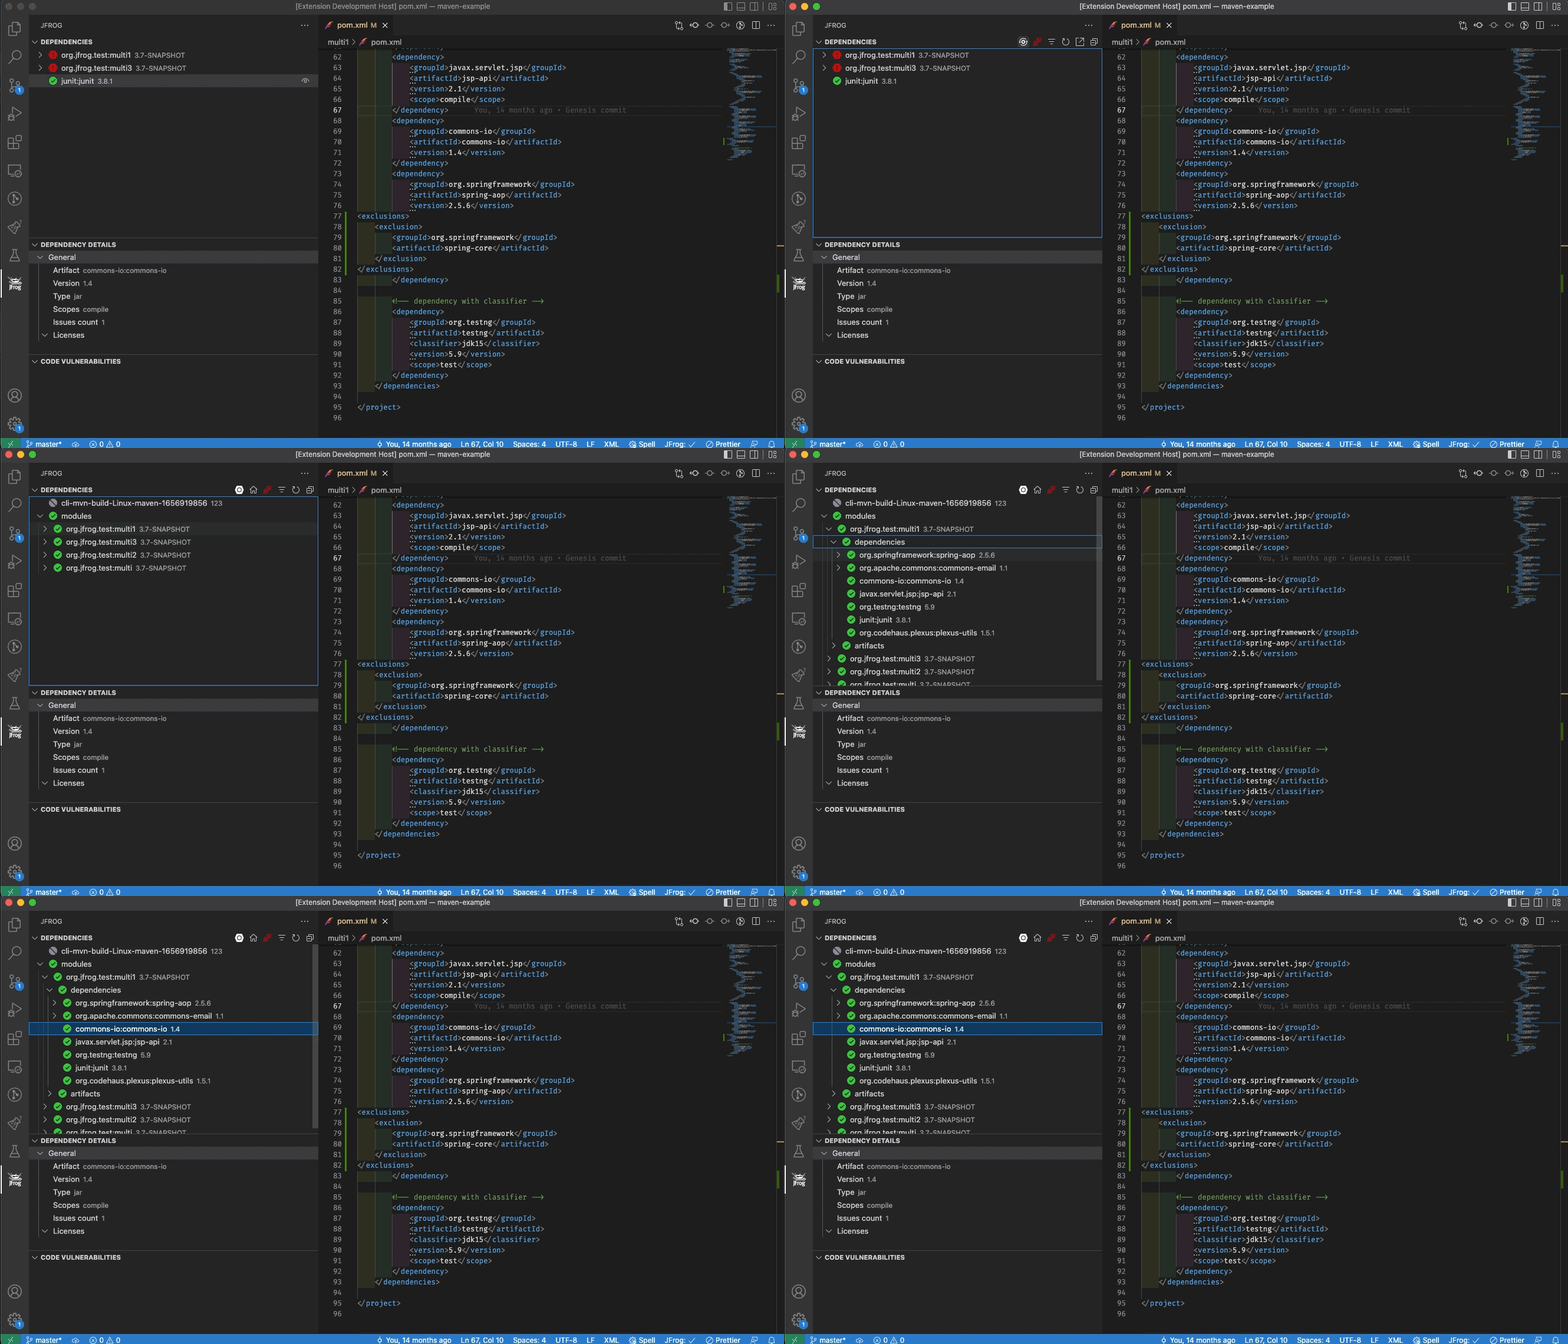
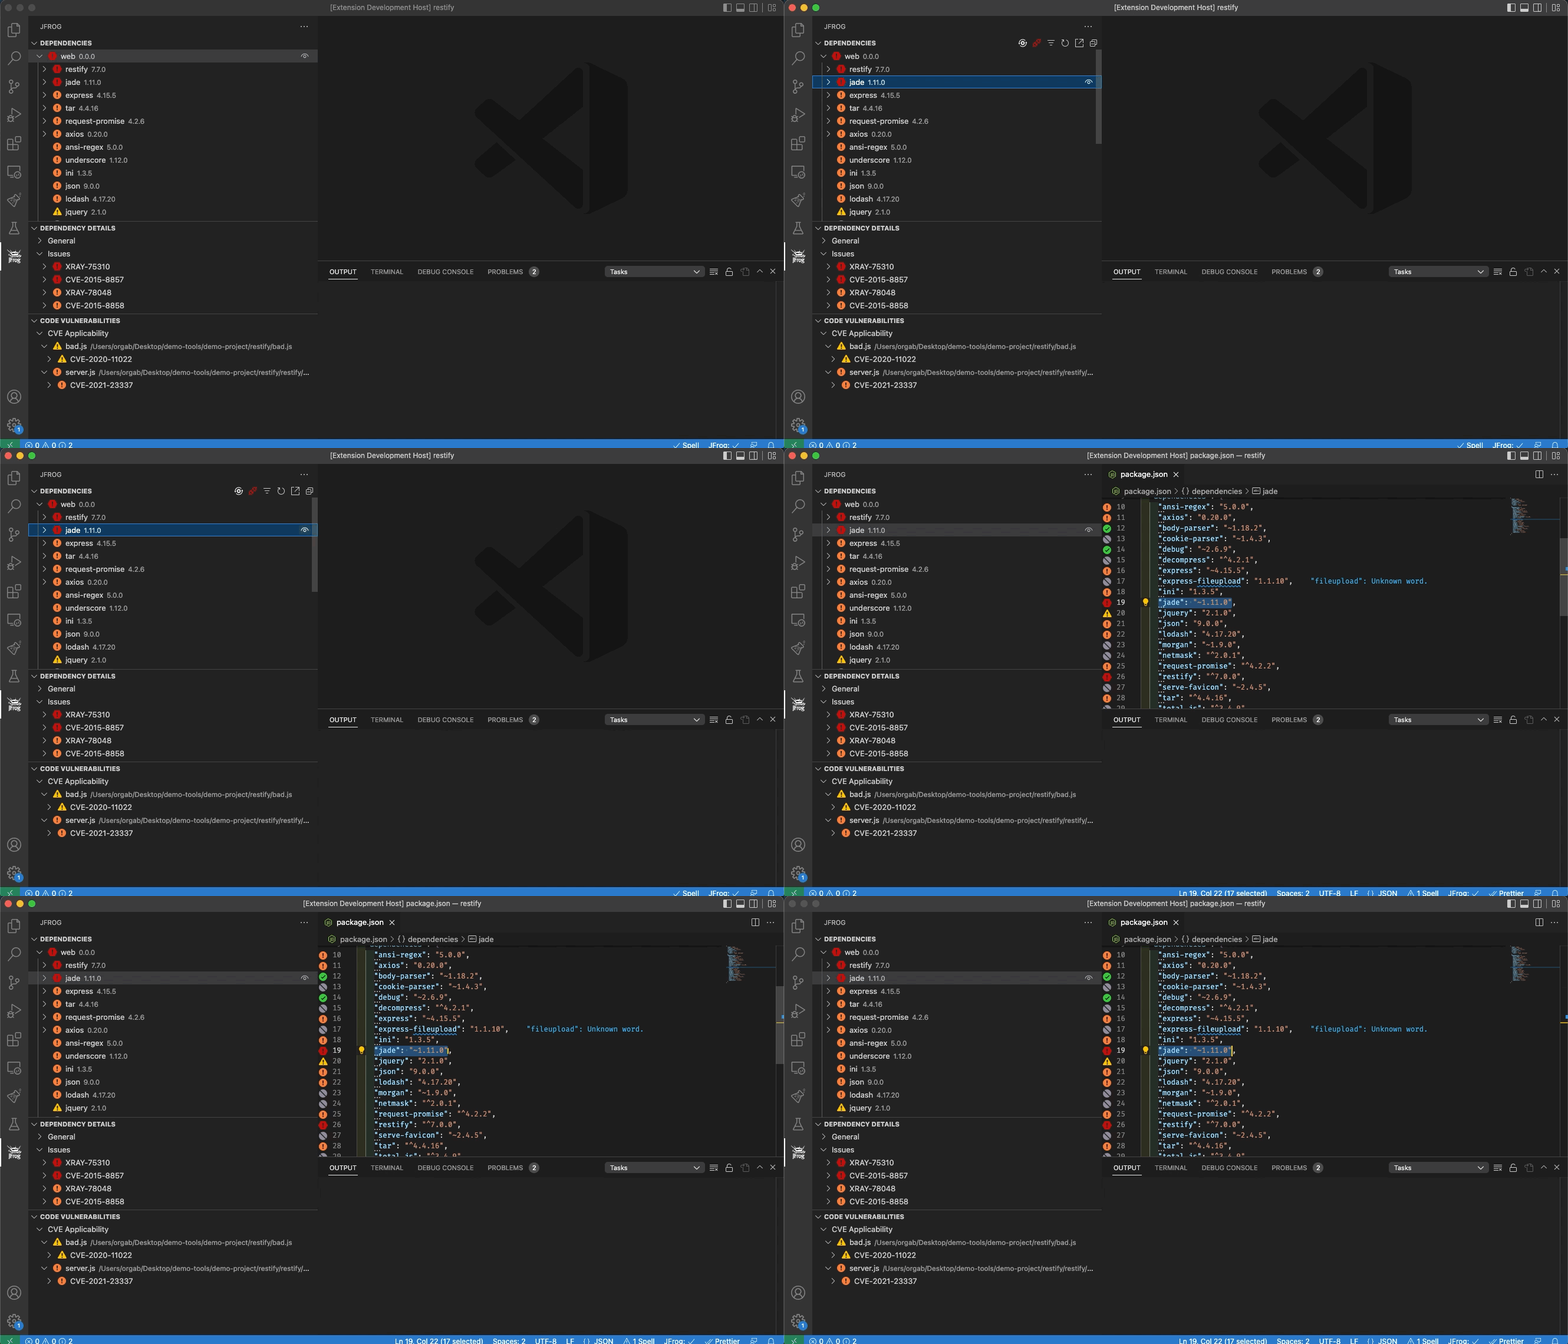
You can also navigate from the dependency declaration directly into the tree view. This allows you to see transitive (indirect) dependencies.
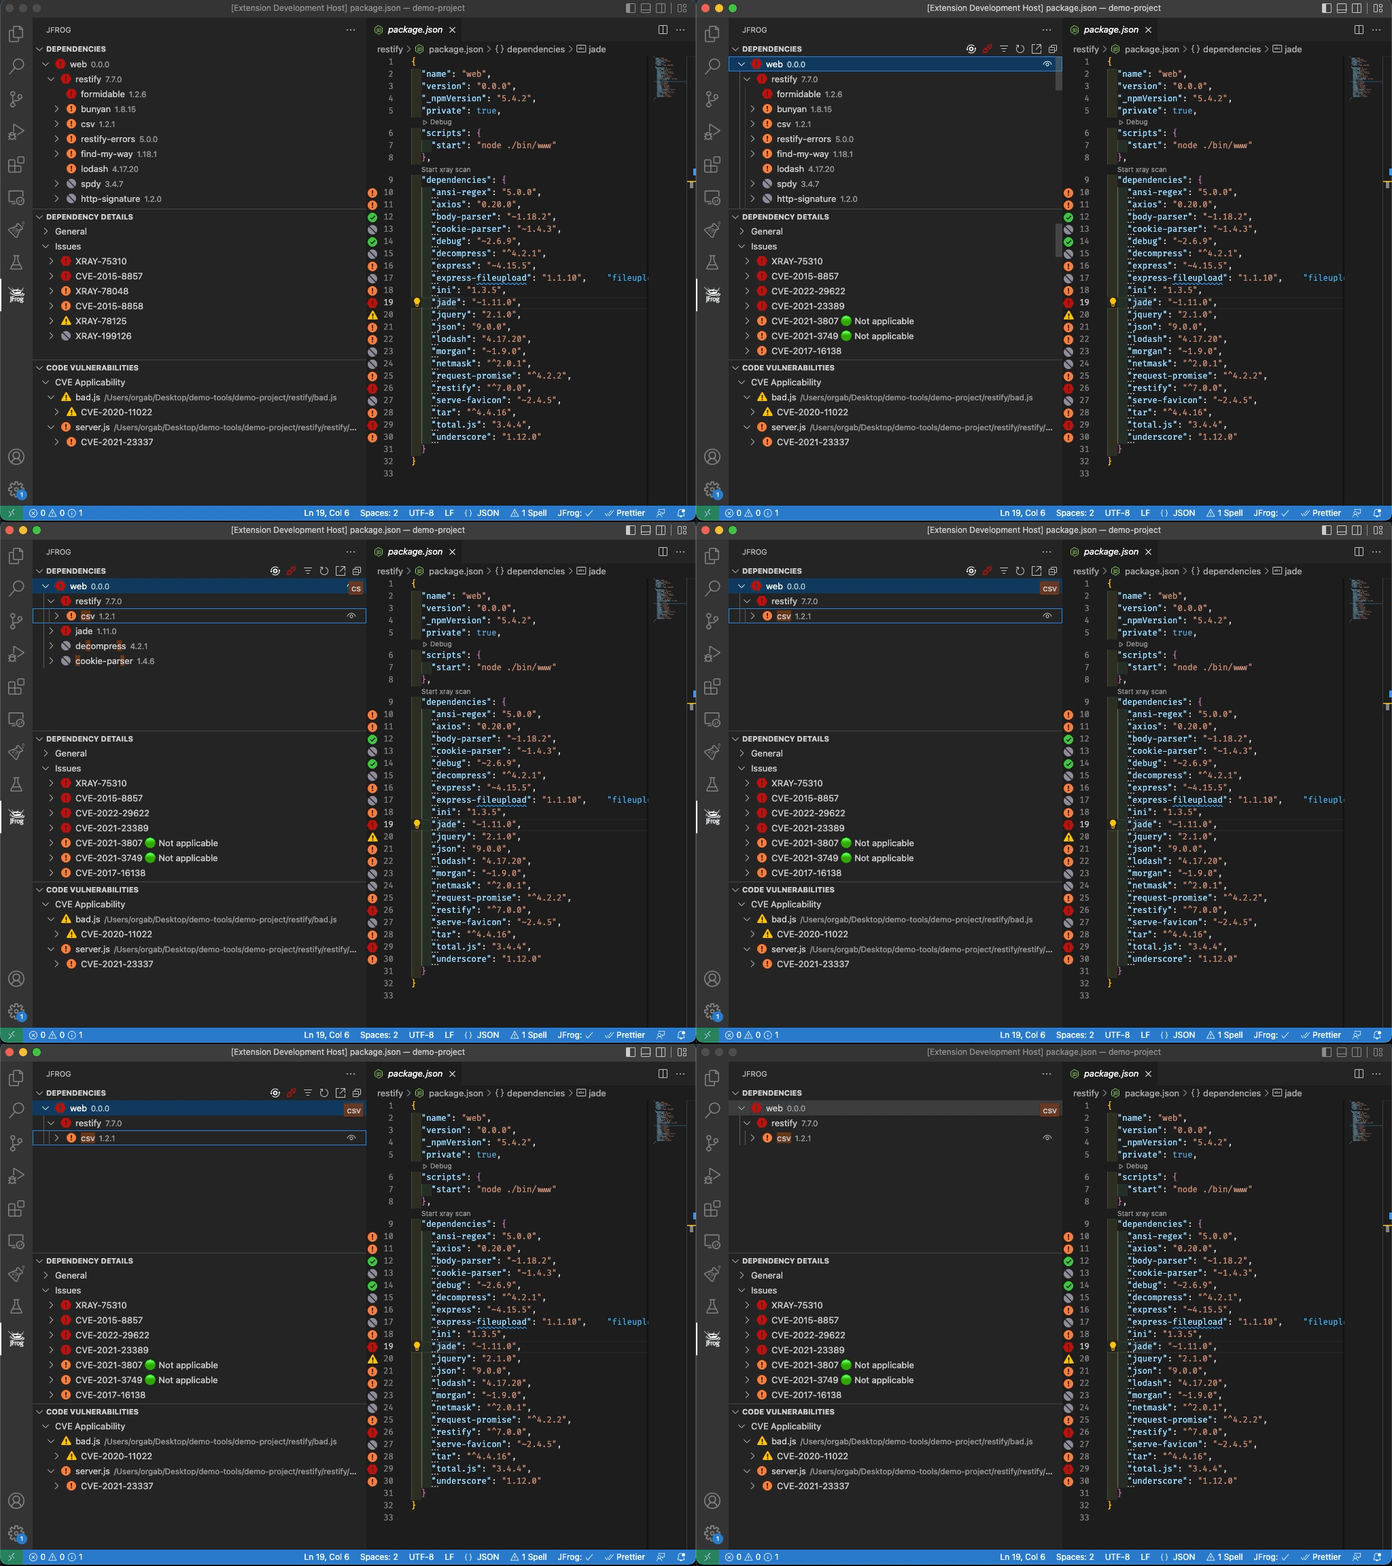
Search for a dependency in the tree:
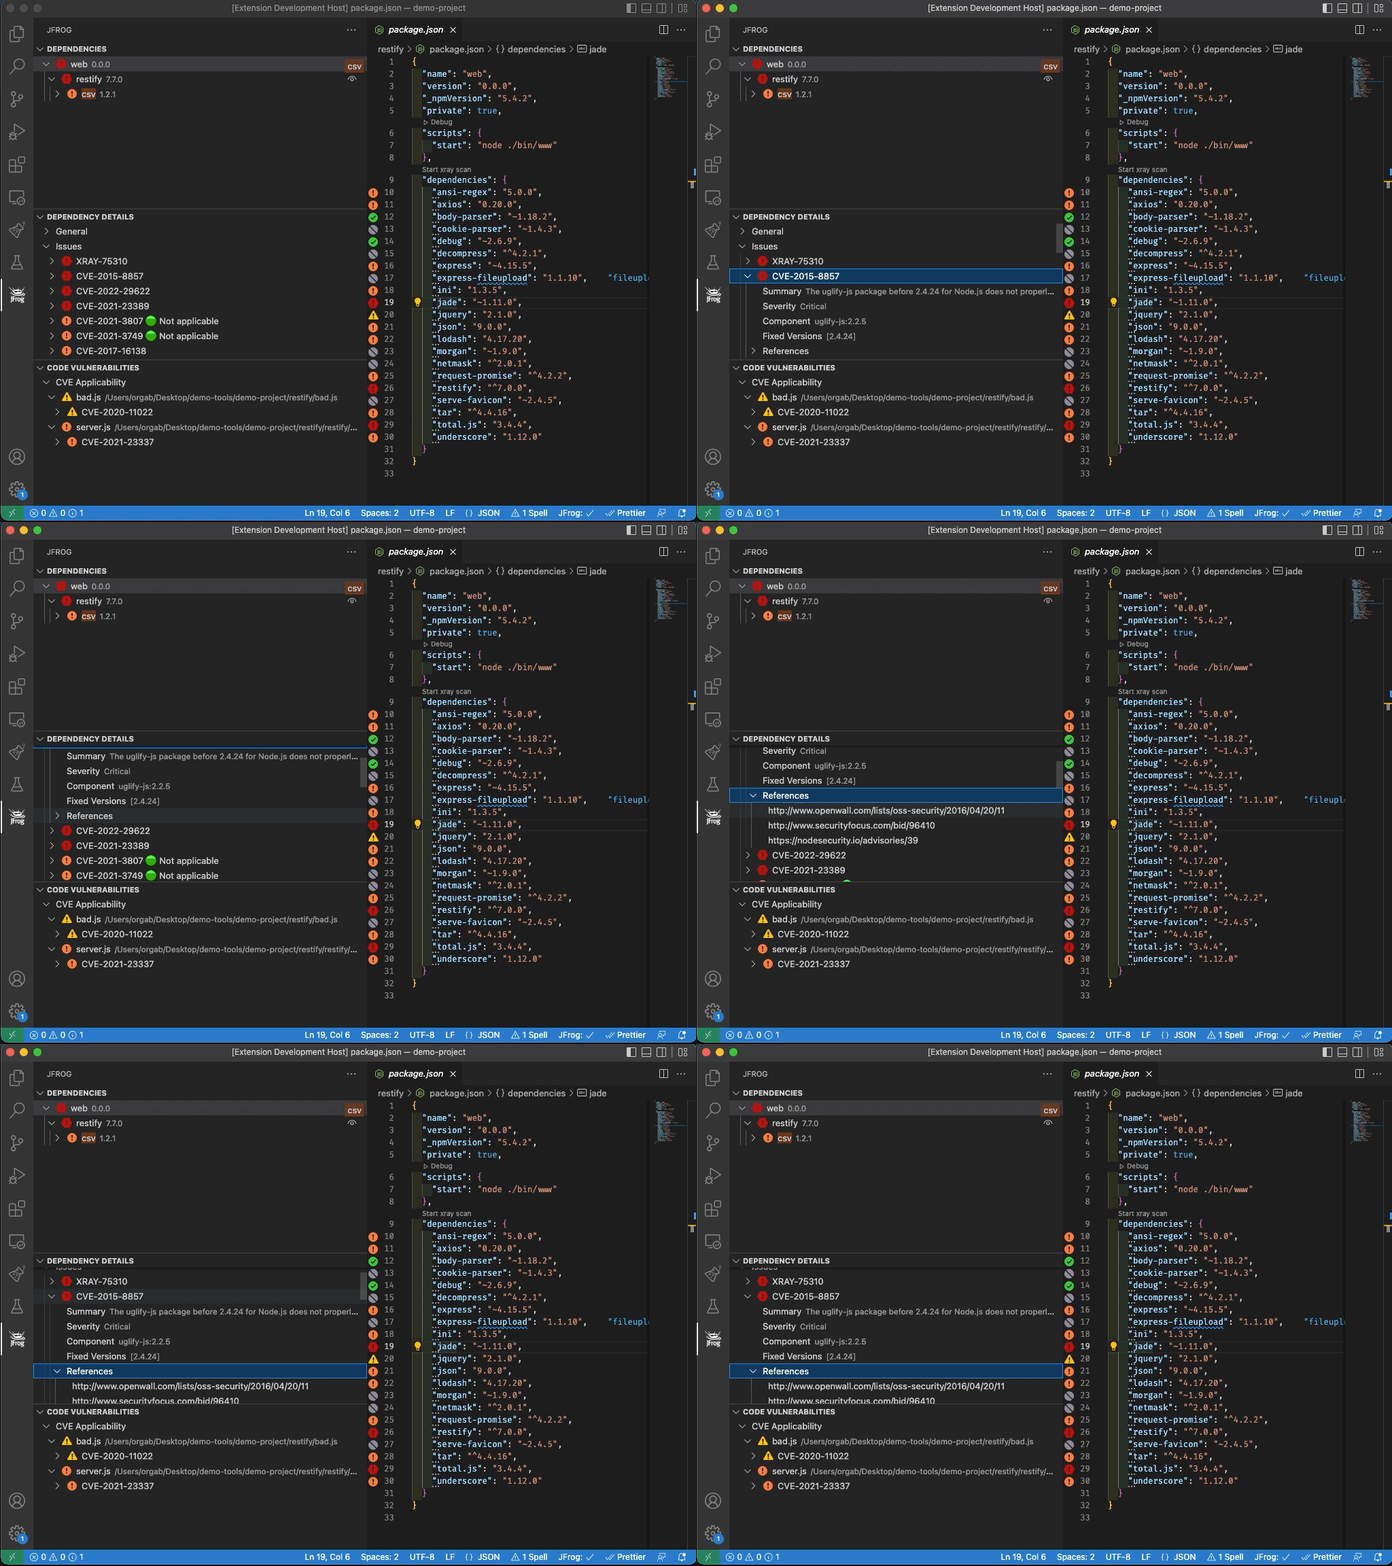
View the issues associated with direct and transitive (indirect) dependencies.
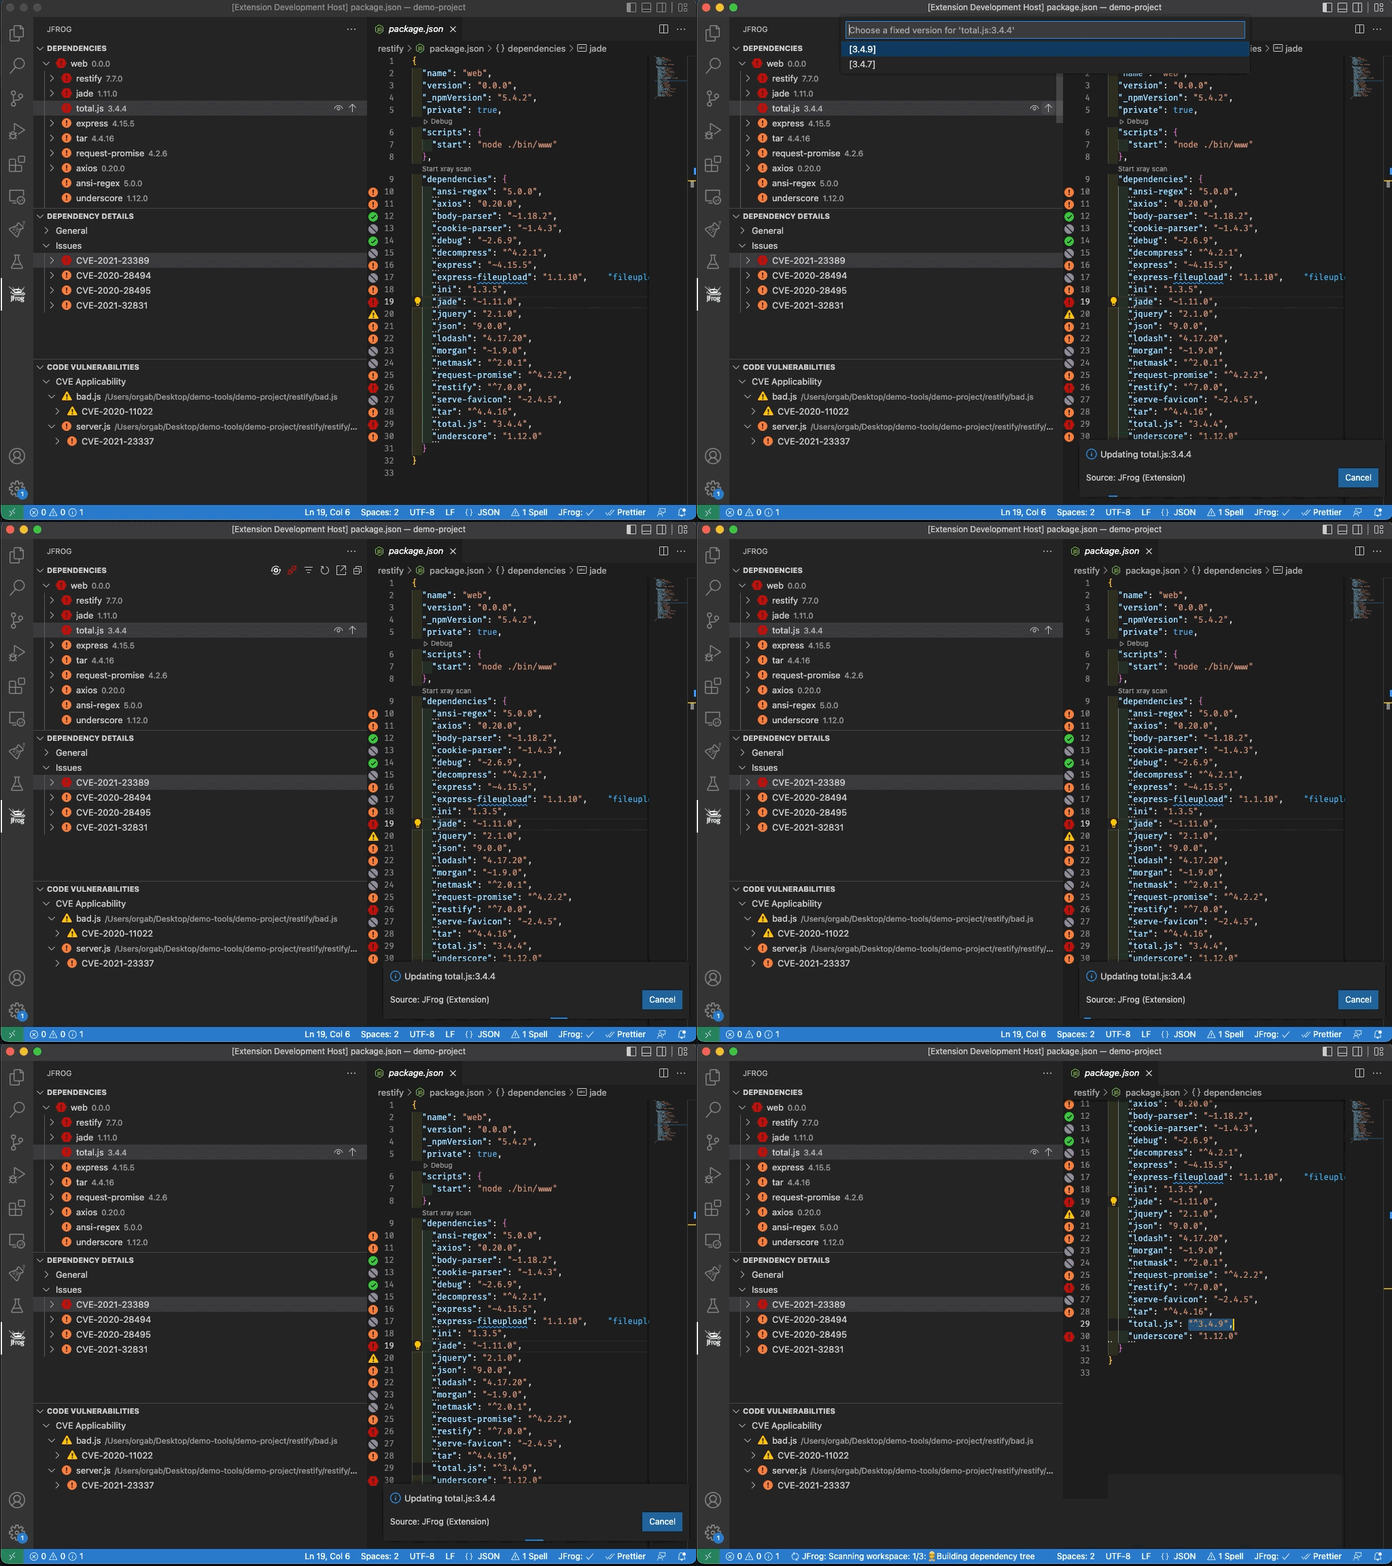
Update a vulnerable dependency to a fixed version:
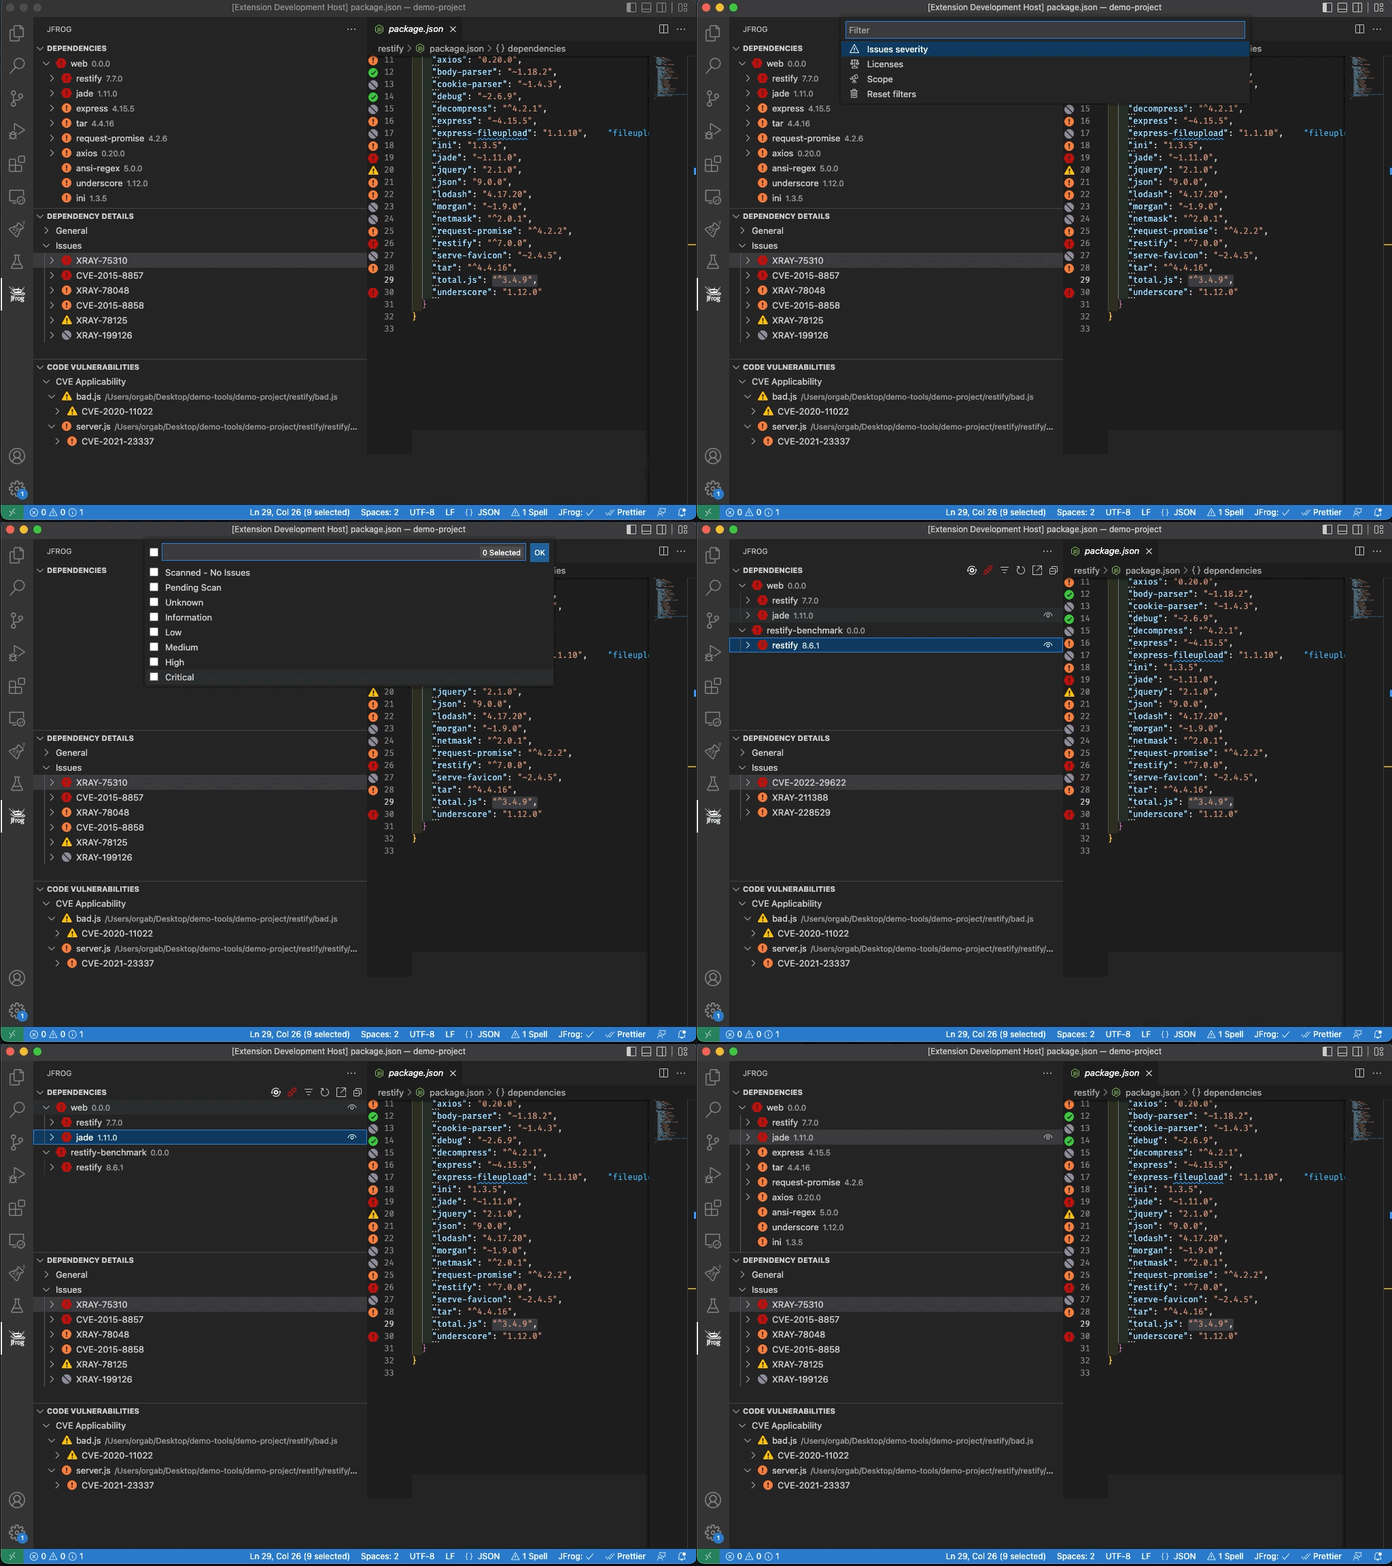
To filter the dependencies viewed, click on the Filter  button.
Navigate from the tree view to a dependency's declaration in the editor.
The JFrog VS-Code extension can trigger an Xray scan after a change in go.sum or package-lock.json. This feature is disabled by default. You can enable it in the Extension Settings.
By default, paths containing the words test, venv and node_modules are excluded from Xray scan.
The exclude pattern can be configured in the Extension Settings.
Behind the scenes, the JFrog VS Code Extension scans all the project dependencies, both direct and indirect (transitive), even if they are not declared in the project's go.mod. It builds the Go dependencies tree by running go mod graph and intersecting the results with go list -f '{{with .Module}}{{.Path}} {{.Version}}{{end}}' all command. Therefore, please make sure to have Go CLI in your system PATH.
To exclude a transitive dependency from your project, click on the "Exclude dependency" button in the dependencies tree.
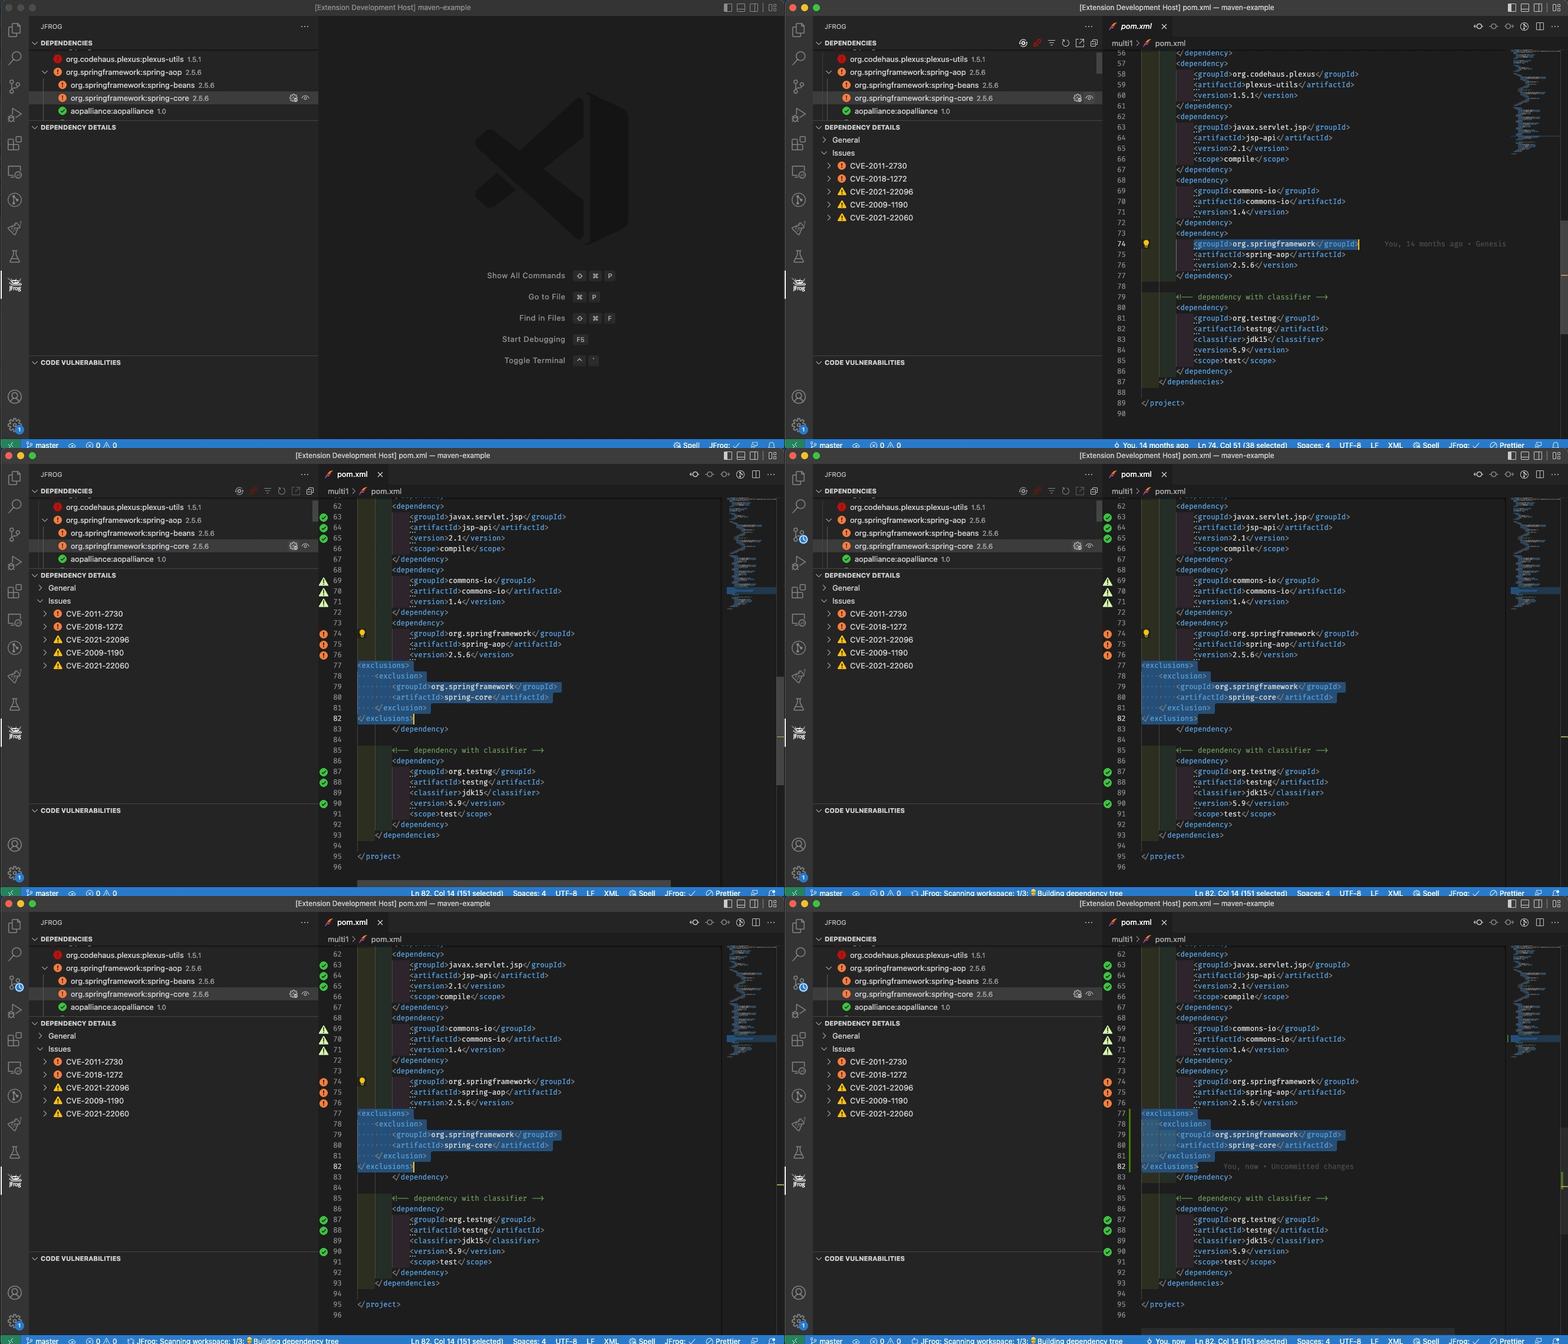
The JFrog VS Code Extension builds the Maven dependencies tree by running mvn dependency:tree. View licenses and top issue severities directly from the pom.xml.
Important notes:
- To have your project dependencies scanned by JFrog Xray, make sure Maven is installed, and that the mvn command is in your system PATH.
- For projects which include the Maven Dependency Plugin as a build plugin, with include or exclude configurations, the scanning functionality is disabled. For example:
      <plugins>
        <plugin>
          <groupId>org.apache.maven.plugins</groupId>
          <artifactId>maven-dependency-plugin</artifactId>
          <configuration>
            <includes>org.apache.*</includes>
          </configuration>
        </plugin>
</plugins>Behind the scenes, the extension builds the npm dependencies tree by running npm list. View licenses and top issue severities directly from the package.json.
Important:
To have your project dependencies scanned by JFrog Xray, make sure the npm CLI is installed on your local machine and that it is in your system PATH.
In addition, the project dependencies must be installed using npm install.
Behind the scenes, the extension builds the Yarn dependencies tree by running yarn list. View licenses and top issue severities directly from the yarn.lock.
Important:
- To have your project dependencies scanned by JFrog Xray, make sure the Yarn CLI is installed on your local machine and that it is in your system PATH.
- Yarn v2 is not yet supported.
Behind the scenes, the extension builds the Pypi dependencies tree by running pipdeptree on your Python virtual environment. It also uses the Python interpreter path configured by the Python extension. View licenses and top issue severities directly from your requirements.txt files. The scan your Pypi dependencies, make sure the following requirements are met:
- The Python extension for VS Code is installed.
- Depending on your project, Please make sure Python 2 or 3 are included in your system PATH.
- Create and activate a virtual env as instructed in VS-Code documentation. Make sure that Virtualenv Python interpreter is selected as instructed here.
- Open a new terminal and activate your Virtualenv:
- On macOS and Linux:
source <venv-dir>/bin/activate

# For example:
source .env/bin/activate
- On Windows:
.\<venv-dir>\Scripts\activate

# For example:
.\env\Scripts\activate
- On macOS and Linux:
- In the same terminal, install your python project and dependencies according to your project specifications.
For .NET projects which use NuGet packages as dependencies, the extension displays the NuGet dependencies tree, together with the information for each dependency. Behind the scenes, the extension builds the NuGet dependencies tree using the NuGet deps tree npm package.
Important:
- Does your project define its NuGet dependencies using a packages.config file? If so, then please make sure the
nugetCLI is installed on your local machine and that it is in your system PATH. The extension uses thenugetCLI to find the location of the NuGet packages on the local file-system. - The project must be restored using
nuget restoreordotnet restoreprior to scanning. After this action, you should click on the Refresh button, for the tree view to be refreshed and updated.
The CI view of the extension allows you to view information about your builds directly from your CI system. This allows developers to keep track of the status of their code, while it is being built, tested and scanned as part of the CI pipeline, regardless of the CI provider used.
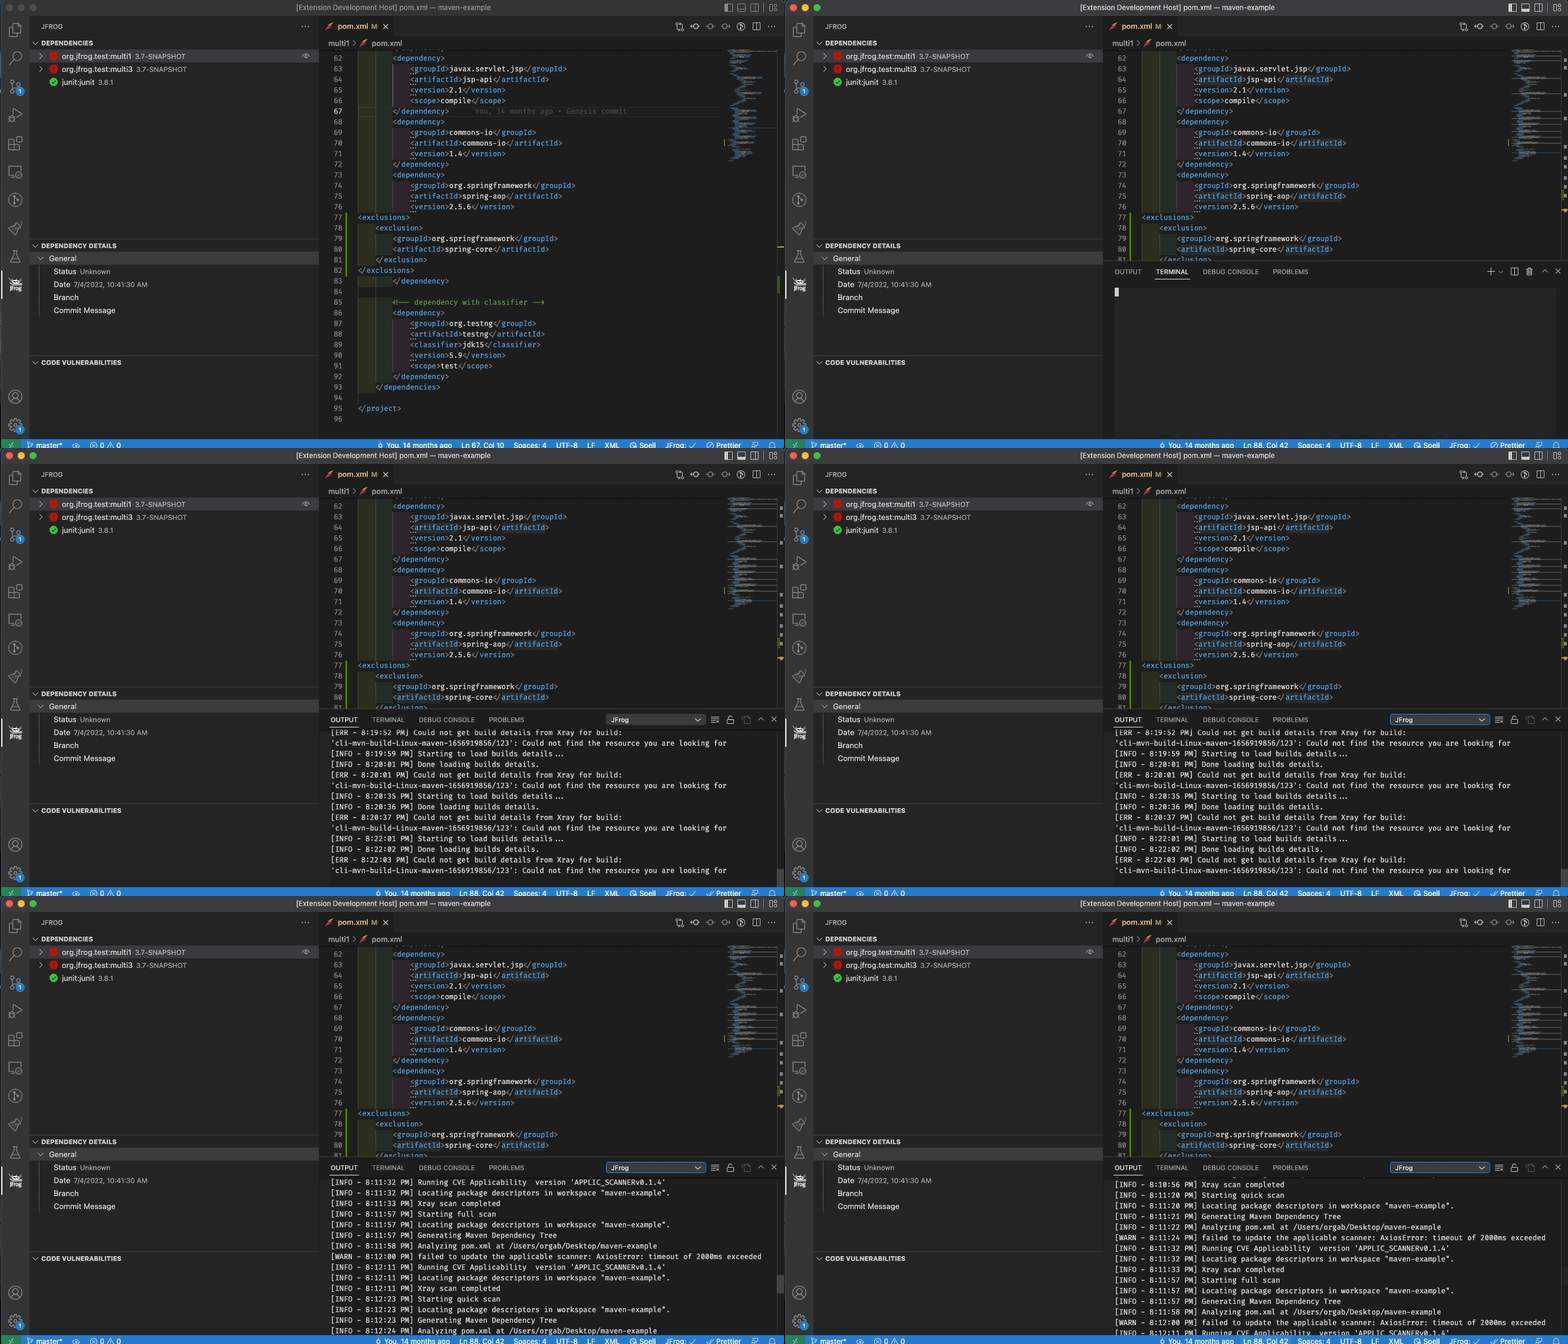
This information can be viewed inside JFrog VS Code Extension, from the JFrog Panel, after switching to CI mode.
The following details can be made available in the CI view.
- Status of the build run (passed or failed)
- Build run start time
- Git branch and latest commit message
- Link to the CI run log
- Security information about the build artifacts and dependencies
The CI information displayed in VS Code is pulled by the JFrog Extension directly from JFrog Artifactory. This information is stored in Artifactory as part of the build-info, which is published to Artifactory by the CI server.
Read more about build-info in the Build Integration documentation page. If the CI pipeline is also configured to scan the build-info by JFrog Xray, the JFrog VS Code Extension will pull the results of the scan from JFrog Xray and display them in the CI view as well.
Before VS Code can display information from your CI in the CI View, your CI pipeline needs to be configured to expose this data. Read this guide which describes how to configure your CI pipeline.
Set your CI build name in the Build name pattern field at the Extension Settings. This is the name of the build published to Artifactory by your CI pipeline. You have the option of setting * to view all the builds published to Artifactory.
After your builds were fetched from Artifactory, press on the Builds  button to choose what build to display.
Change the log level to 'debug', 'info', 'warn', or 'err' in the Extension Settings.
The extension is licensed under Apache License 2.0.
- npm 7 and above
- JFrog CLI's
jfexecutable - required for tests
To build the extension from sources, please follow these steps:
- Clone the code from Github.
- Update submodules:
git submodule init
git submodule update- Build and create the VS-Code extension vsix file by running the following npm command:
npm i
npm run package
After the build finishes, you'll find the vsix file in the jfrog-vscode-extension directory. The vsix file can be loaded into VS-Code
To run the tests:
npm tWe welcome community contribution through pull requests.
- Before creating your first pull request, please join our contributors community by signing JFrog's CLA.
- If the existing tests do not already cover your changes, please add tests.
- Pull requests should be created on the dev branch.
- Please run
npm run formatfor formatting the code before submitting the pull request.


