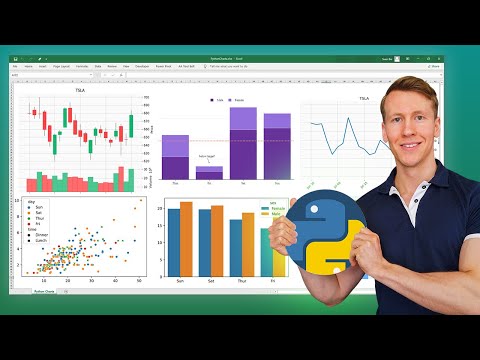
If you are an Excel user then you might have encountered the limitations to do some really cool stuffs that require Python. But no need to worry, now with xlwings, you can run Python code in Excel without any difficulty at all. In this video, I'm going to show you how to easily insert Python charts into Excel and generate professional data visualizations for your work using xlwings.
I've developed some handy Excel add-ins that you might find useful:
- 📊 Dashboard Add-in: Easily create interactive and visually appealing dashboards.
- 🎨 Cartoon Charts Add-In: Create engaging and fun cartoon-style charts.
- 🤪 Emoji Add-in: Add a touch of fun to your spreadsheets with emojis.
- 🛠️ MyToolBelt Add-in: A versatile toolbelt for Excel, featuring:
- Creation of Pandas DataFrames and Jupyter Notebooks from Excel ranges
- ChatGPT integration for advanced data analysis
- And much more!
- 📺 YouTube: CodingIsFun
- 🌐 Website: PythonAndVBA
- 💬 Discord: Join the Community
- 💼 LinkedIn: Sven Bosau
- 📸 Instagram: sven_bosau
If you appreciate the project and wish to encourage its continued development, consider supporting my work.

For feedback, suggestions, or potential collaboration opportunities, reach out at contact@pythonandvba.com.