Developed by Austin Peavy - https://github.com/aus10pv
Released as open source by NCC Group Plc - https://www.nccgroup.com/
Released under the Apache 2.0 license (see LICENSE for more information)
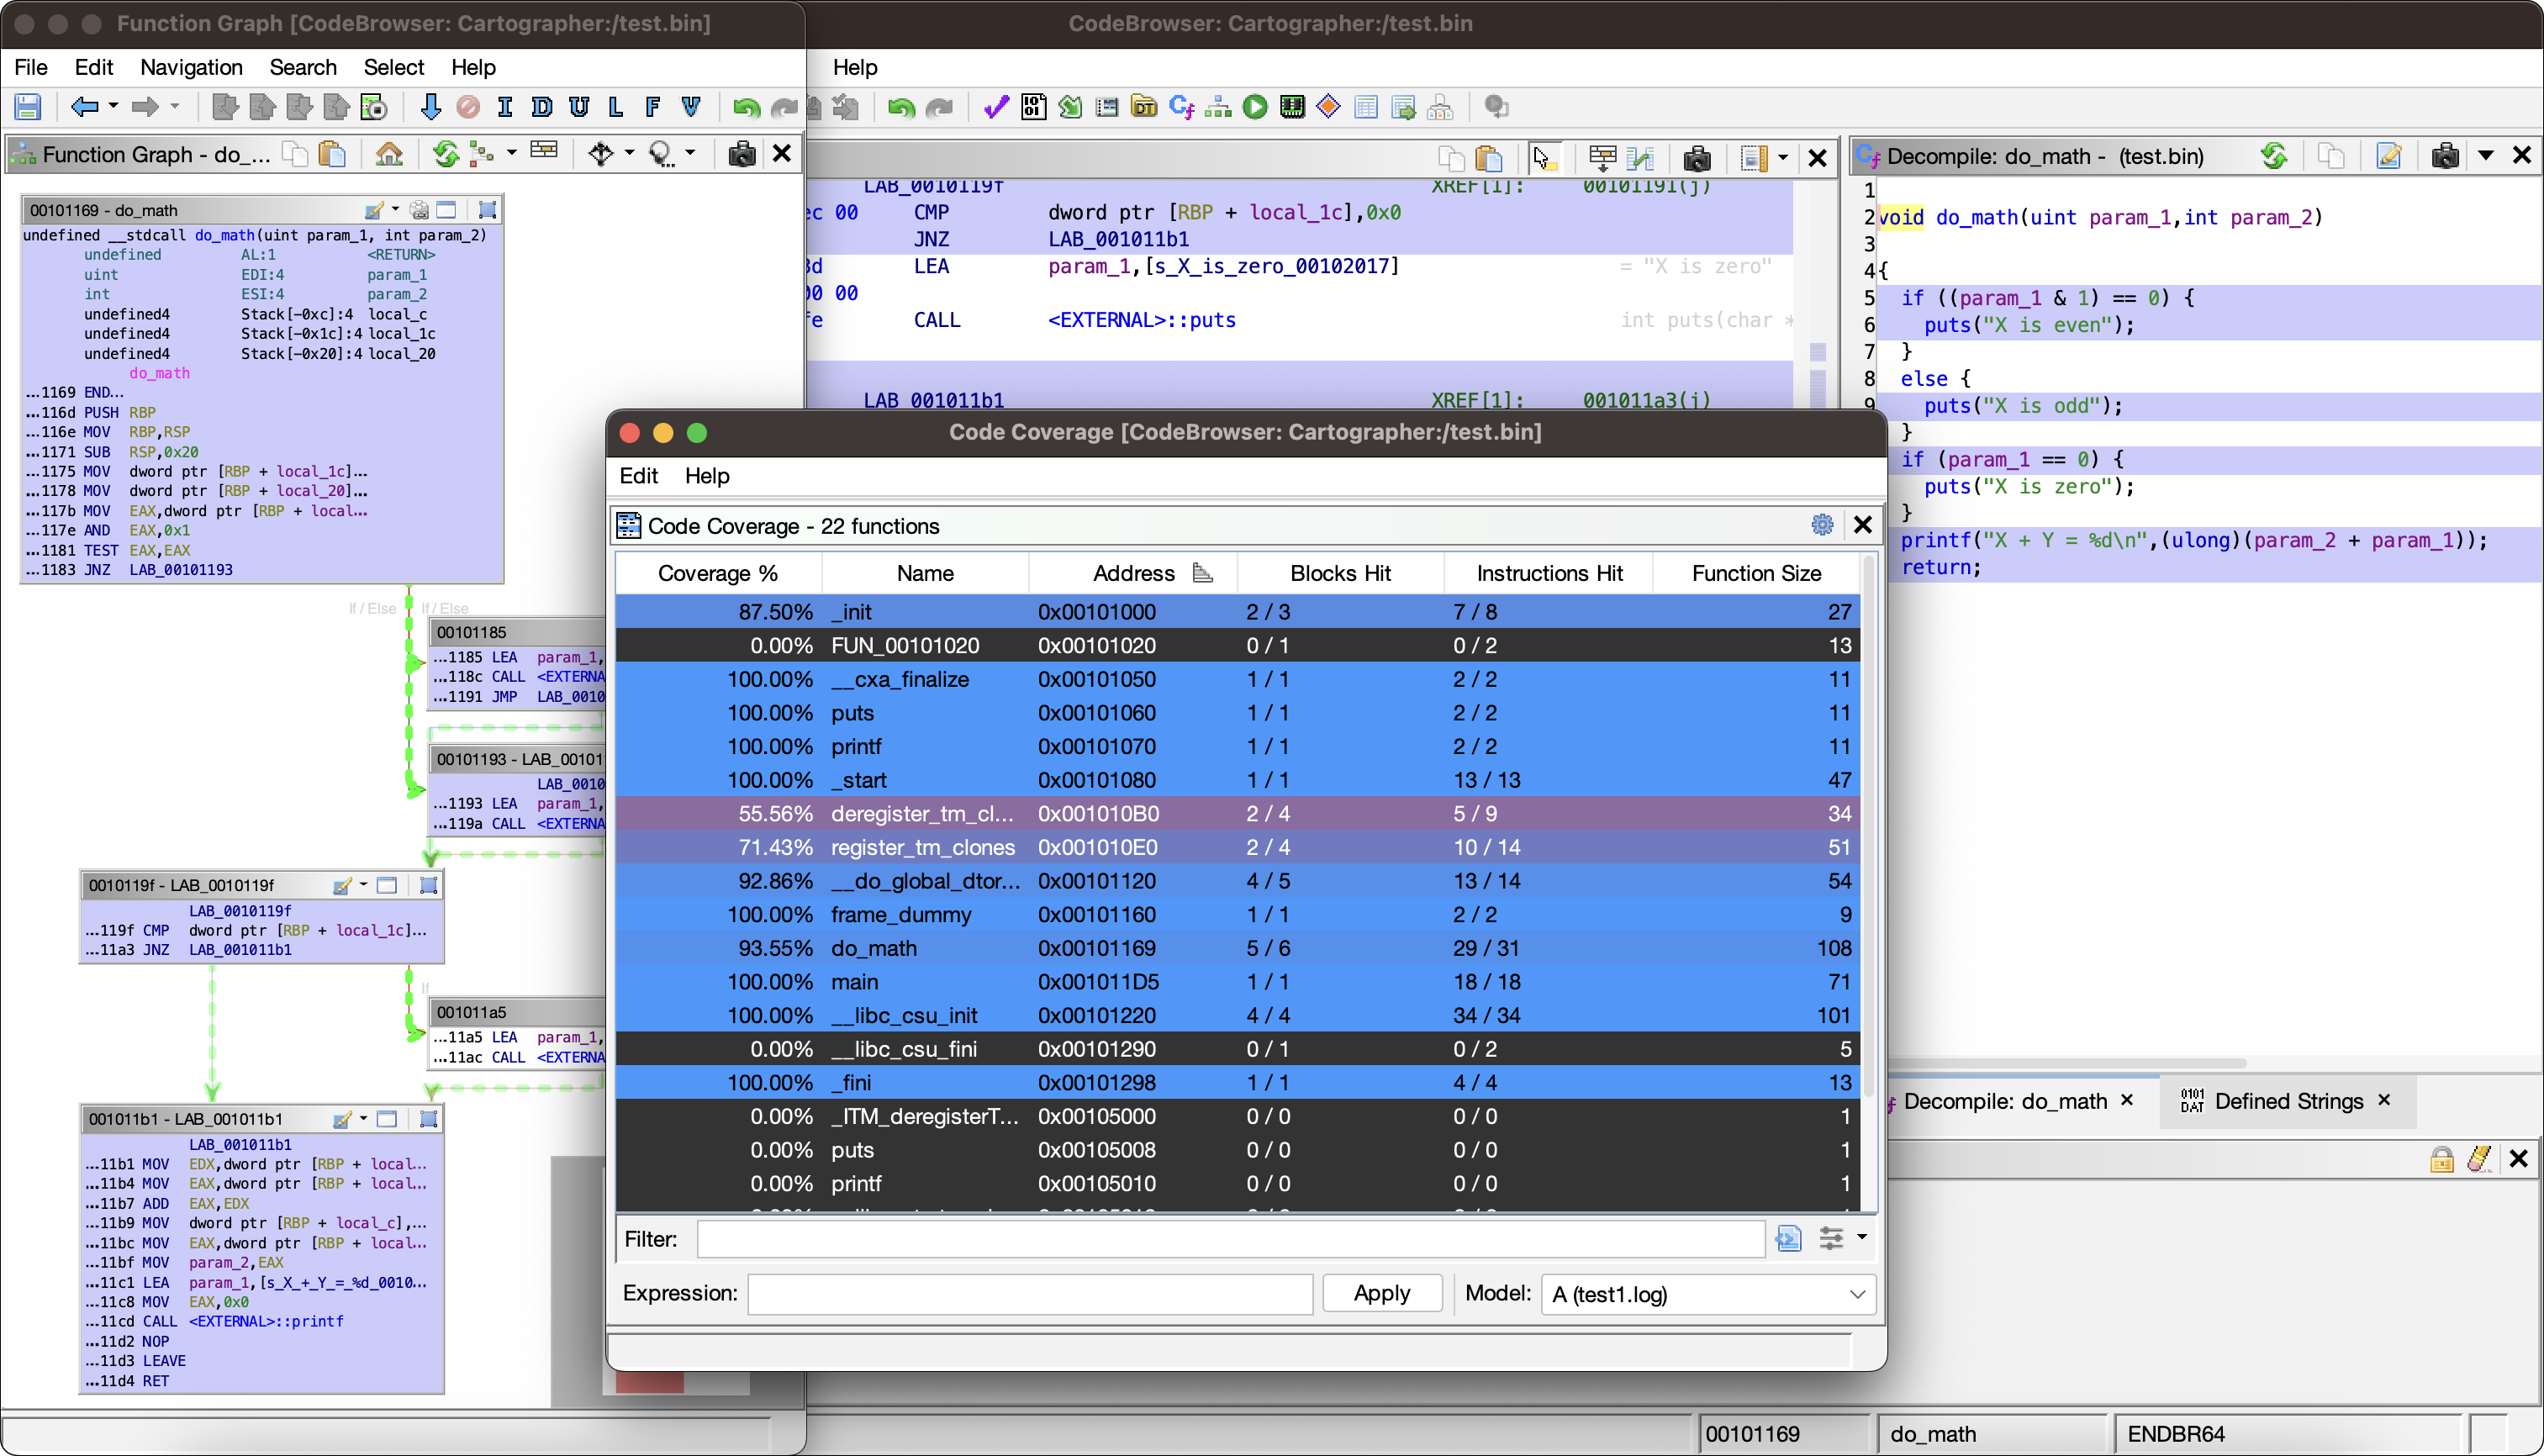
Cartographer is a code coverage mapping plugin for Ghidra, enabling researchers to observe which parts of a program have been executed without requiring source code.
- Colorizes executed code
- Function Graph
- Disassembly (Listing) View
- Decompiler View
- Fully customizable colors
- Supports Ghidra themes
- Loads DRCOV files and custom EZCOV files
- See EZCOV.md for details on the EZCOV format
- Provides a detailed overview of function coverage
- Includes heat map showing how much of each function was executed
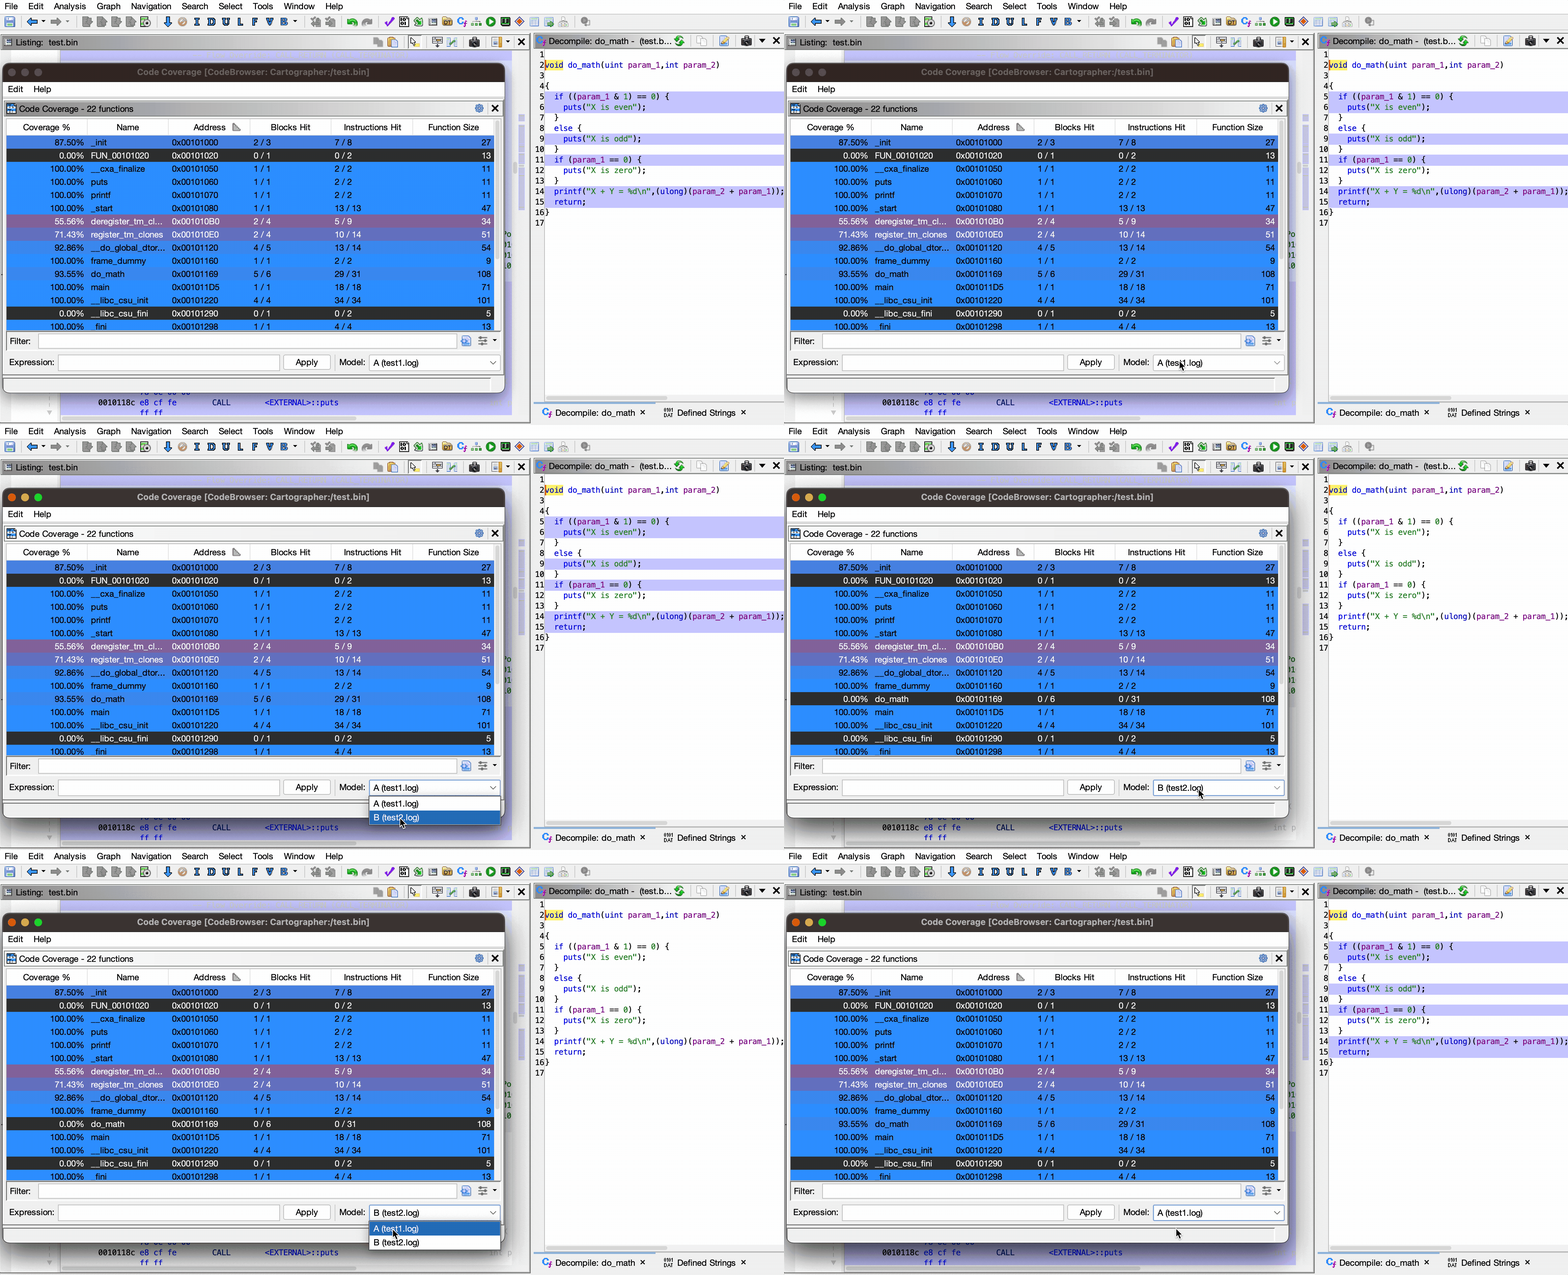
- Easily swap between loaded coverage files
- Search for functions by name
- Filter results by coverage amount and more
- Powerful expression parser
- Perform logical operations on multiple loaded coverages
- Supports coverage in different address spaces
The latest stable version of Cartographer can be downloaded from the Releases page.
- Launch Ghidra.
- Navigate to the Install Extensions window.
File->Install Extensions...
- Click the green "+" icon at the top-right corner.
- Select the downloaded ZIP file to load the plugin into Ghidra.
- Click the "OK" button to exit the Install Extensions window.
- Restart Ghidra when prompted.
Once the plugin is loaded, there will be additional controls in the CodeBrowser window for working with code coverage data.
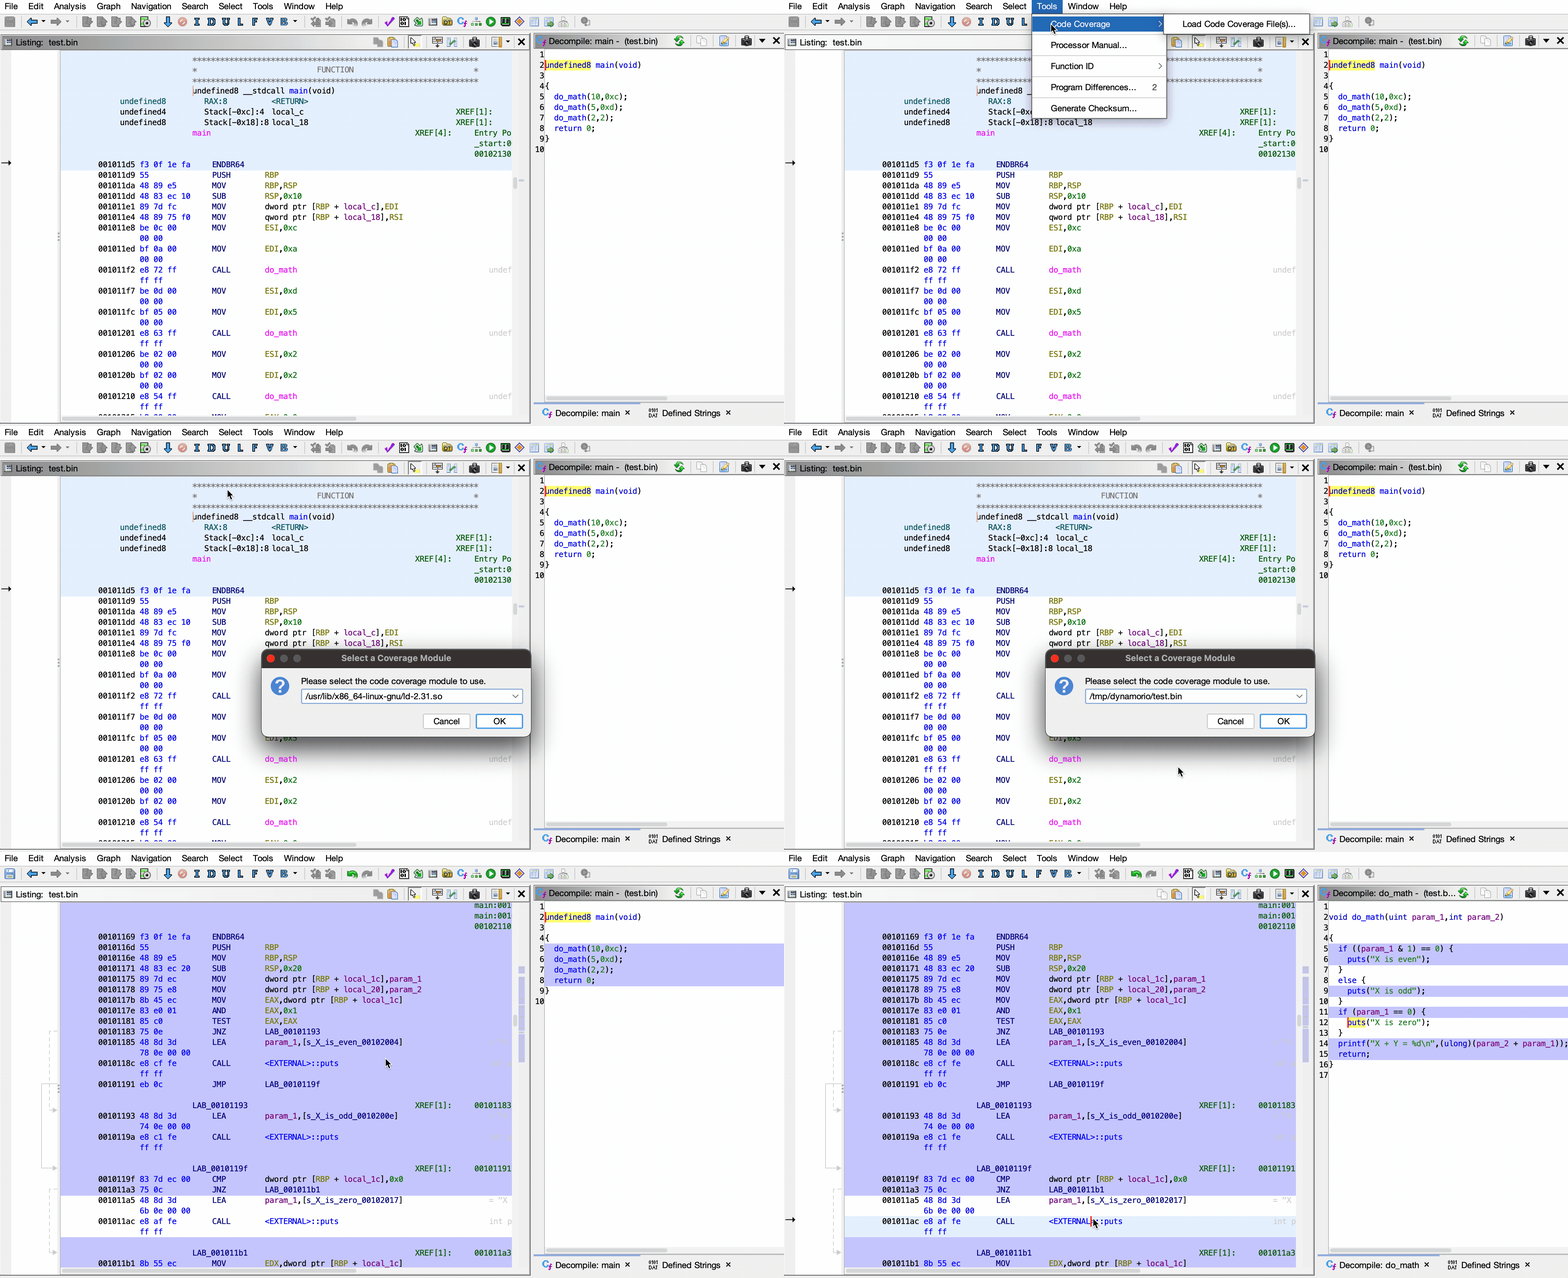
Code coverage files can be loaded via the Tools menu: Tools -> Code Coverage -> Load Code Coverage File(s)...
When a code coverage file is loaded, all of the coverage data is immediately highlighted in the Listing view and the Decompiler view.
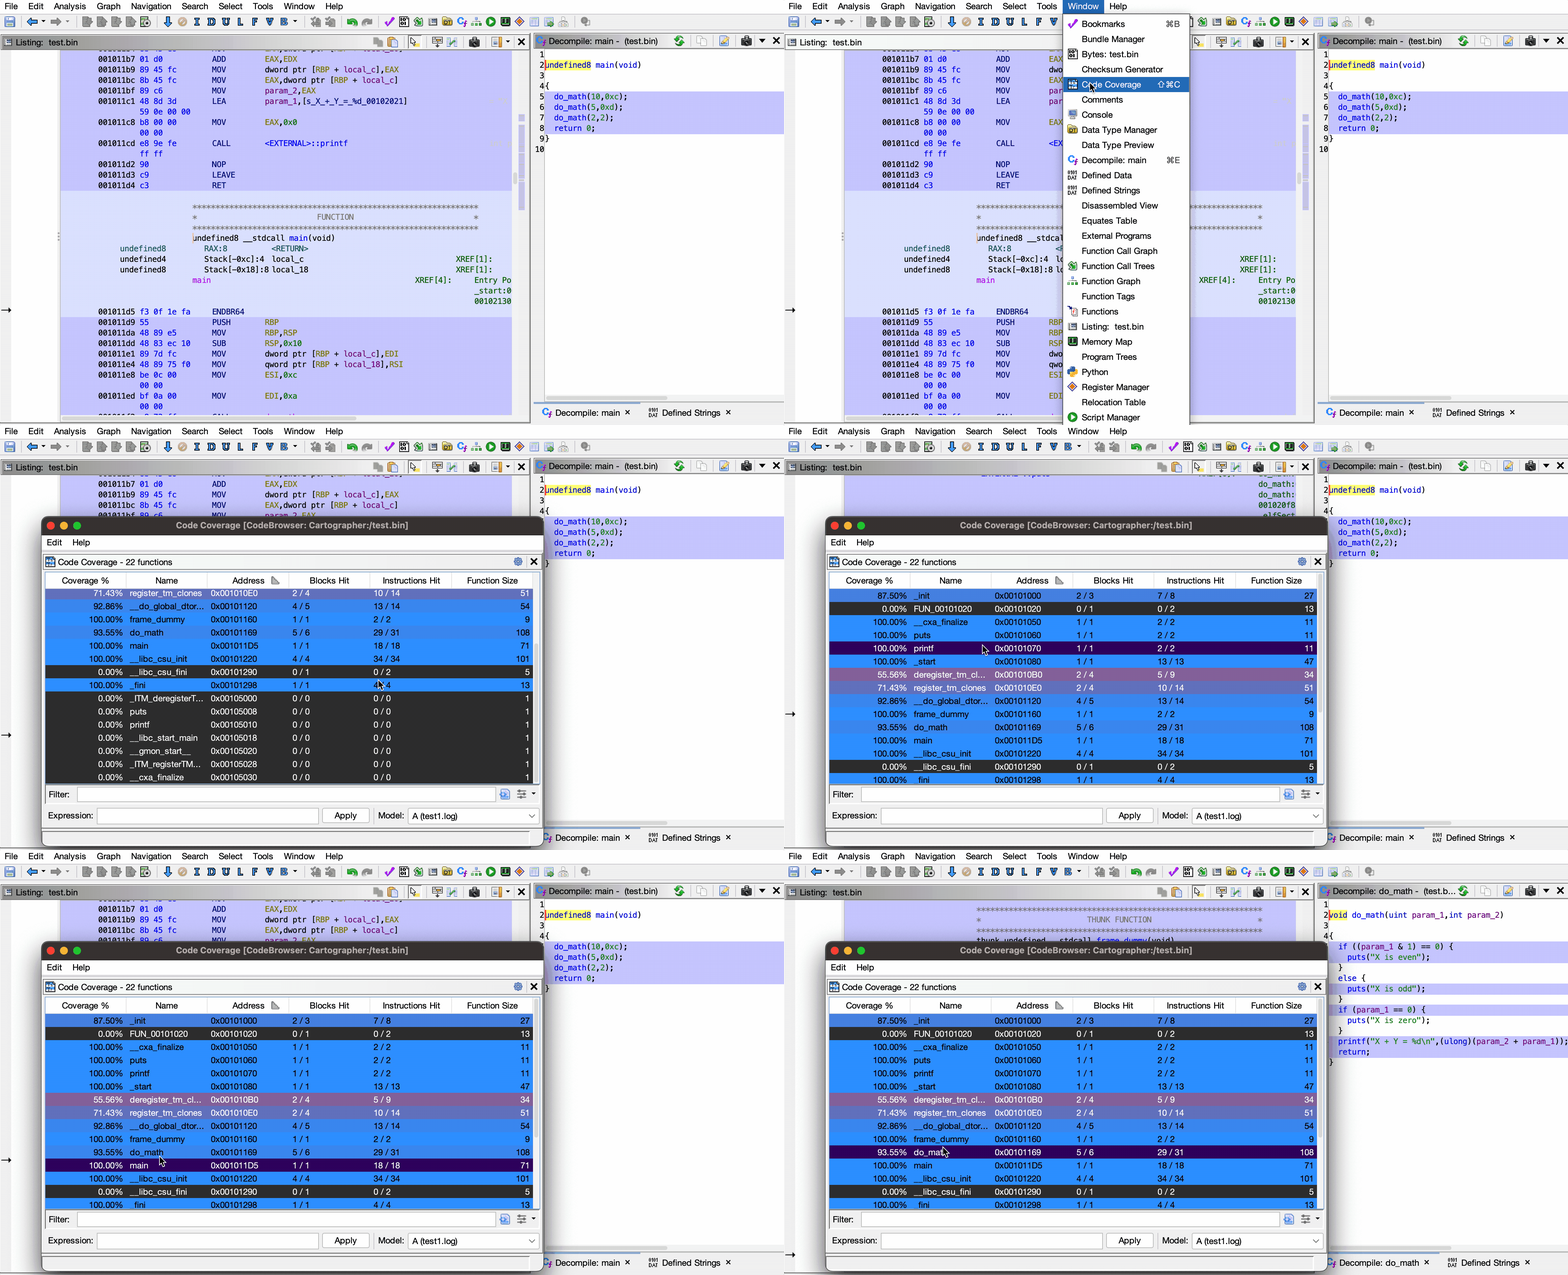
Detailed information about the coverage data for each function can be found within the Code Coverage window.
The Code Coverage window can be opened by navigating to Window -> Code Coverage, or by pressing Ctrl-Shift-C on Windows (Cmd-Shift-C on Mac).
This window shows various details about each function in the program:
- Coverage %: Percentage of the function that was executed
- Name: Name of the function
- Address: Address (entry point) of the function
- Blocks Hit: Number of basic blocks executed
- Instructions Hit Number of instructions executed
- Function Size: Size of the function in bytes
Clicking on any function will navigate to the specified function in the Listing view and Decompiler view.
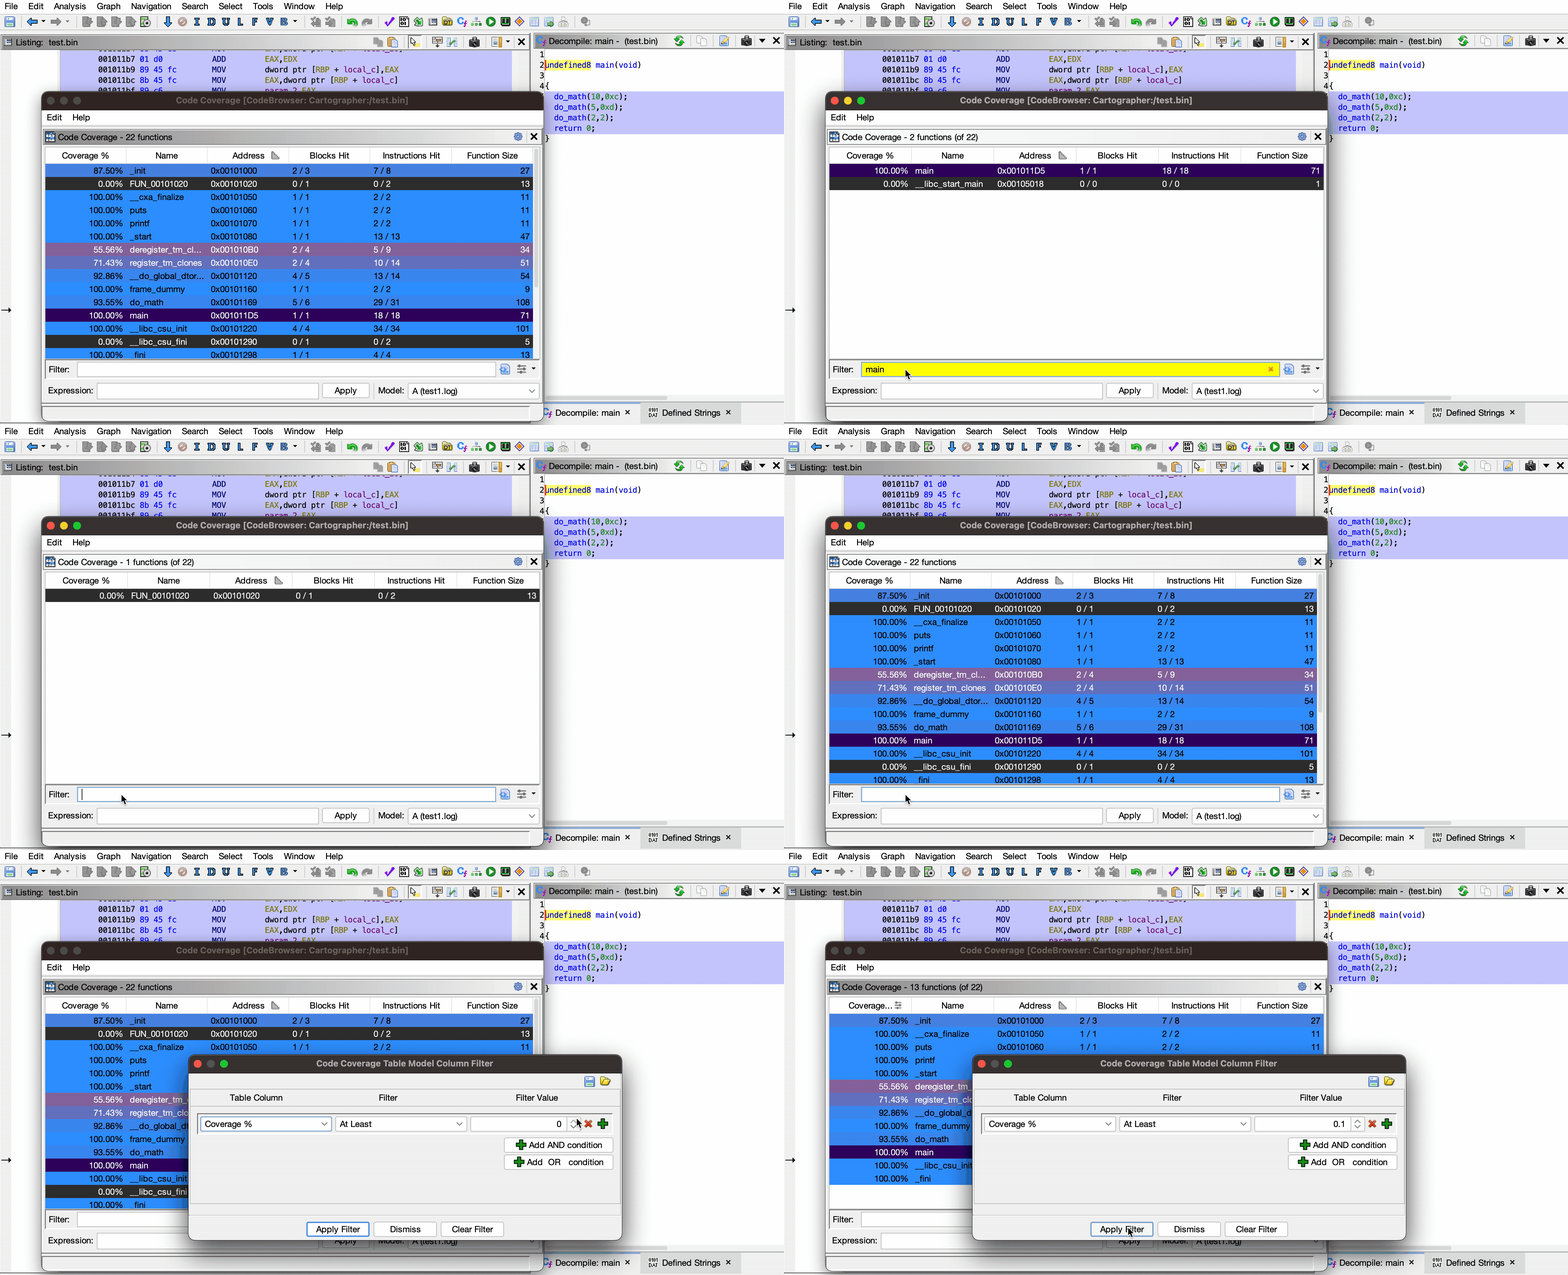
The Filter input box can be used to search for a function by name.
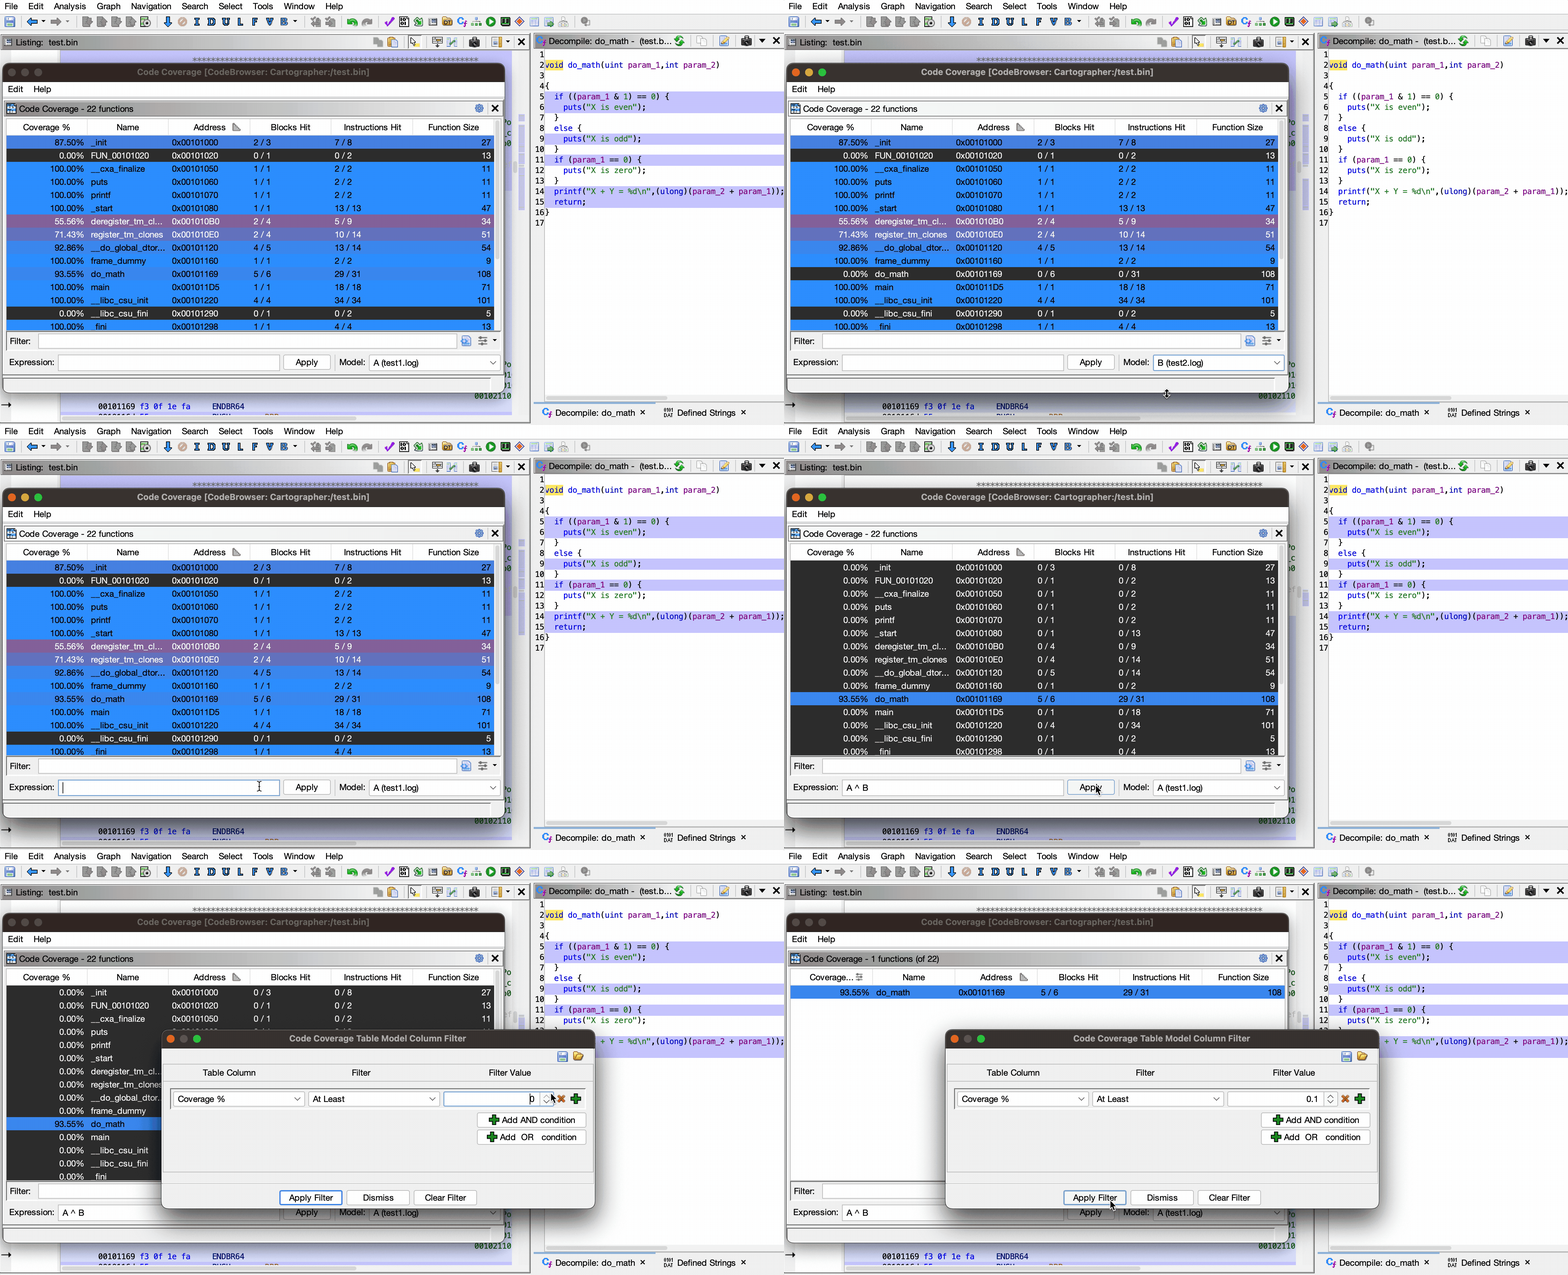
Any of the data displayed in the coverage table can be used as a column filter.
The dropdown at the bottom-right of the Code Coverage window can be used to quickly and easily swap between loaded code coverage files.
The text box at the bottom of the Code Coverage window can be used to perform logical operations on loaded code coverage files.
This can be extremely useful for examining differences and similarities between different runs of a program.
Below are the logical operators that can be used within the expression parser.
&: Gets only the code executed by both coverages|: Gets any code executed by either coverages^: Gets only the executed code that differs between the coverages-: Gets only executed code which is unique to the left-hand coverage
Coverages are referenced by their alphabetical IDs in the dropdown menu, such as A, B, XY, etc.
Each logical operation is grouped using parentheses, and expressions can be of any length or complexity.
-
Show the code that was executed in both coverages
AandB:A & B -
Show the executed code that was different between coverages
AandB:A ^ B -
Show code that was only executed in
B:B - A -
Combine all of the coverage data found in
AandB, then find any differences fromC:(A | B) ^ C
Gradle can be used to build Cartographer from its source code.
-
Clone the Cartographer GitHub repository.
$ git clone https://github.com/nccgroup/Cartographer.git -
Enter the repository and build with gradle.
$ cd Cartographer $ gradle -PGHIDRA_INSTALL_DIR=<ghidra_install_dir>- Replace
<ghidra_install_dir>with the path to your local Ghidra installation path.
- Replace
-
After building, the plugin ZIP file will be located in the
dist/folder.
If you've found a bug in Cartographer, please open an issue via GitHub.
Originally inspired by Lighthouse - https://github.com/gaasedelen/lighthouse


