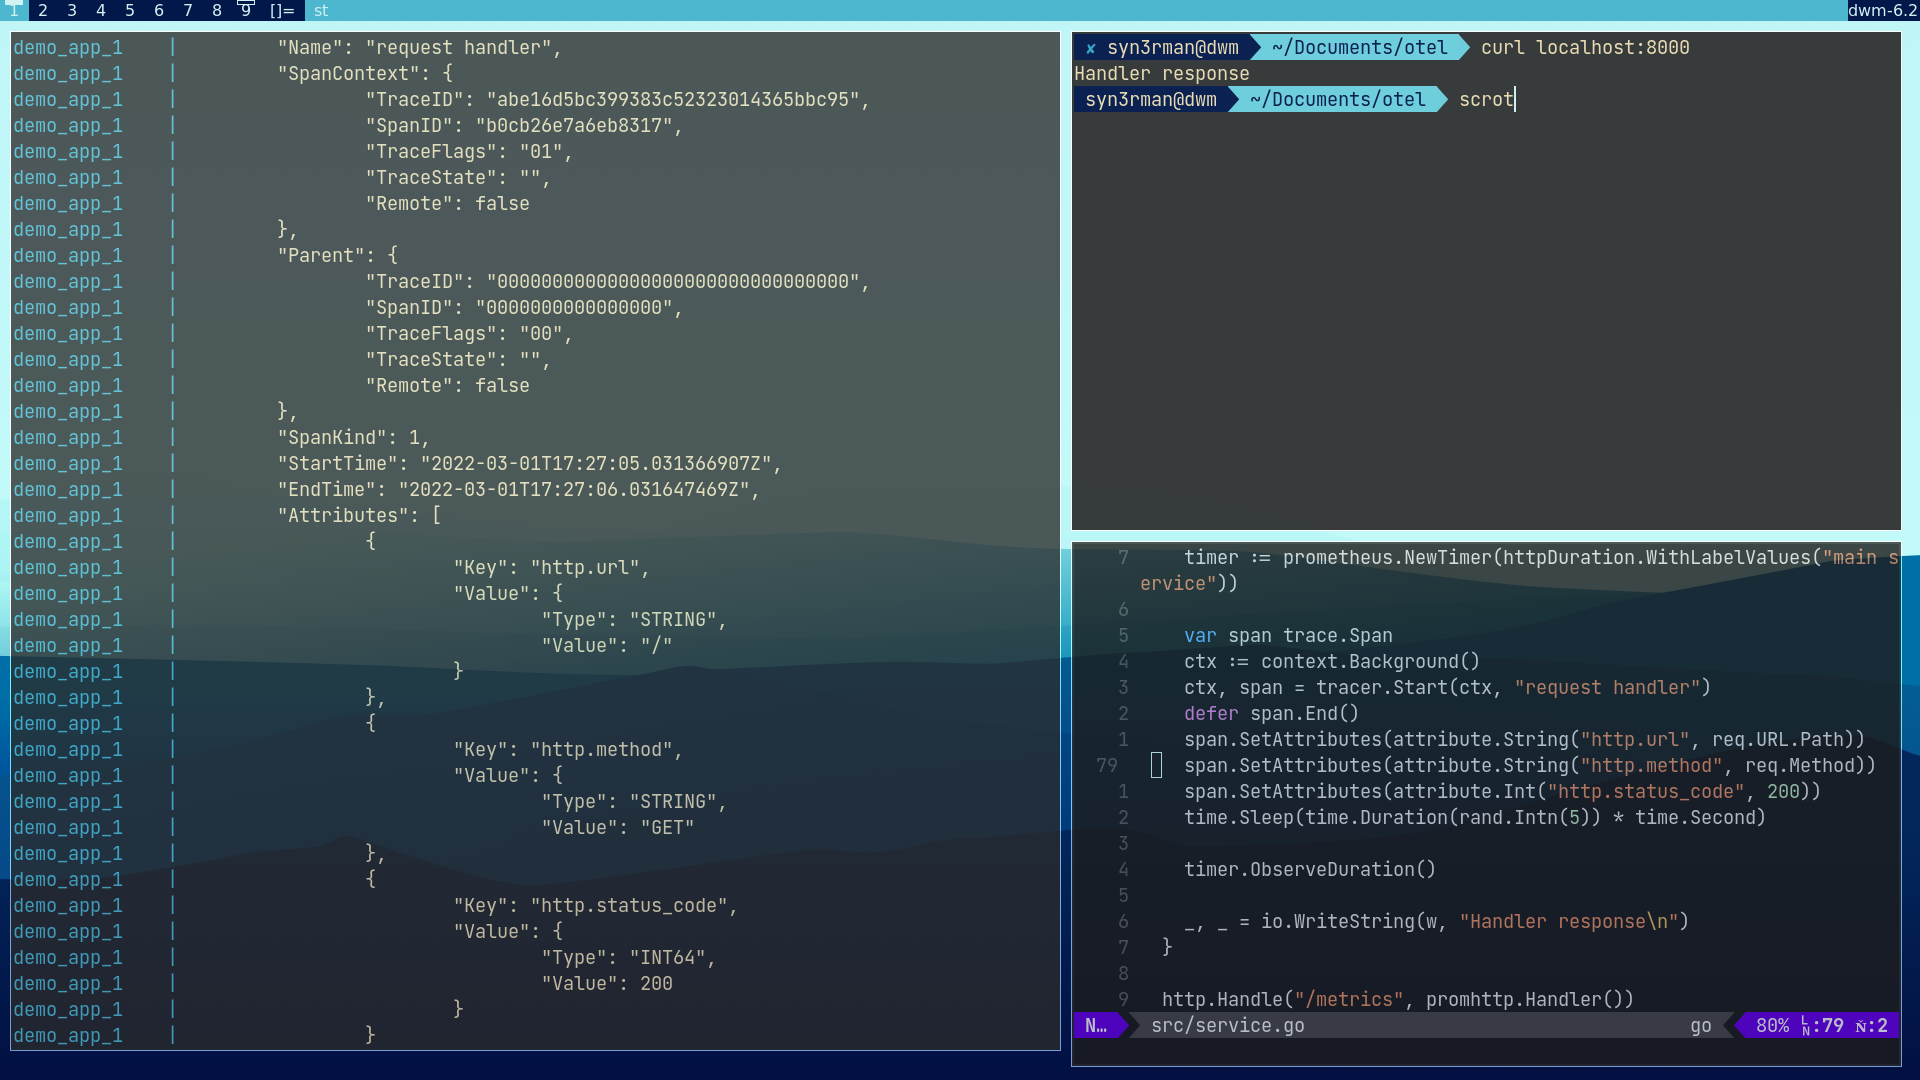
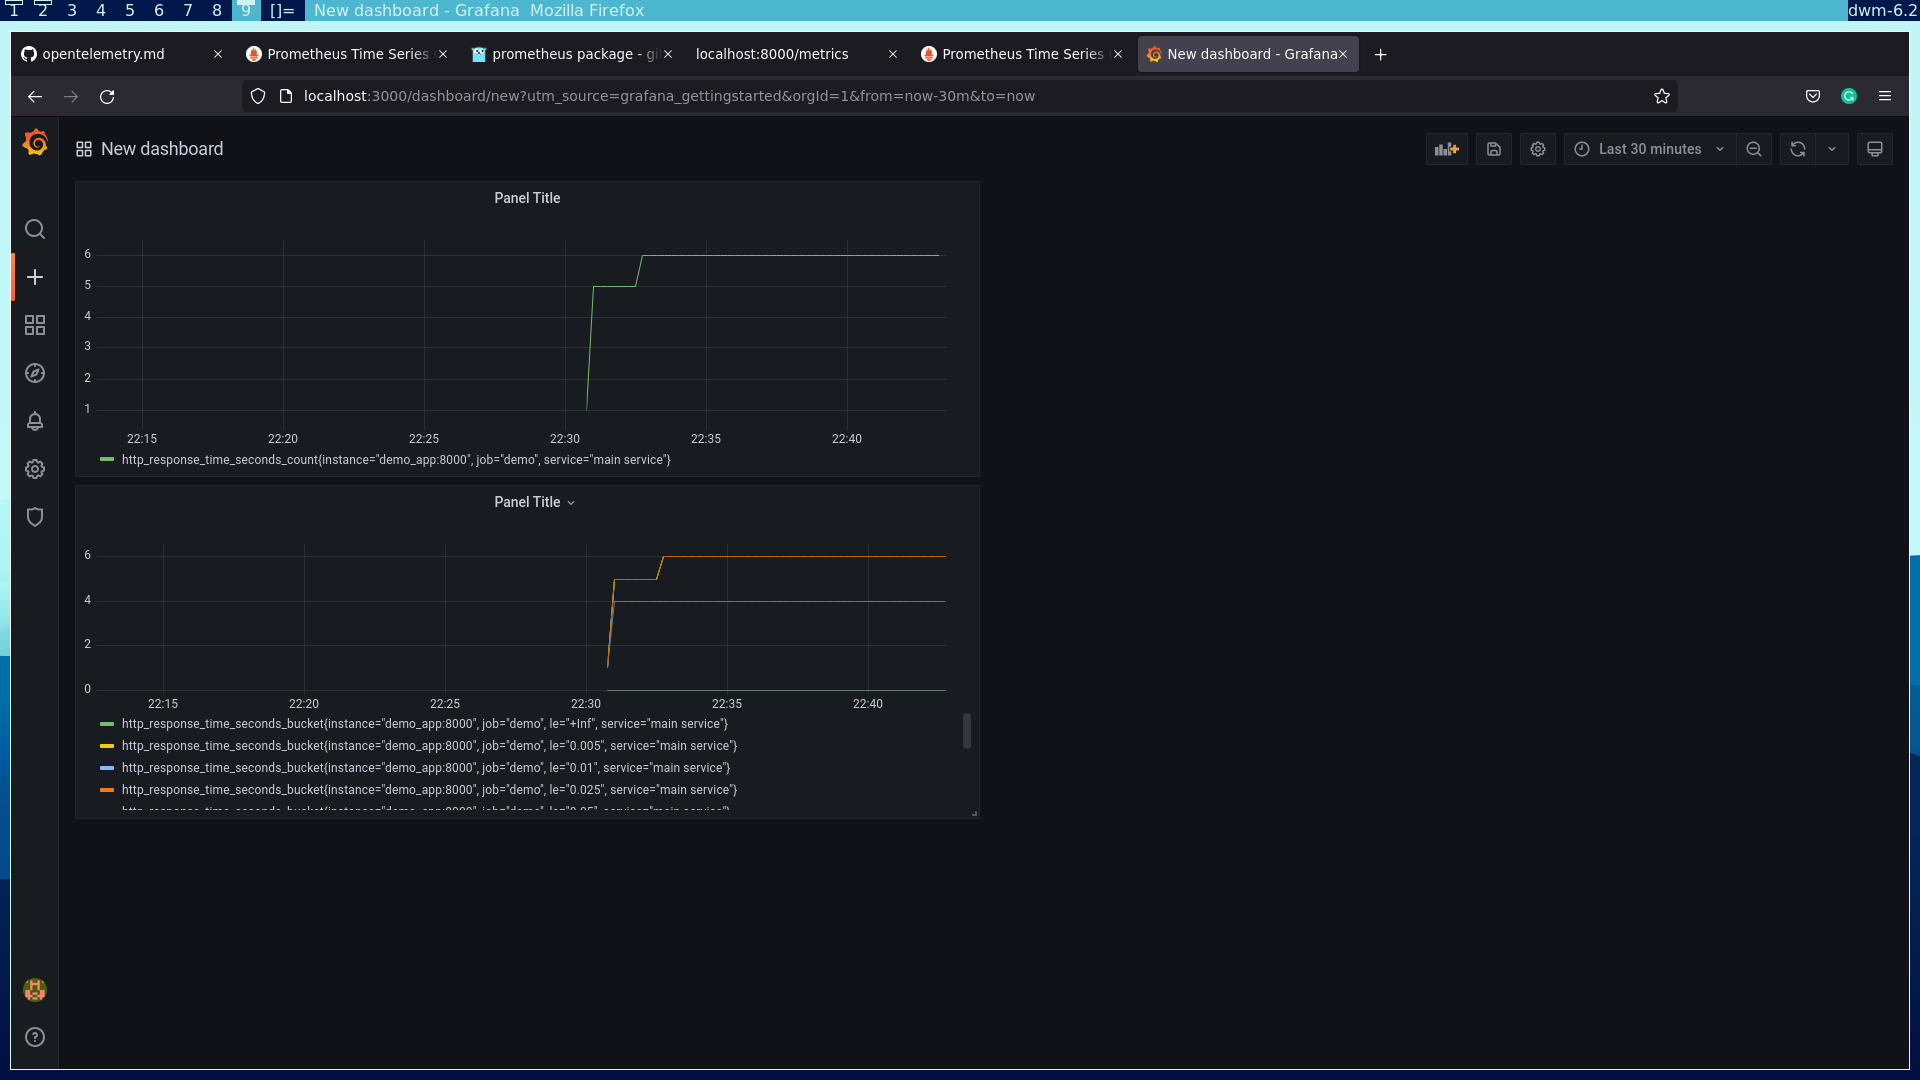
This repo contains a basic example to set up tracing in your go application using OpenTelemetry. Additionally, we also use the prometheus client library to collect metrics from our application, which can be visualized using Grafana. We can optionally create a custom build of the OpenTelemetry Collector using the prometheus receiver from the collector contrib repo and configure a pipeline for metrics of the form
receivers:
	prometheus

processors:
	any processor

exporters:
	any supported exporter
To run the demo, you just need to clone the repo to your machine, navigate into the directory, and run:
$ docker-compose up
Now, you can navigate to localhost and view the trace data generated in the console. The metrics can also be viewed on the /metrics endpoint. A grafana instance will also be started at port 3000 with admin as username and password, so you can now login to it and add prometheus as a data source to visualize metrics.
You can also find the go application under the src directory, so you can choose to execute it to see the logs generated by the stdout exporter in case you do not have docker-compose installed on your system.

