Auto_ML_C 0.0.12
这是崔连山和小伙伴们的机器学习拓展包,代有浓厚的社会主义开源分享精神,极富创造力和战斗力。在这里让我们为他们鼓掌 🥂
This is a machine learning expansion package for Cui Lianshan and his friends. It has a strong socialist open source sharing spirit, and is extremely creative and combat effective. Let us applaud them here 🥂
测试集数据位置 Test set data location :{Example}
The configuration is as follows:
| Windows | Windows | MacOS | Linux | |
|---|---|---|---|---|
| 型号 | i7-9750H | i7-9750H | M1 | E5-2640 V4 |
| 核心 | 6核心12线程 | 6核心12线程 | 8核心 | 20核心40线程 |
| 频率 | 2.67GHz | 3.2GHz | 2.40GHz |
运行速度对比结果如下:
| Unwrapped function | Windows1 | Windows2 | MacOS | Linux |
|---|---|---|---|---|
| ALL_FUNCTION | 47.364 | 43.681 | 34.013 | ==27.282== |
| binary_ROC() | 45.809 | 42.964 | 32.751 | ==32.143== |
| auto_model() | 53.498 | 48.649 | ==38.267== | 40.794 |
| estimator_violion() | 1.191 | ==1.021== | 1.678 | 2.395 |
The running speed comparison results are as follows:
| Wrapper function | Windows1 | Windows2 | MacOS | Linux |
|---|---|---|---|---|
| binary_ROC() | 46.2 s | 43.2 s | CPU times: user 4.82 s, sys: 365 ms, total: 5.18 s Wall time: ==32.9s== | CPU times: user 9.59 s, sys: 3.89 s, total: 13.5 s Wall time: 33.3 s |
| auto_model() | 50.4 s | 47.1 s | CPU times: user 9.75 s, sys: 247 ms, total: 10 s Wall time: ==38.1 s== | CPU times: user 15.1 s, sys: 1.68 s, total: 16.8 s Wall time: 41.1 s |
| estimator_violion() | 1.16 s | Wall time: ==1.01 s== | CPU times: user 2.02 s, sys: 70.1 ms, total: 2.09 s Wall time: 1.69 s | CPU times: user 3.85 s, sys: 2.32 s, total: 6.17 s Wall time: 2.23 s |
You can refer to learning the environment backup in the current directory: Auto_ML_C.yaml
| Package | Minimum version-to be tested |
|---|---|
| python=3.8.10 | |
| seaborn=0.11.2 | |
| pandas=1.3.3 | |
| matplotlib=3.4.2 | |
| numpy=1.20.3 |
该包是基于Sklearn,imblance等机器学习拓展包之上的Package,共计划分为两个部分, This package is based on Sklearn, imblance and other machine learning expansion packages. It is planned to be divided into two parts.
-
Classification task
-
binary_classfication.py
The internal available functions are as follows 内部可用函数如下
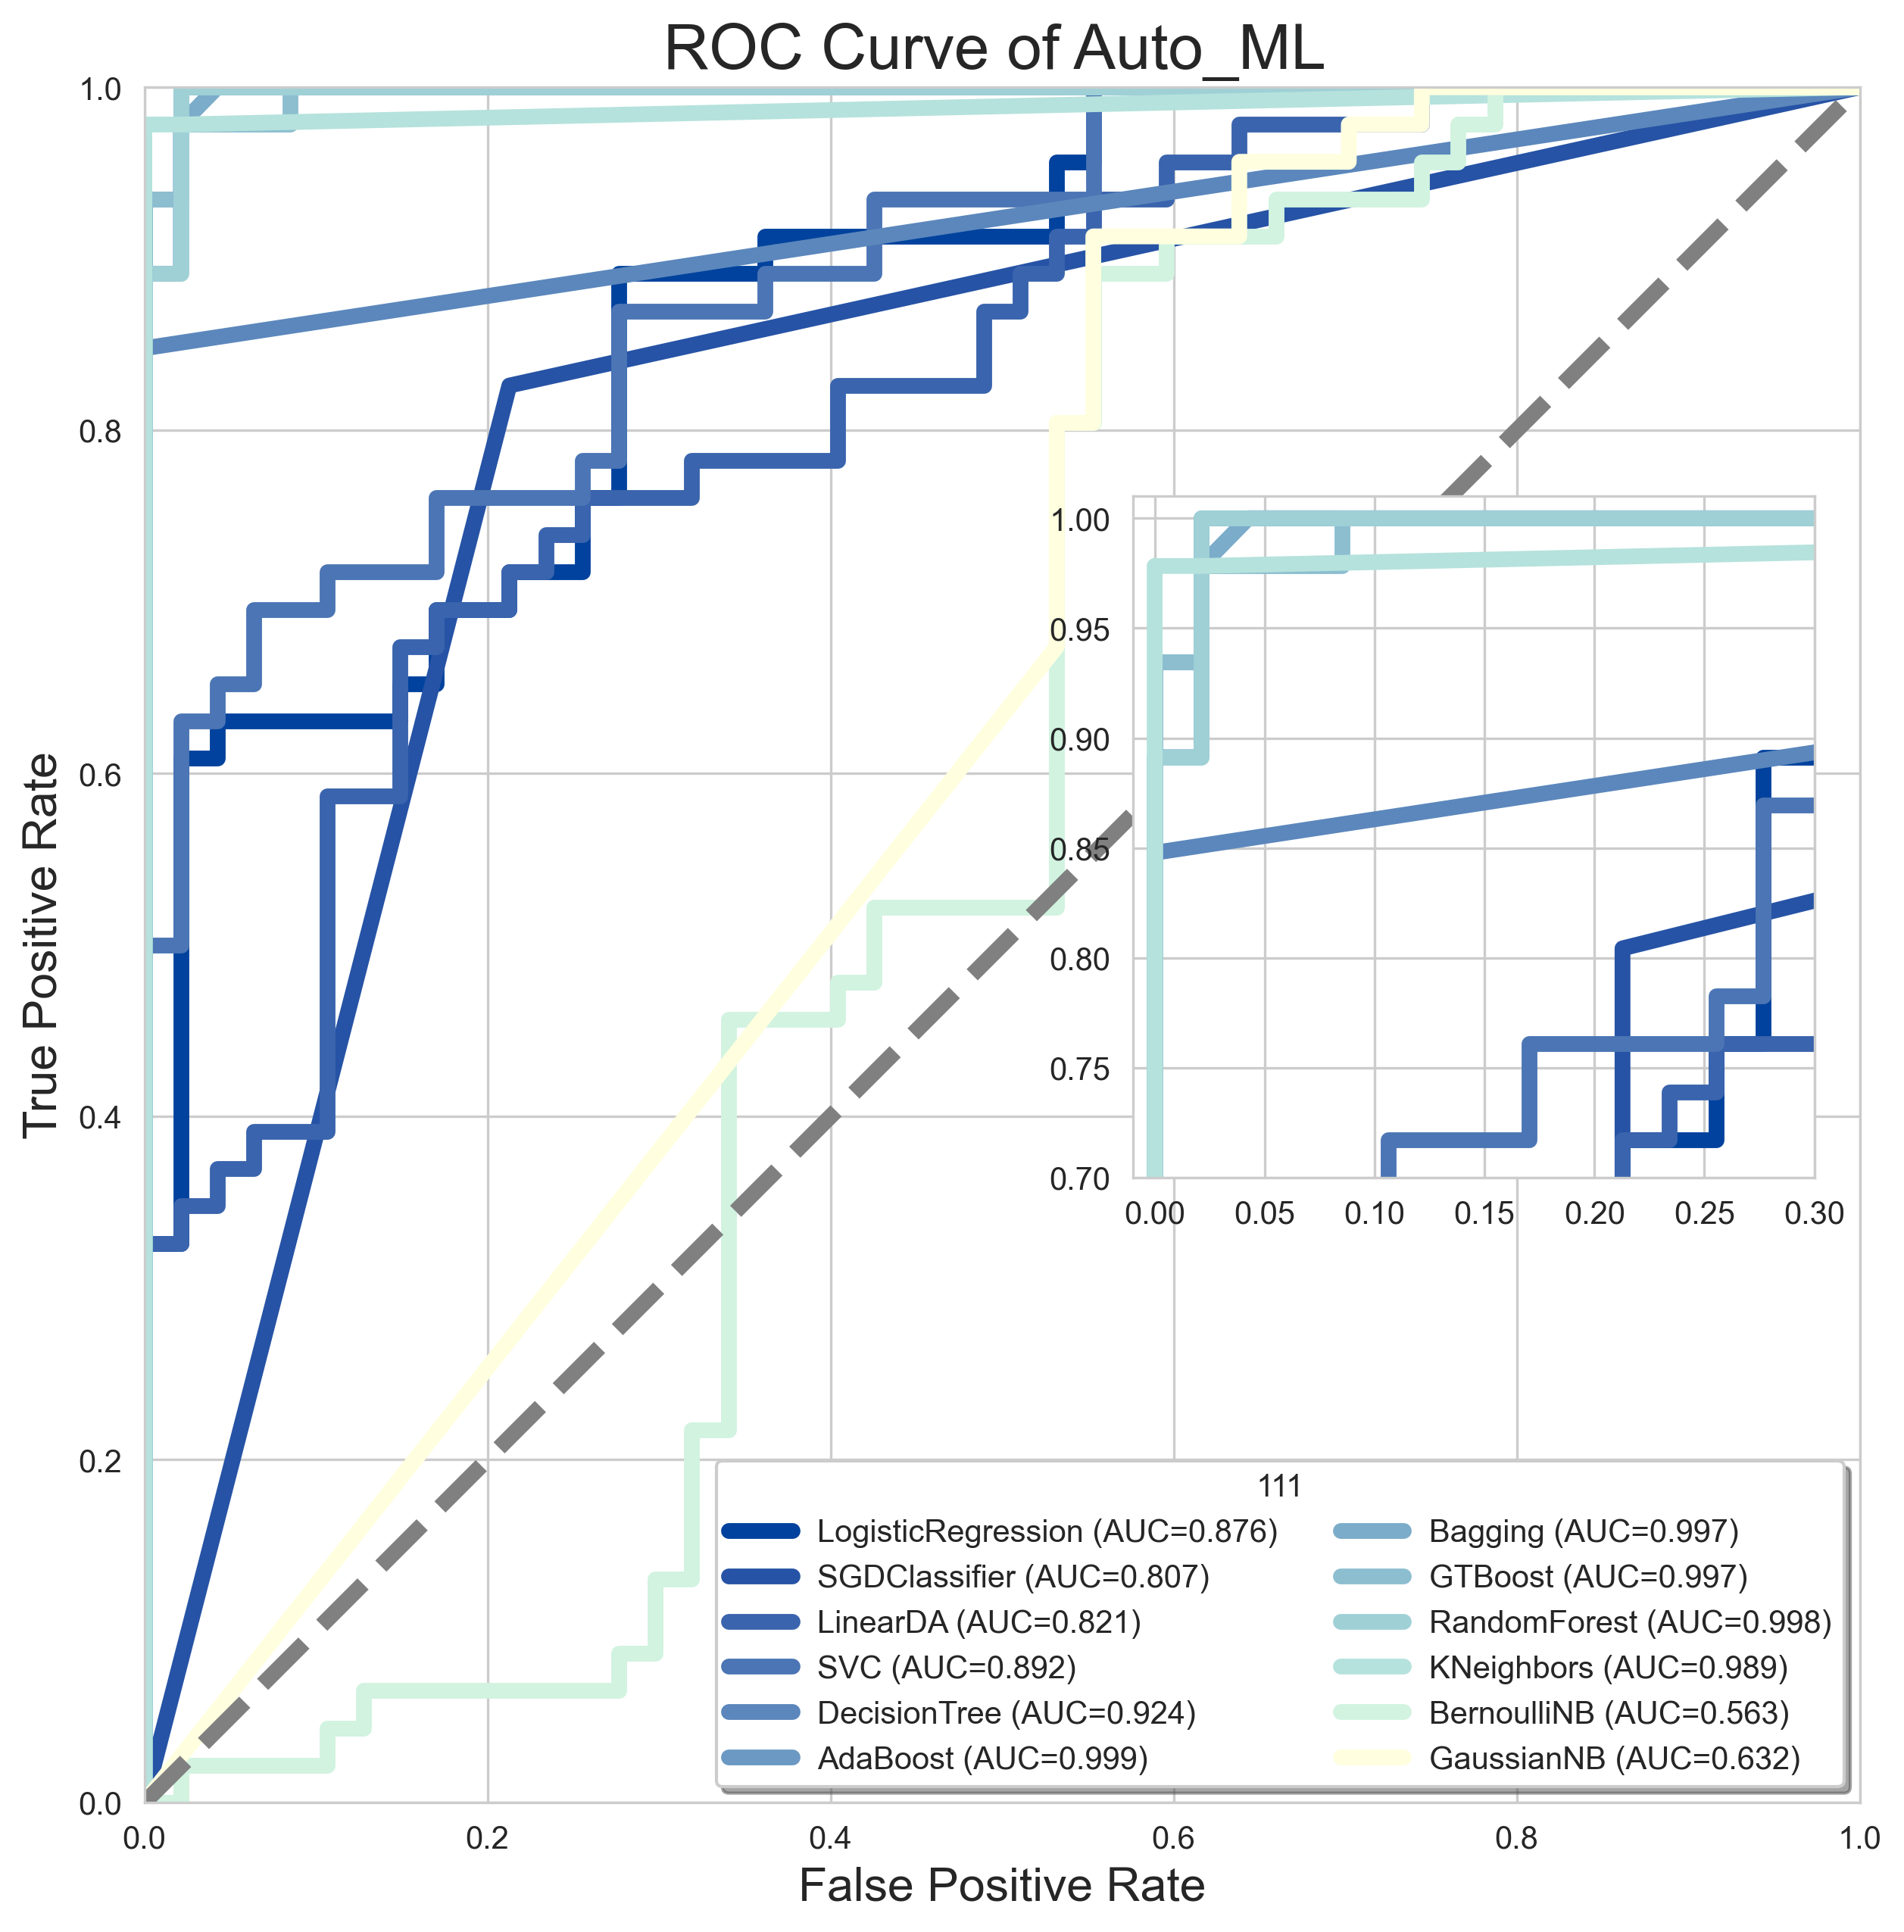
函数名 功能 返回值 cal_add_1(num1,num2):wave: 简单的欢迎函数 num1,num2 LogisticRegressionCV_mdoel(X, Y,cv) SGDClassifier_model(X,Y,cv) LinearDiscriminantAnalysis_model(X, Y,cv) LinearSVC_model(X, Y,cv) SVC_model(X, Y,cv) DecisionTreeClassifier_model(X,Y,cv) AdaBoostClassifier_model(X,Y,cv) BaggingClassifier_model(X, Y,cv) GradientBoostingClassifier_model(X, Y,cv) RandomForestClassifier_model(X, Y,cv) KNeighborsClassifier_model(X, Y,cv) BernoulliNB_model(X, Y,cv) GaussianNB_model(X,Y,cv) 下面是总函数 binary_ROC(X,Y,k,fig_name) Plot the best ROC under scalar hyperparameter search fig auto_model(X, Y, k)Model's scalar hyperparameter search results Auc_data, Acc_data,
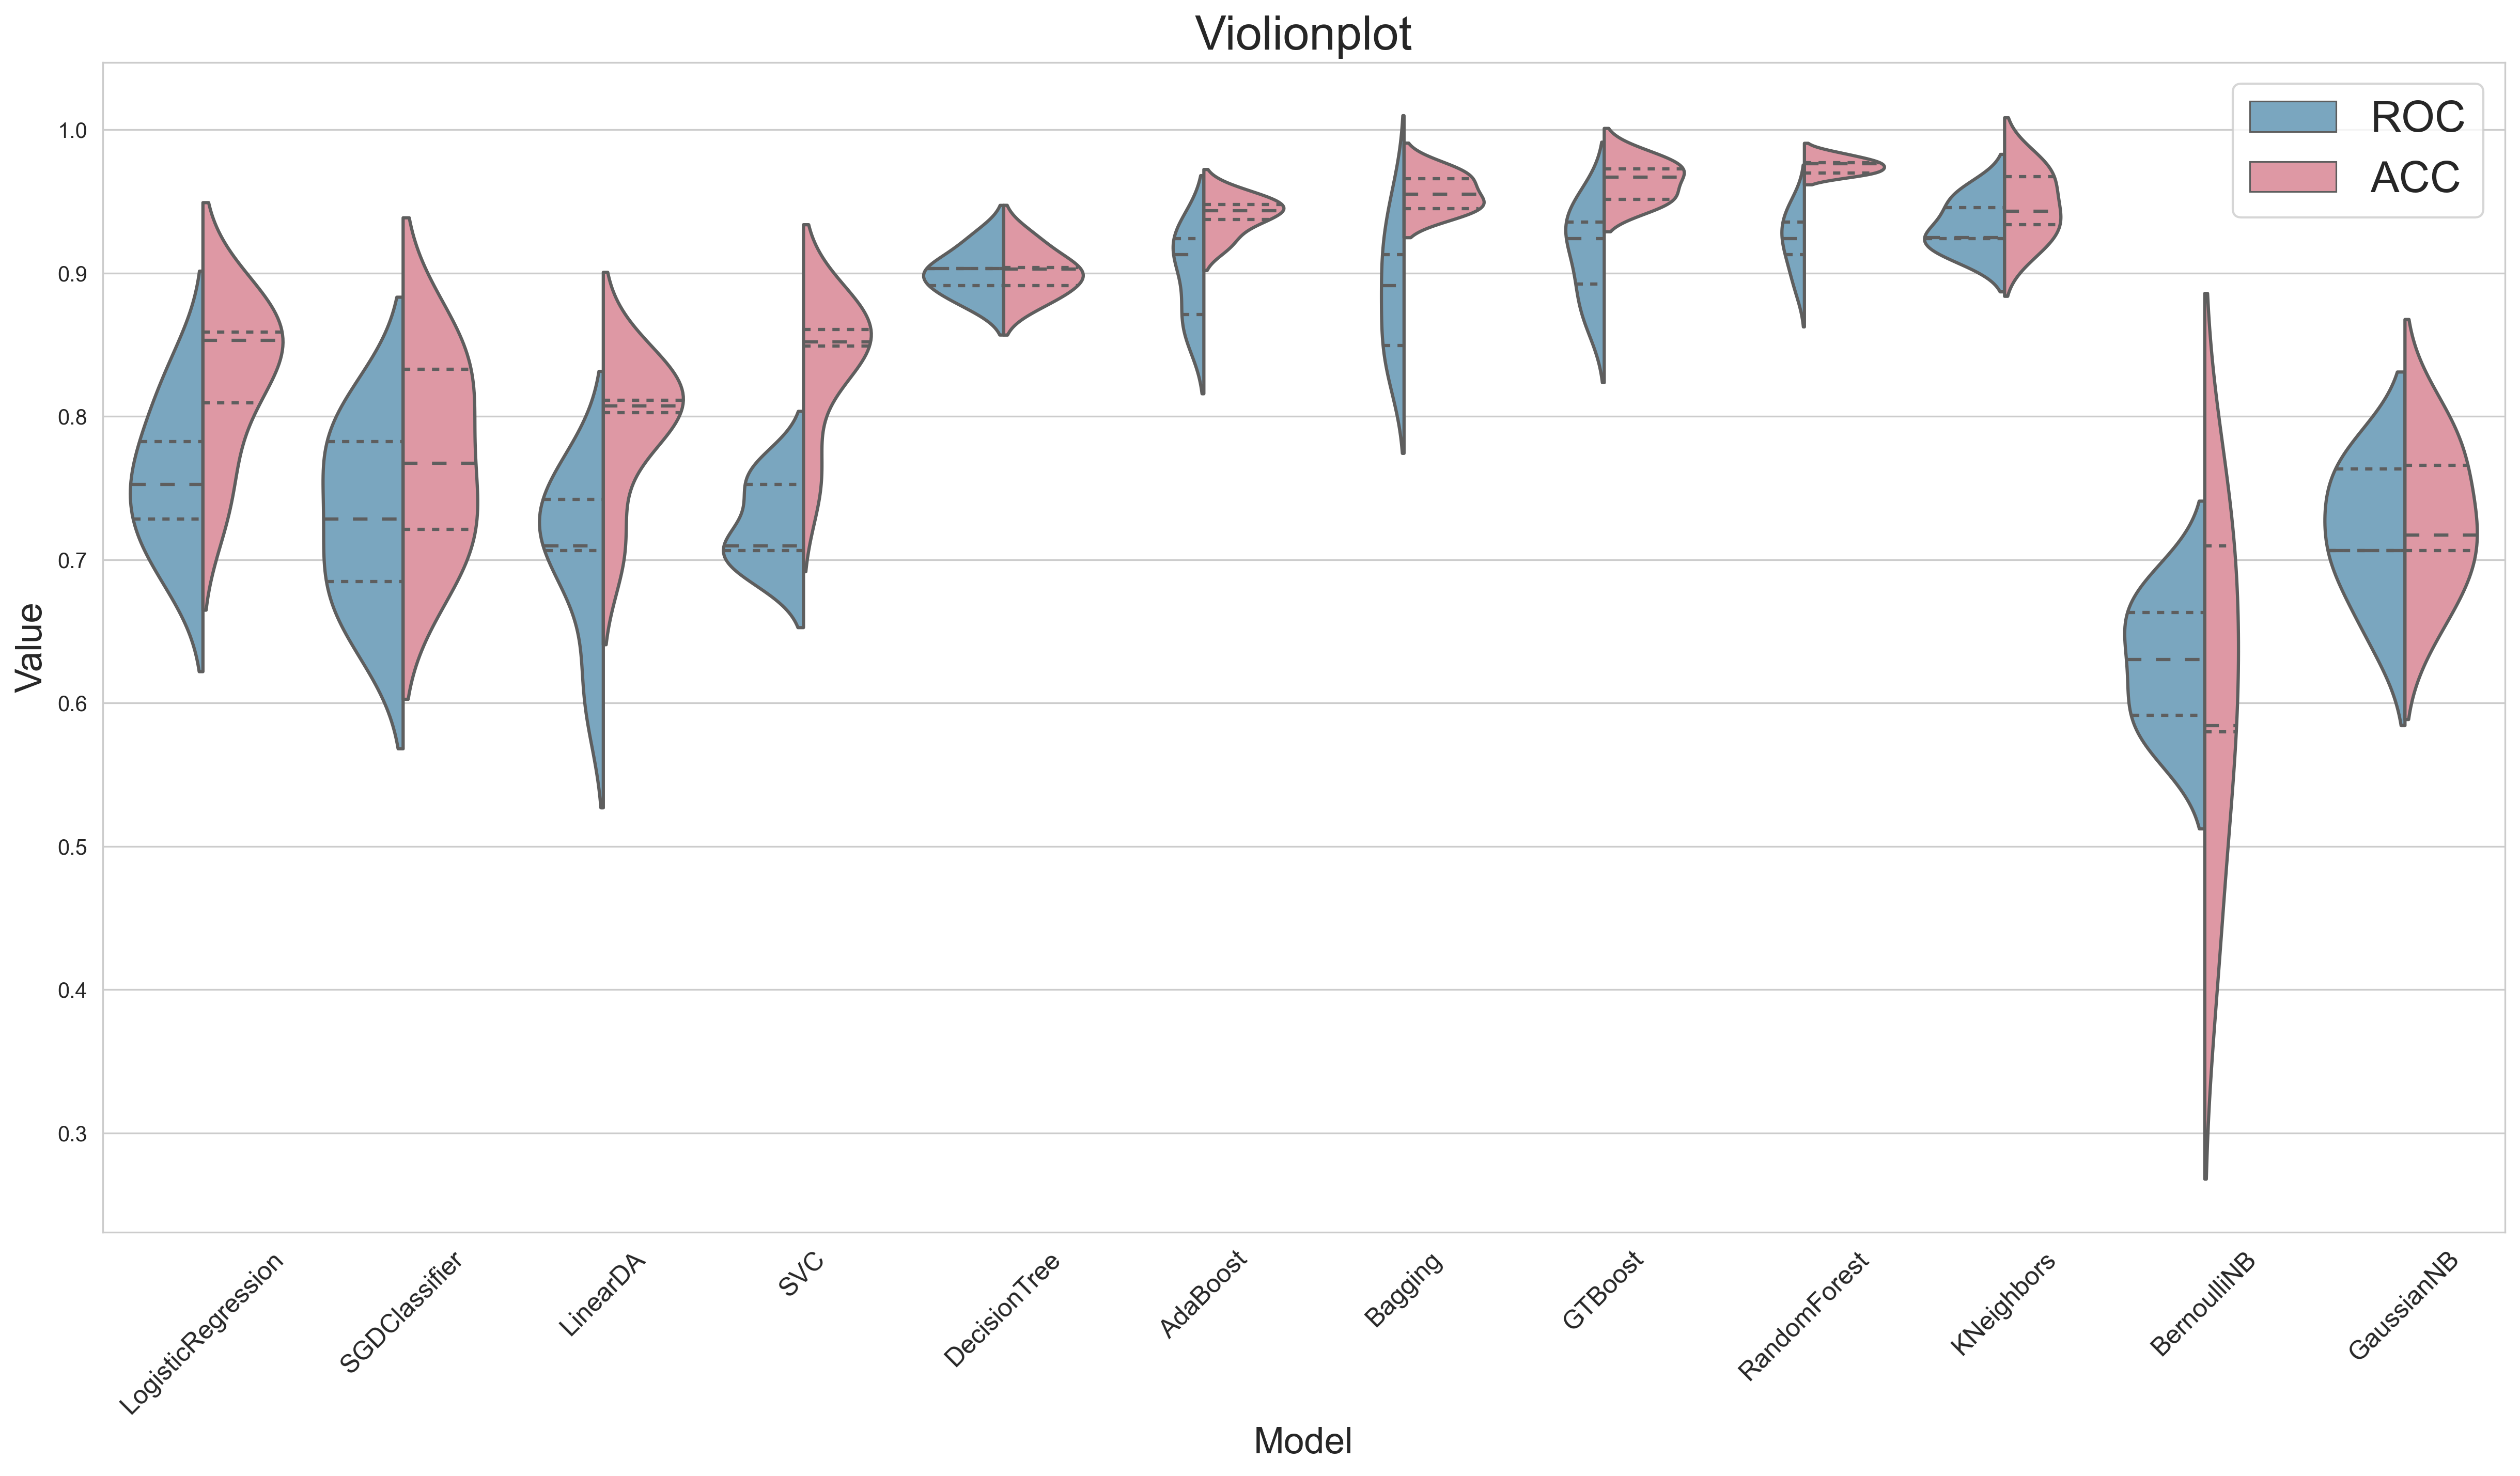
Recall_data, Precision_dataestimator_violion(df1,df2,fig_name) Draw a violin chart for the Dataframe of the auto_model result fig -
Multi-class function
等待
-
Feature selection function Feature_struction
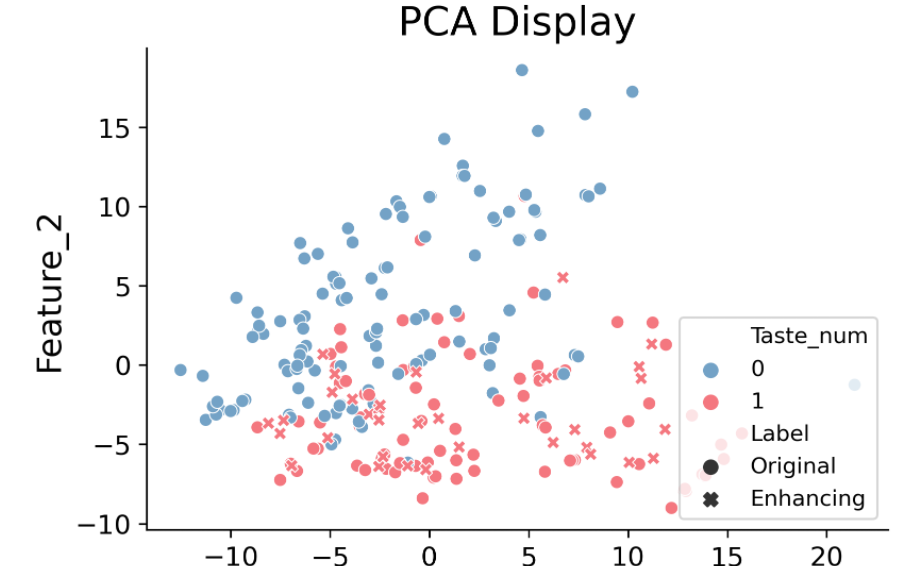
Function Function return value data_enhance_show(X,Y[["Taste_num"]],location,kind="SMOTE") 多种可视化方法进行降维可视化待增强数据
A variety of visualization methods to reduce dimensionality to visualize the data to be enhancedDeduplicate DataFrame data_enhance(X.iloc[:,:-1],Y[["Taste_num"]]) 采用多指标评价不同增强方法后的结果
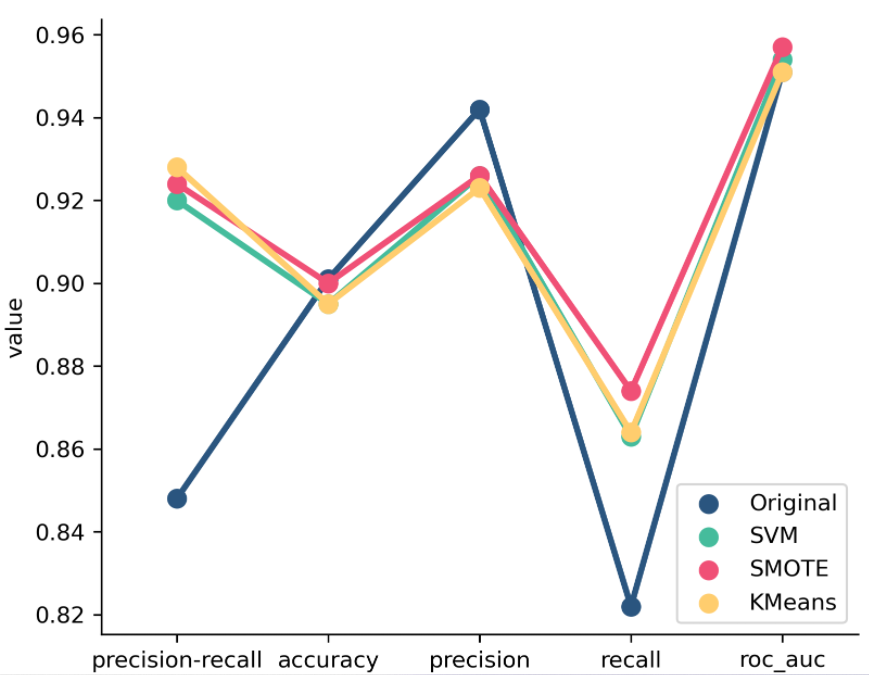
Using multiple indicators to evaluate the results of different enhancement methodsRating DataFrame data_enhance_compare(tmp1,location,name) 可视化函数2的返回结果
Visualize the return result of function 2图片 Fig -
超参数优化的进度条版本!!!! 下次一定系列! Super parameter optimization progress bar display function! ! ! ! Update focus of the next version
-
# Method 1
# Create a new environment, here is conda as an example
conda create --name Auto_ML_C python=3.8.10

# Activate the newly created environment
conda activate Auto_ML_C

# Installation package
pip install Auto_ML_C==0.0.11
pip install imblearn

# Suggest the pipeline of Jupyter notebook [optional, recommended]
conda install jupyter notebook
conda install ipykernel
python -m ipykernel install --user --name Auto_ML_C --display-name   "Auto_ML_C"
# Install Sklearn 0.6.  this will fixed next version
conda install -c conda-forge sklearn-contrib-lightning

# Method2
# Use the yaml environment file on the GitHub homepage to directly copy the current environment
conda env create -n Auto_ML_C -f Auto_ML_C.yaml

# Activate the newly created environment
conda activate

# Suggest the pipeline of Jupyter notebook [optional, recommended]
conda install jupyter notebook
conda install ipykernel
python -m ipykernel install --user --name Auto_ML_C --display-name "Auto_ML_C"import auto_ml_c.Feature_structure as fs
import pandas as pd
df = pd.read_csv("1_23肽全部的构效数据.csv")
X = df.iloc[:,2:]
Y = df[["Taste"]]
Y["Taste_num"] = 10
for i in range(Y.shape[0]):
if Y["Taste"].iloc[i] == "Umami":
Y["Taste_num"].iloc[i] = 1
elif Y["Taste"].iloc[i] == "Bitter":
Y["Taste_num"].iloc[i] = 0
# Function 1: Use a variety of visualization methods to reduce dimensionality to visualize the data to be enhanced
# 函数1: 采用多种可视化方法进行降维可视化待增强数据
location = ""
tmp = fs.data_enhance_show(X,Y[["Taste_num"]],location,kind="SMOTE")
tmp
# Function 2: Using multiple indicators to evaluate the results of different enhancement methods
# 函数2: 采用多指标评价不同增强方法后的结果
tmp1 = fs.data_enhance(X.iloc[:,:-1],Y[["Taste_num"]])
tmp1
# Function 3: Visualize the return result of function 2
# 函数3:可视化函数2的返回结果
location = ""
name="Test"
tmp2 = fs.data_enhance_compare(tmp1,location,name)
tmp2# Here is an example of the function binary_classfication_ws
# 这里以函数binary_classfication_ws举例
# 开始加载环境
import pandas as pd
import numpy as np
import auto_ml_c.binary_classfication as abc
# 读取测试数据
df = pd.read_csv("2_data_deal_smote.csv")
X = df.iloc[:,:-1]
Y = df["label"]
score = 'accuracy'
# The first function, draw ROC image
tmp_a = abc.binary_ROC(X,Y,cv,"111","accuracy")
# The second function, get Auc_data, Acc_data, Recall_data, Precision_data
tmp_b1,tmp_b2,tmp_b3,tmp_b4 = abc.auto_model(X,Y,cv,"accuracy")
# The third function, draw the evaluation graph obtained by function 2 auto_model
tmp_c = abc.estimator_violion(tmp_b1,tmp_b2,"Violionplot")VX:Cuizy13390906310_ic
QQ:1776228595
E-mail:1776228595@qq.com


