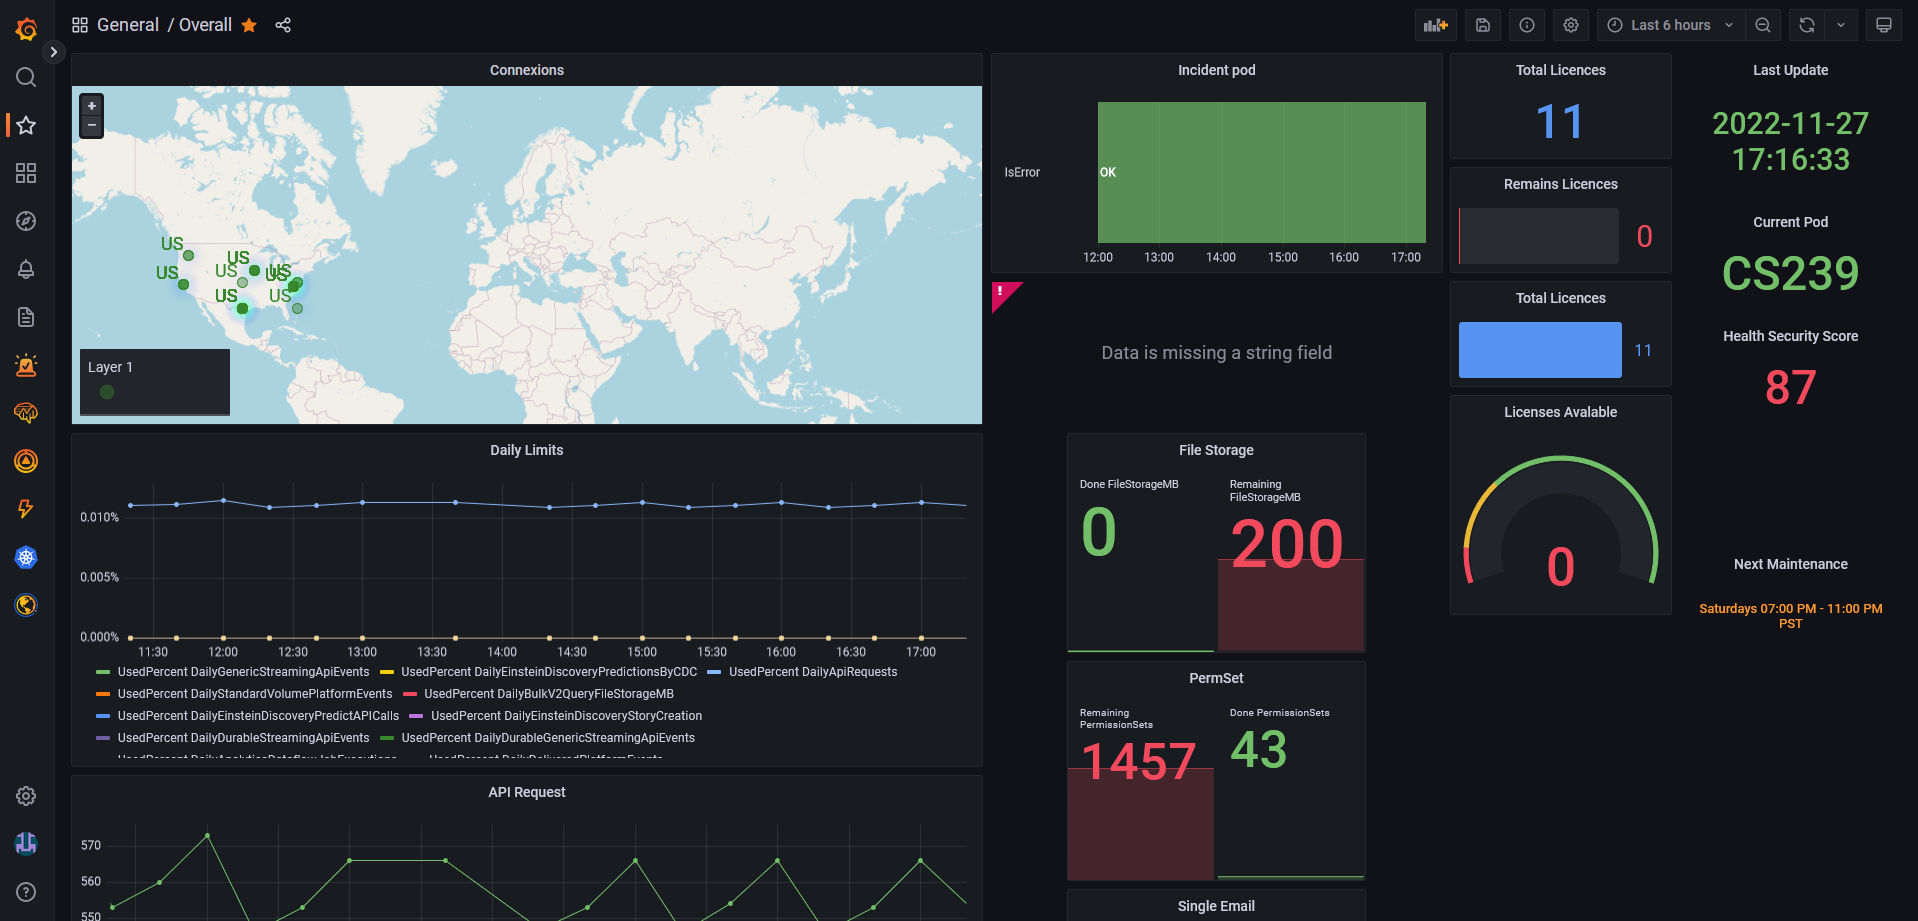
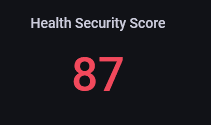
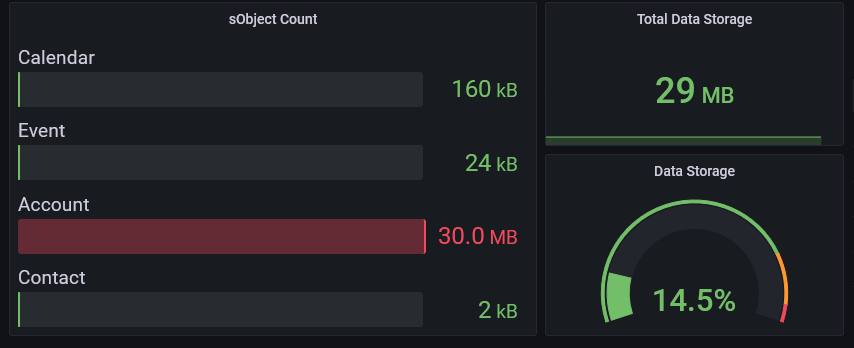
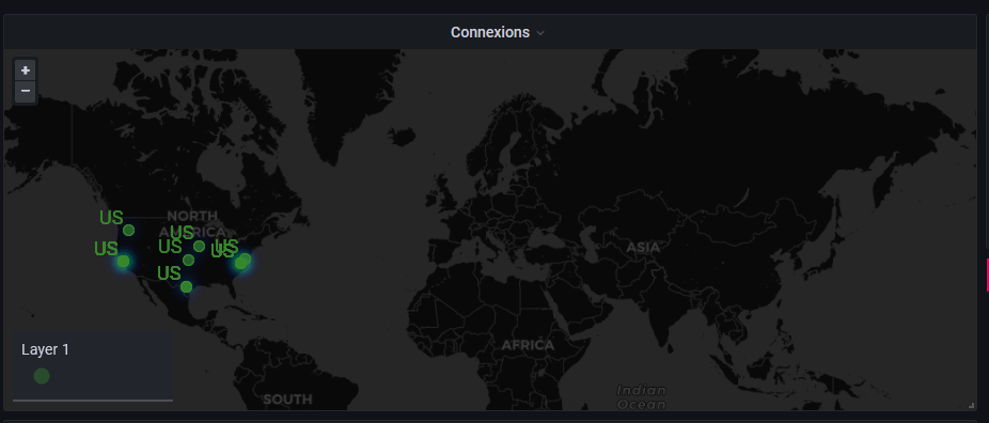
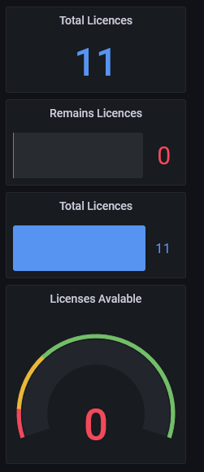
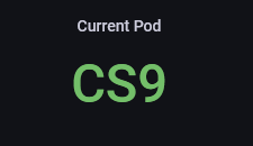
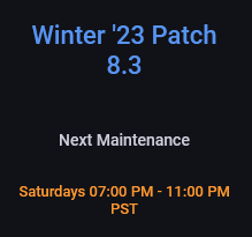
This project is an exemple of implementation of Grafana to monitor multiple element of a salesforce environement. It could be used with free tool (Grafana cloud, Github Action and Influx DB) but you are free to use other ones.
FTD22 Presentation: https://docs.google.com/presentation/d/1yqZlCjhDxv6hEJJjoesuwR6RVJ8Xh-k2EA5FPc0vsns/edit?usp=share_link
To deploy this project run
You just need technical user with the according permission set to access API used in the scripts
You can use the script in the github/workflows folder. You will have to create environement variables in
Setting -> Secrets -> Action
- InfluxDB related
INF_BUCKET: the name of the bucket you used to store records
INF_ORG : exemple: 5cd0450c43c57af1
INF_TOKEN exemple: rQeLw8V2f7GN3xr-0ndZjRZPHkT7hPghkG6fQKyDEwa6eexgQw-gVorRc_eOcu7biTiij7GW
INF_URL exemple: "https:// eu-central-1-1.aws.cloud2.influxdata.com"
- Salesforce related
SF_CONSUMER_KEY
SF_CONSUMER_SECRET
SF_PASSWORD
SF_TOKEN
SF_USERNAME
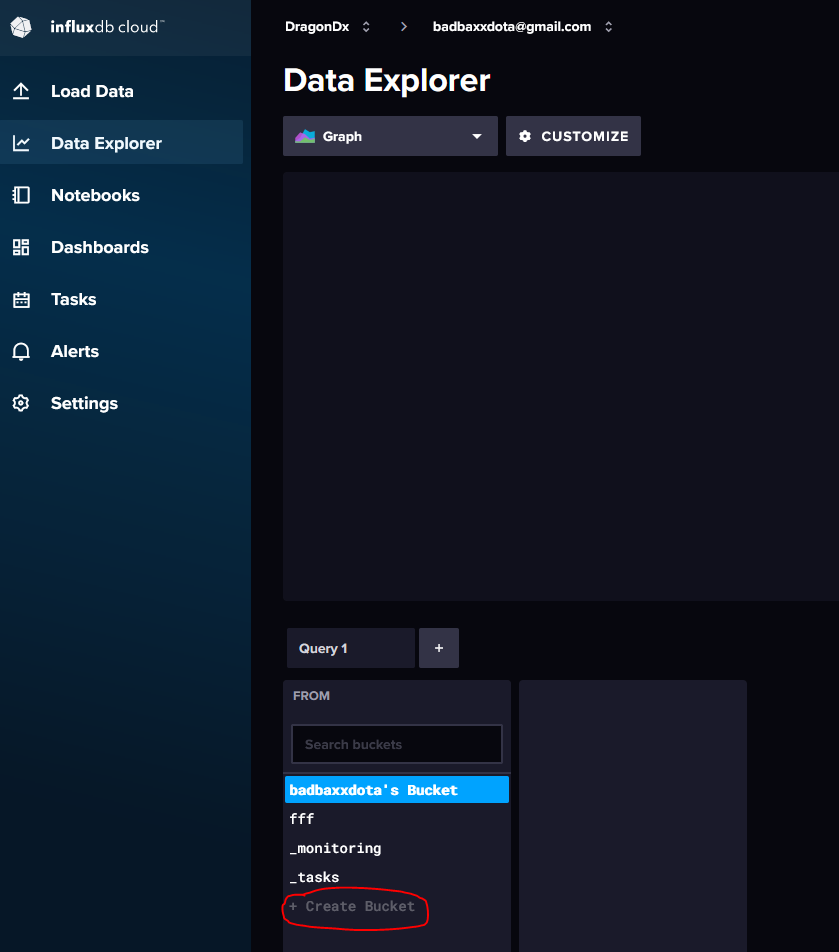
Get an account on https://cloud2.influxdata.com/signup (with a google account)
- Create a bucket from the data explorer
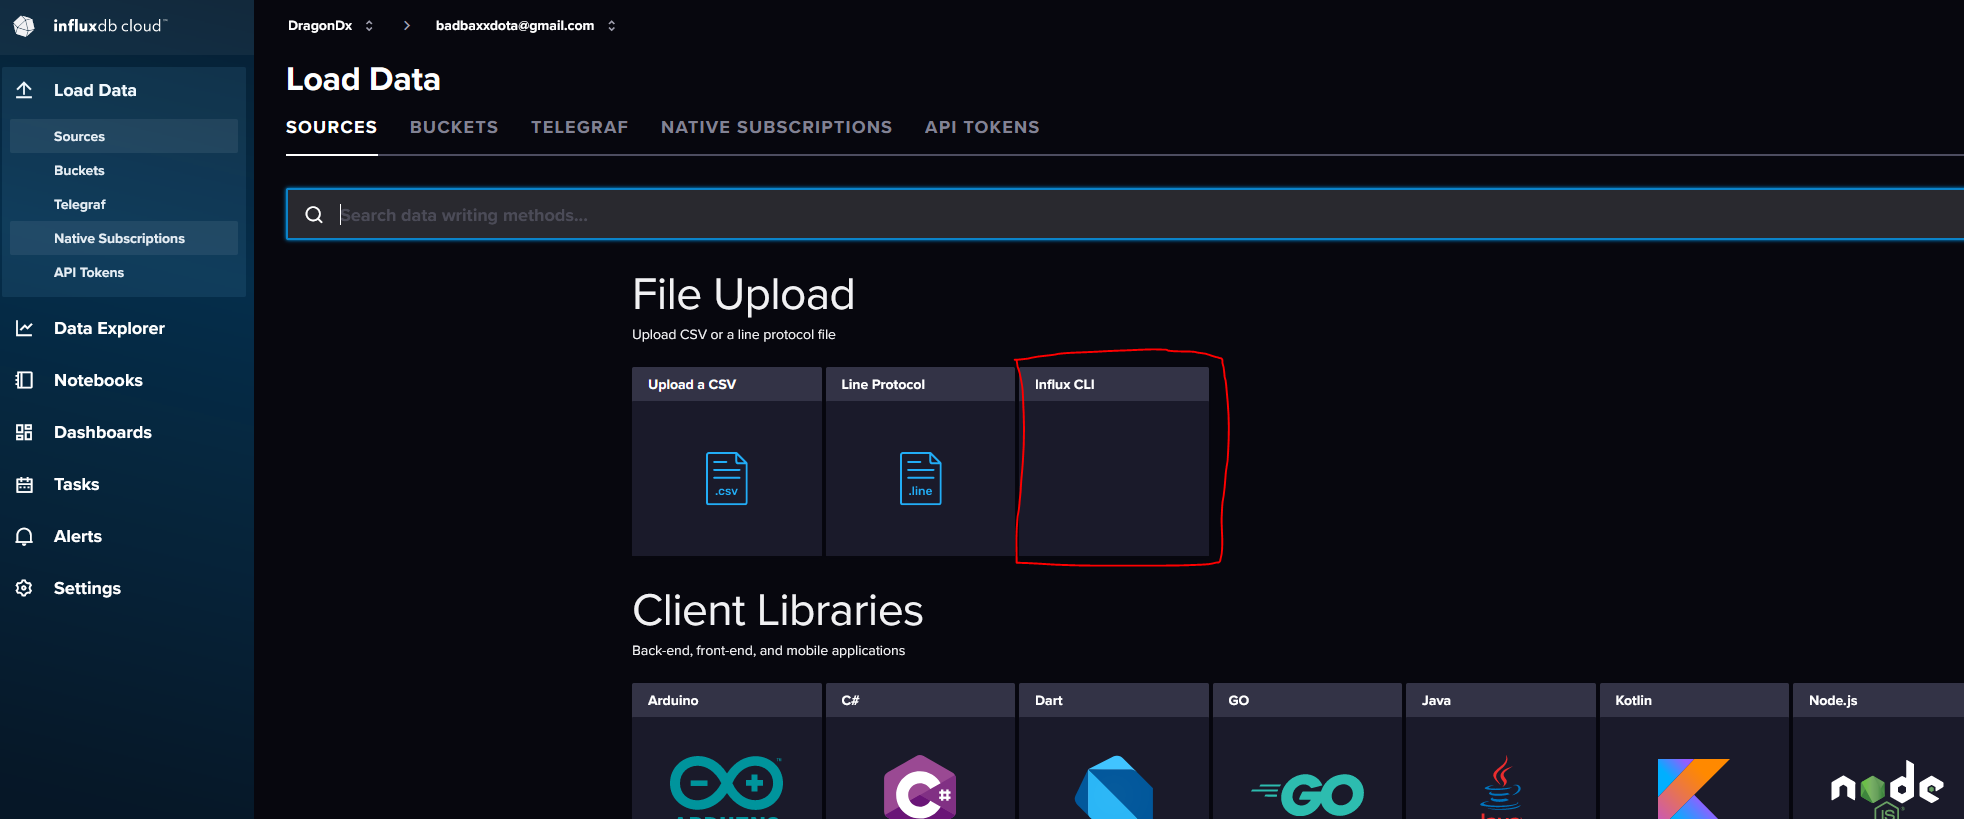
- Go to Load Data => Influx CLI and folow the instruction.
- Store the credentials of your instance in the github action
Setting -> Secrets -> Action
Sign-up for an account on grafana cloud https://grafana.com/auth/sign-up/create-user?plcmt=sub-nav
Configuration => Data source => Add data source => choose Influx DB
Query Language: Flux
URL: put the url of you influxDB instance eg "https:// eu-central-1-1.aws.cloud2.influxdata.com"
Unselect Basic auth
Organisation: the account email address you use to create the influxDB instance
Token: the token of your bucket
Default Bucket: the bucket where you store values
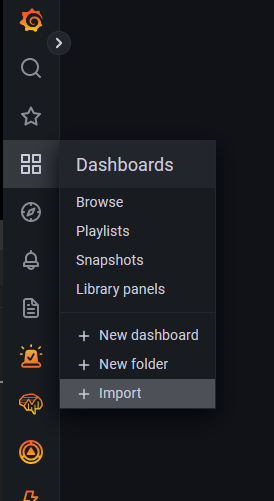
You can now import the dashboard_grafana.json or create your own dashboard based on what you want
