Washington University in St. Louis -CSE556A final project.
Name: Yitong Wang.
Please go to this link to see all images: https://github.com/TYWZ-milk/Cell_Length_Measurement. You can find all images in src/input and src/output.
Measuring length of sperm cells of fruit flies.
- What required/wish-list features I have accomplished
- Description of core algorithms
- GUI development
- How to use my tool
- Bugs and future work
- Experimental results of all images
-
A GUI interface:
Input: image
Output: visualizes the traced cell; reports cell length (in micrometer; 3.06 pixels/micrometer)
How to accomplish: Users can upload an image. After a series of operations, it will output an image which visualizes the traced cell and also reports cell length. You can see the output image in the left of the interface and cell length at the bottom of the output image.
-
Allows moderate user interaction.
How to accomplish: I provide 8 buttons and 1 input field for users in the interface. Users can do such interactions with my interface:
- Users can upload images.
- Users can increase the contrast of the image.
- Users can draw a rectangle or polygon as the outline of the cell on the image.
- Users can undo what they did.
- Users can input how many largest components they want.
- Users can clear the canvas.
- Users can draw points on the canvas by clicking the image.
- Users can download the processed images.
-
Small deviation from ground truth Works for all easy examples.
How to accomplish: We have three easy examples. All deviations are below 5%. And the deviation of 24708.1_2 at 20X.jpg is only 0.06%.
File Name 24708.1_1 at 20X.jpg 24708.1_2 at 20X.jpg 24708.1_3 at 20X.jpg My best result 2030 1786 1842 Ground truth 1951 1787 1786 Deviation 4.05% 0.06% 3.14%
-
Small deviation from ground truth Works for most of the medium examples, as many of the hard examples as possible.
How to accomplish:
For all medium examples, most deviations are below 20%. Only the deviation of 24708.1_6 at 20X.jpg is more than 20%. The best one is 24708.1_4 at 20X.jpg which only has 0.18% deviation.
Medium:
File Name 24708.1_4 at 20X.jpg 24708.1_5 at 20X.jpg 24708.1_6 at 20X.jpg WT.C.1_20x.jpg WT.C.2_20x.jpg My best result 1678 2213 2587 978 2178 Ground truth 1681 1952 1991 1090 1847 Deviation -0.18% 13.37% 29.93% -10.28% 17.92% Deviations of most hard examples are below 20%. The best one is 6.17%. But there are three hard examples which don't have a good result. The results of those three images don't have good matches with original cells. And the lengths are too large.
Hard:
File Name 28369.2.6_2.jpg 28369.2.6_3.jpg 472.1A.1_5 472.1A.1_4 LHM.1B.3_2&3 LHM.1B.3_7 472.1B.1_5&6 53387.1B.2_7&8 472.1A.1_2.jpg 42568.b4.7 472.1A.1_3 My best result 2000 2070 1680 1541 1733 1571 2061 2088 bad result bad result bad result Ground truth 1798.116 1820.409 1827.506 1836.393 1847 1849.383 1870.82 1873.806 1721.22 1840.172 1849.996 Deviation 11.23% 13.74% -7.94% -16.07% -6.17% -15.05% 10.17% 11.43% N/A N/A N/A -
Users can draw points on images. They can use these points to build lines.
How to accomplish: Users can draw points on images and they can click "complete" button to draw lines between these points automatically. But users can't change the color and width of lines.
-
GUI interface has some helpful buttons like redo button, eraser button.
How to accomplish: There are some buttons to help users draw the interest-range.
- Select color: users can select the color of points and lines.
- Input the width of lines: Users can input the width of lines.
- Draw a rectangle: After clicking this button, users can draw two points by clicking on the image. After clicking the "complete" button, it will draw a rectangle on the image. Those two points are diagonal points of the rectangle.
- Draw a polygon: After clicking this button, users can draw as many points as they want by clicking on the image. After clicking the "complete" button, it will draw a polygon on the image. Those points are points of the polygon.
- Undo: If users want to delete points what they drew before, they can click "undo" button. It will undo what you did.
- Complete: After drawing points on the image, users can click this button to draw lines automatically.
- Erase: After clicking this button, the canvas will be cleared.
- Download: Users can download processed images.
-
Users can draw lines on images. And they can change color and width of lines.
How to accomplish: In the step 2, users can set the color of points and lines. They can also set the width of lines. Users don't need to draw lines. My algorithms can draw lines automatically.
The core algorithms are consist of 7 algorithms.
- Adaptive threshold by mean value.
- Label components.
- Get k largest components.
- Dilate and erode.
- Build cell complex.
- Thin algorithm.
- Process the outline of the final result.
The Label components, Get k largest components, Dilate and erode, Build cell complex and Thin algorithm are what we learned in class. I just made some small changes to these algorithms to get the best result.
For example, I only count components larger than 400 pixels in size. And I used dilate algorithm three times and erode algorithm 1 time.
The most significant coding component is Adaptive threshold by mean value and Process the outline of the final result.
In order to process the image, the first step is always threshold the image. At first, my threshold algorithm is what I learned from the class. But it didn't work for some images. These images are unevenly distributed in brightness. If I set a low value as the threshold value for all pixels, then bright areas will have a lot of noise. If I set a high value as the threshold value for all pixels, then we can't see any result in dark areas.
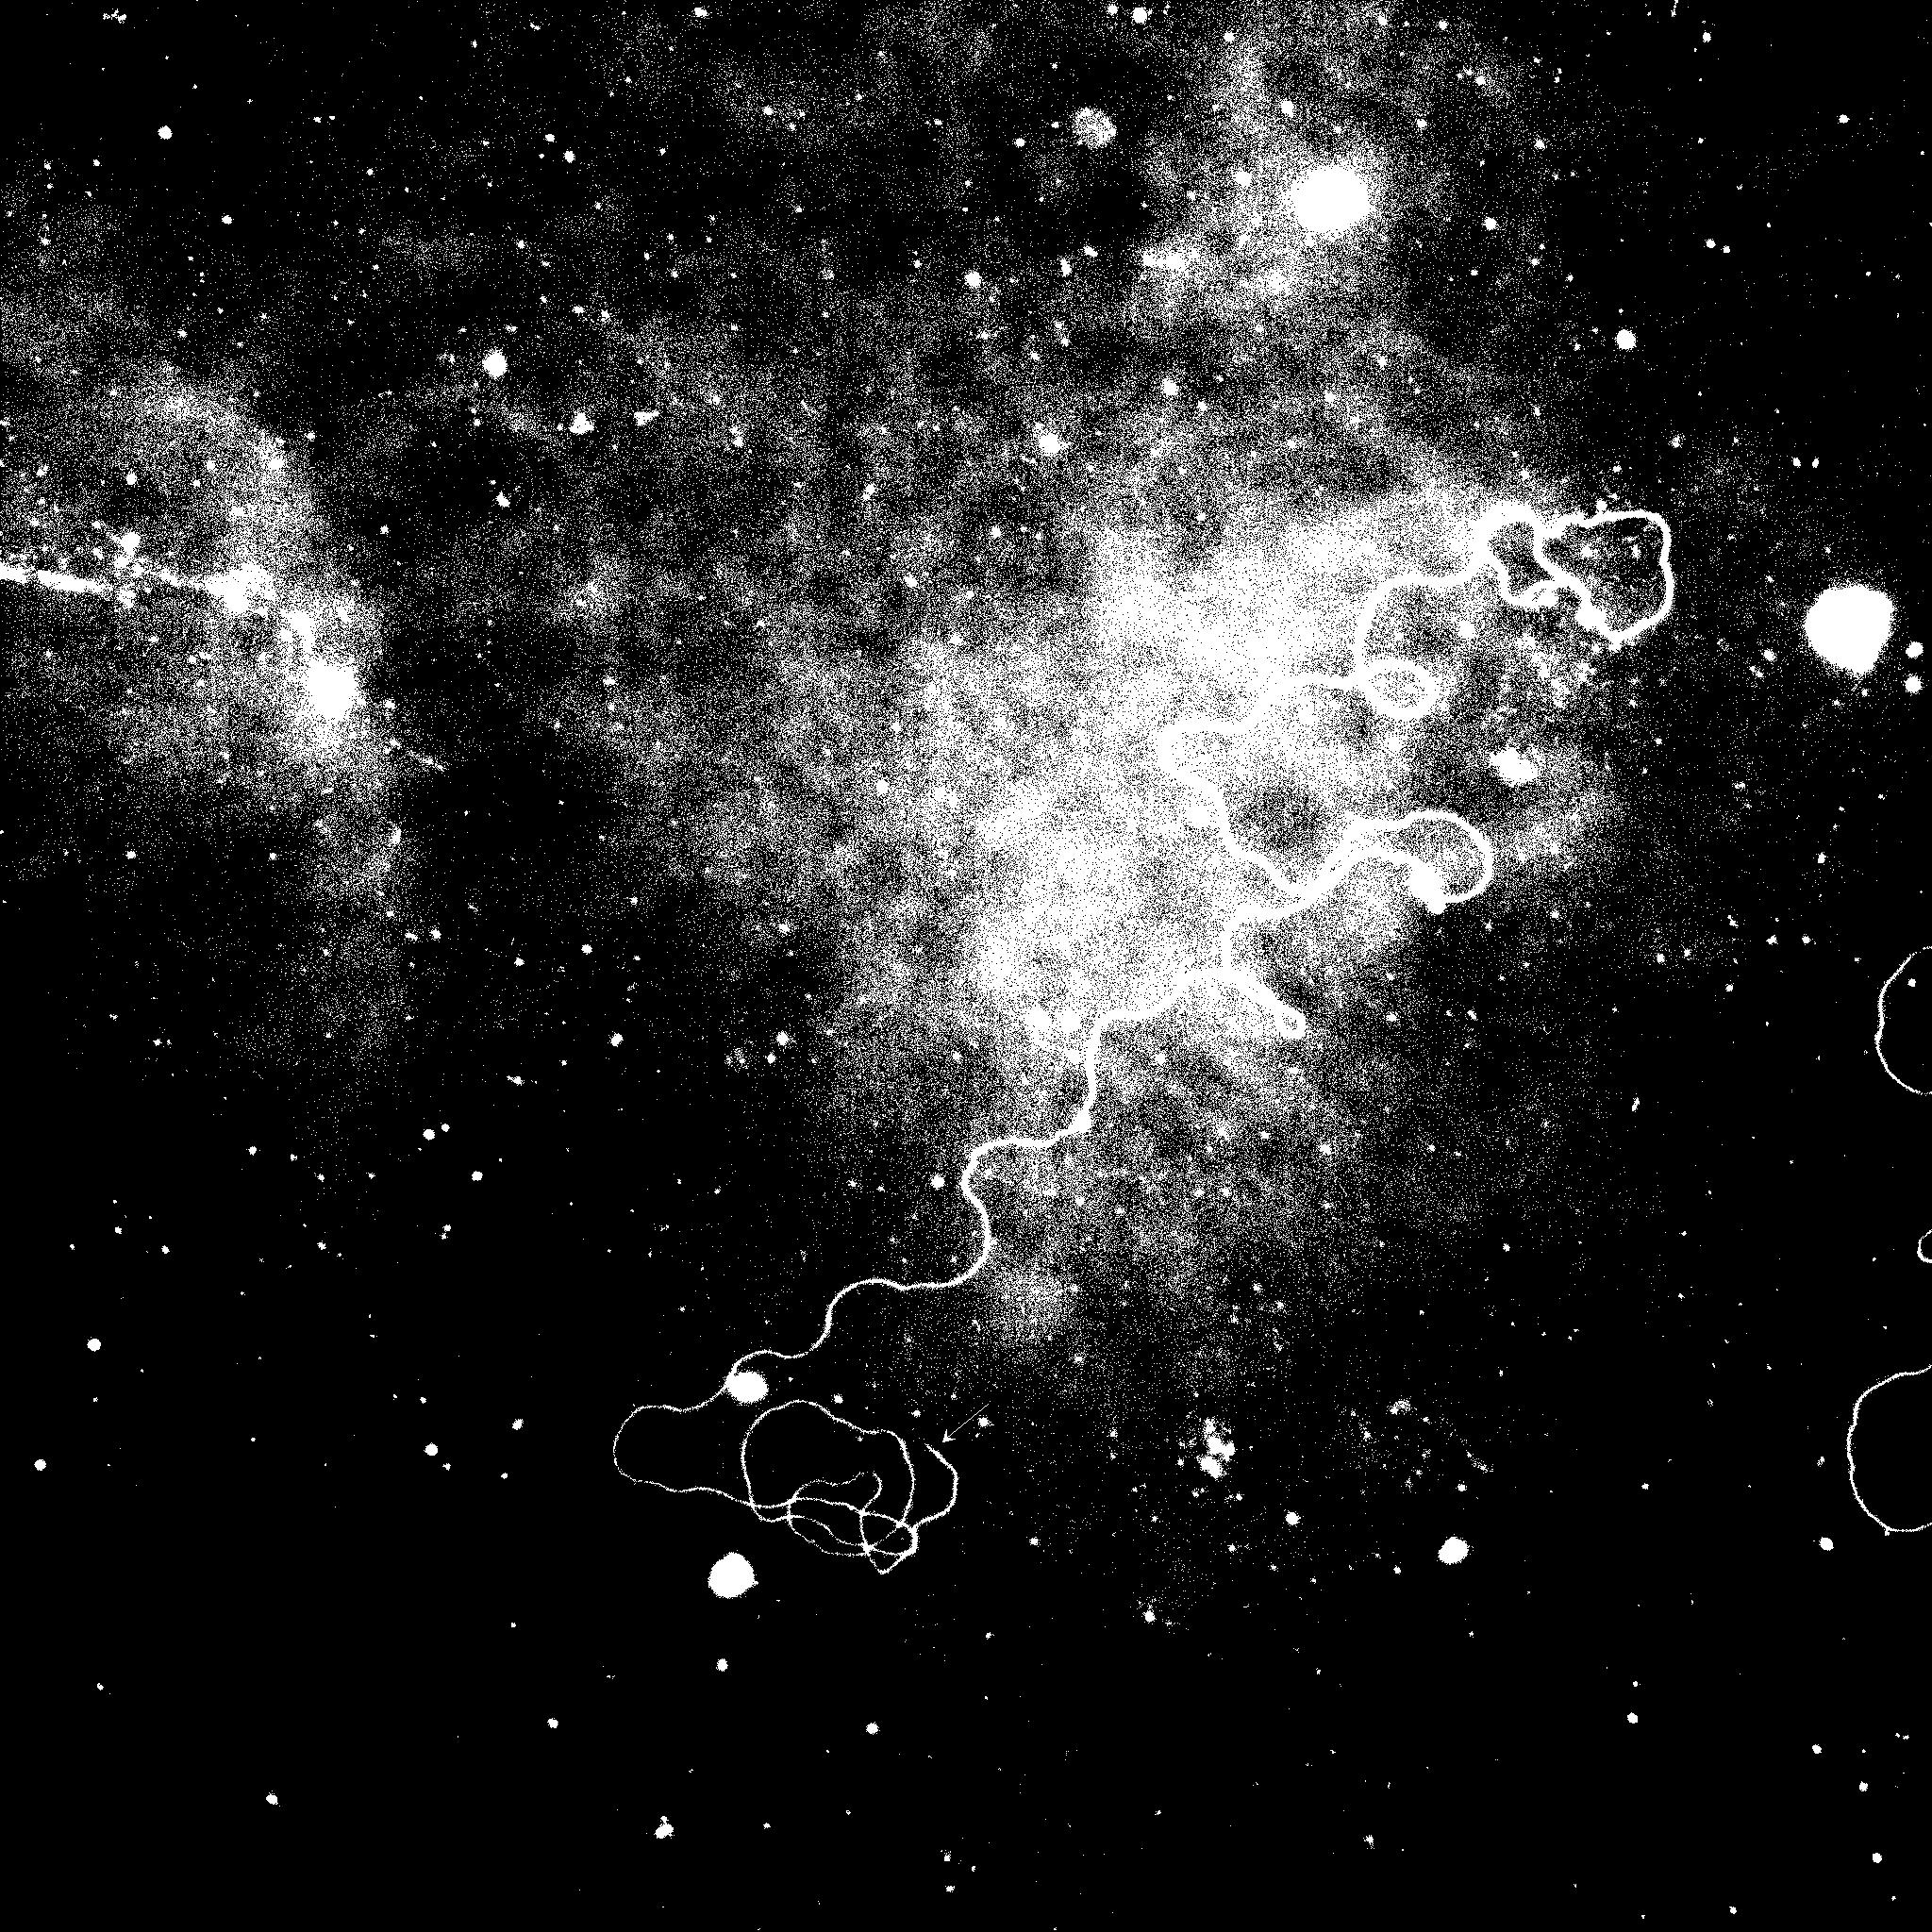
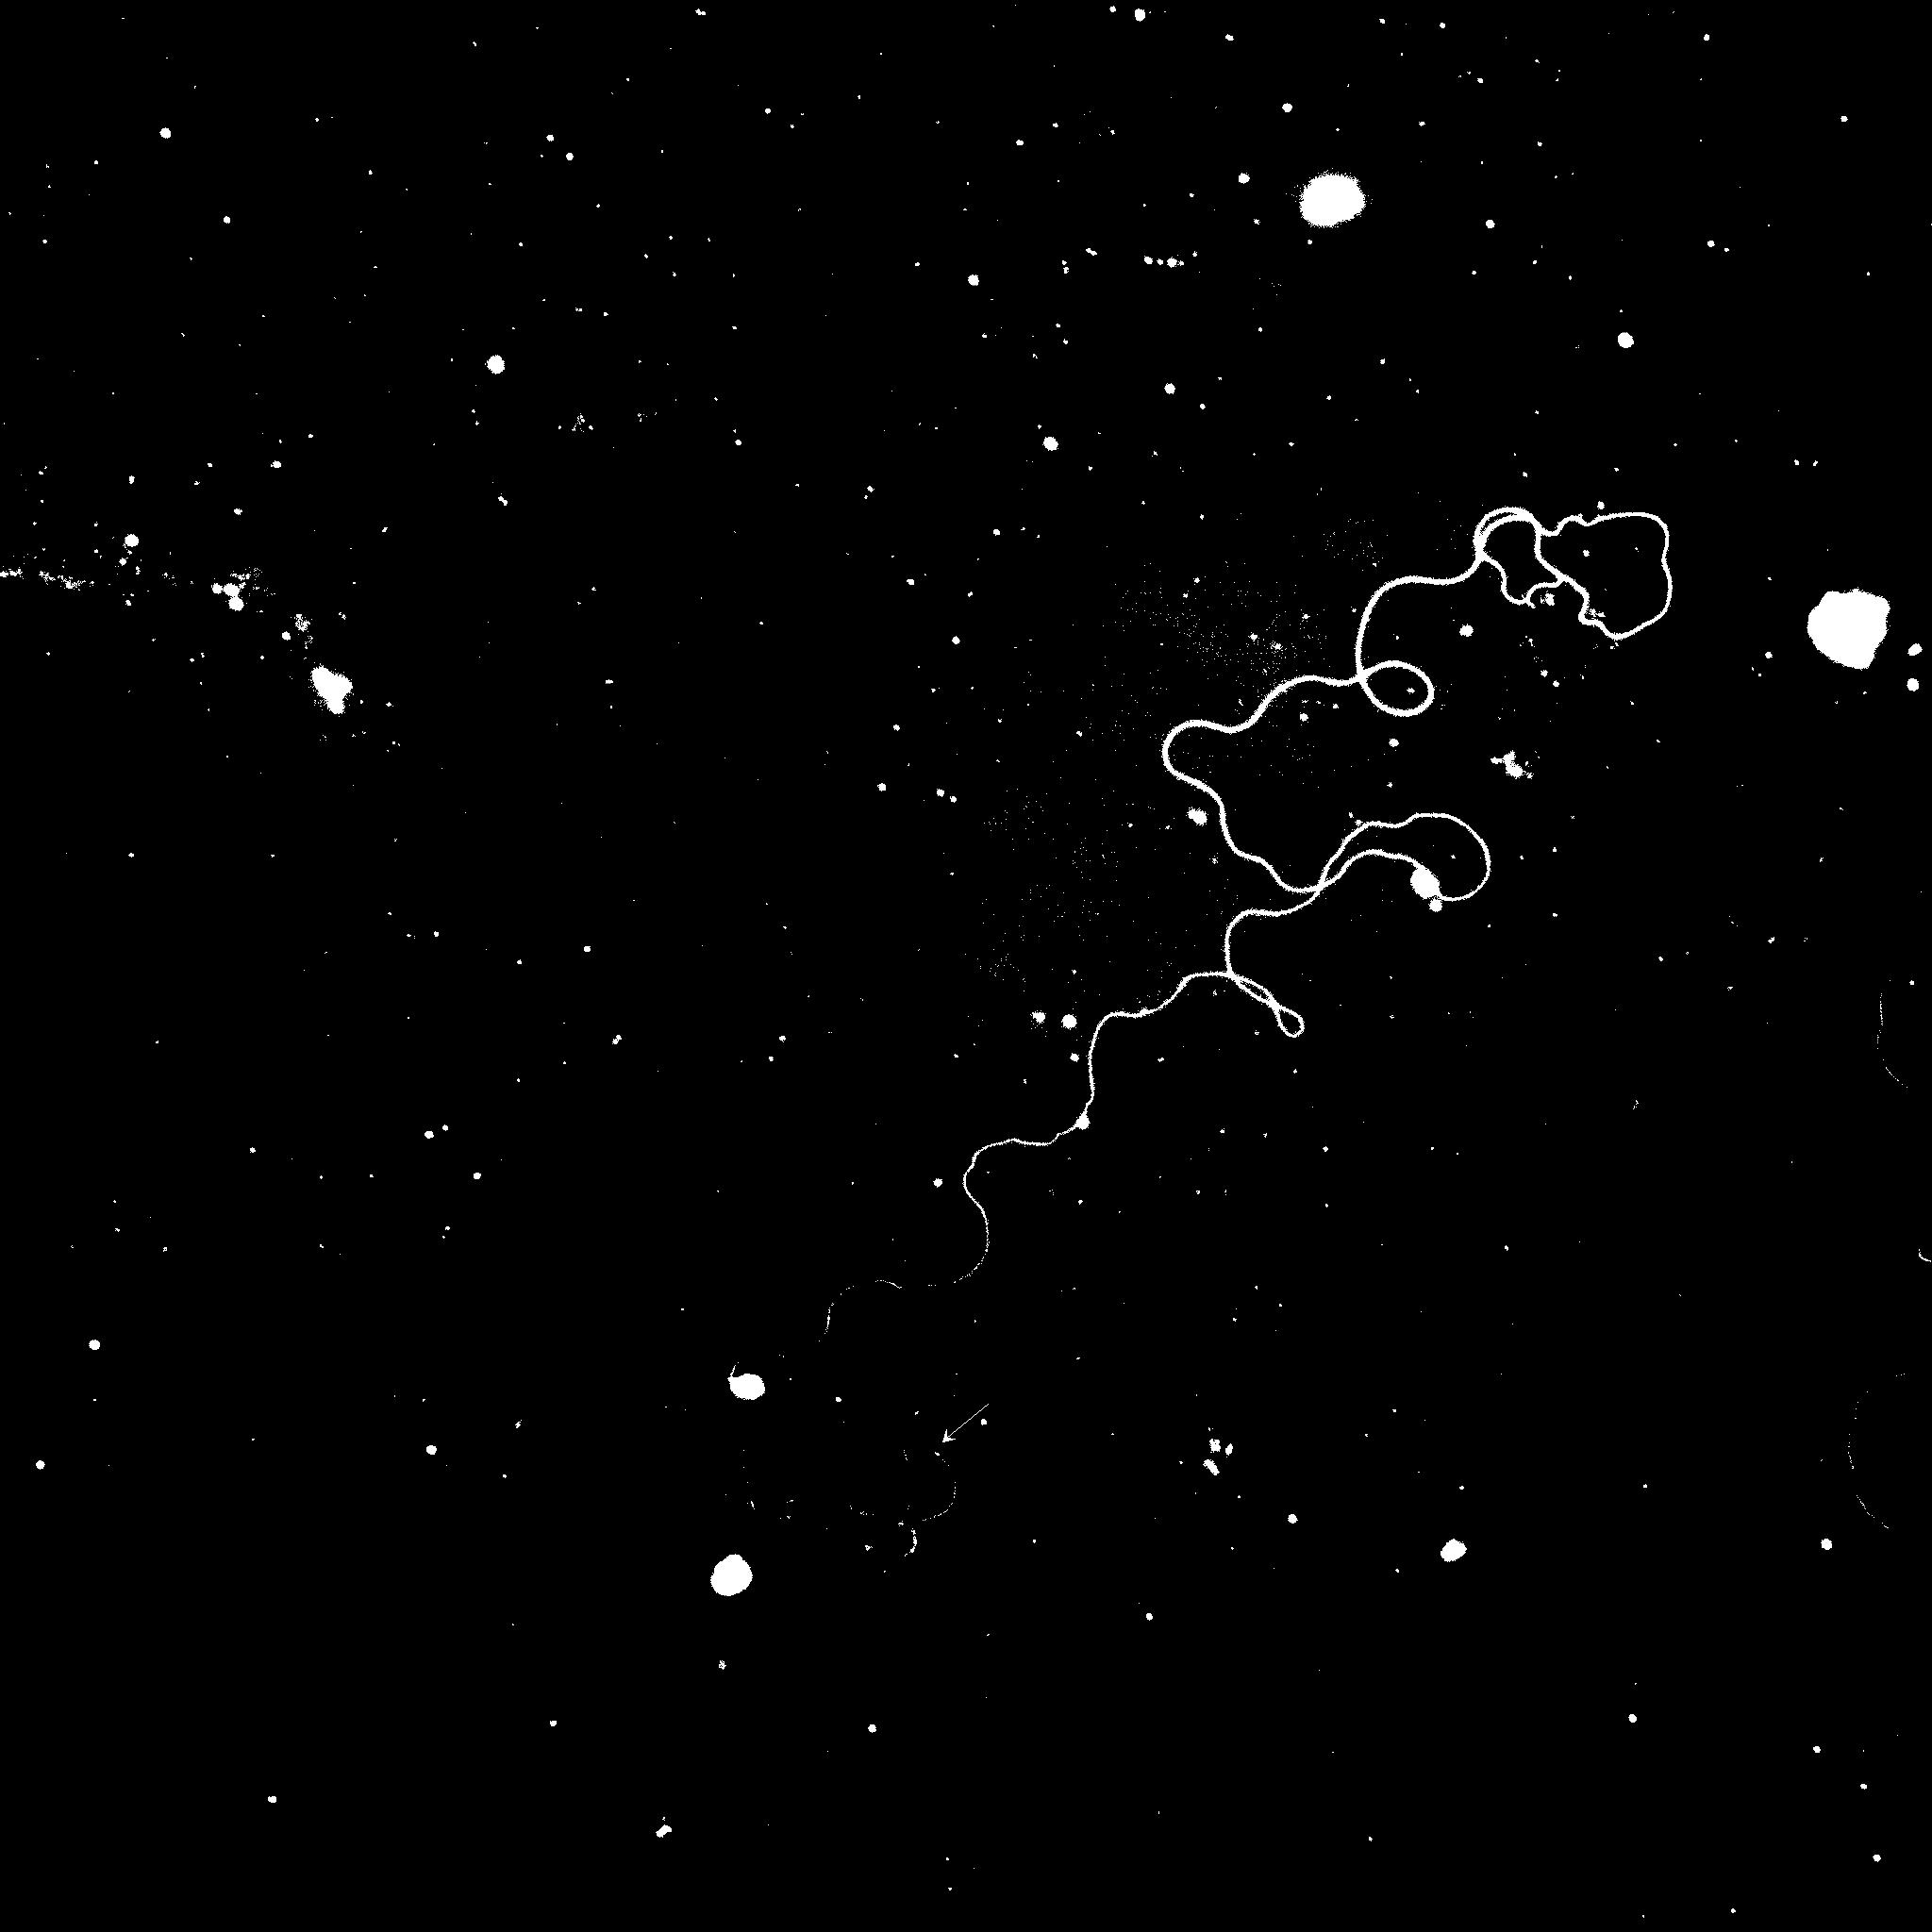
Example: 24708.1_3 at 20X.jpg
Threshold value: 155
Threshold value: 180
Therefore, I can't use the normal threshold algorithm. I noticed one important property of the cell. Whether in a bright area or a dark area, the pixel values of cell are always larger than the background. This means the pixel values of cell are always larger than the mean value of neighboring pixels. So I decided to use adaptive threshold by mean value.
Here are steps of my adaptive threshold:
-
Iterate all pixels.
a. Construct a 9x9 matrix centered on the current pixel.
b. Calculate the mean value of all pixels inside this matrix.
c. If the current pixel value is larger than the mean value, take it as the object. Otherwise, take it as the background.
d. Iterate next pixel.
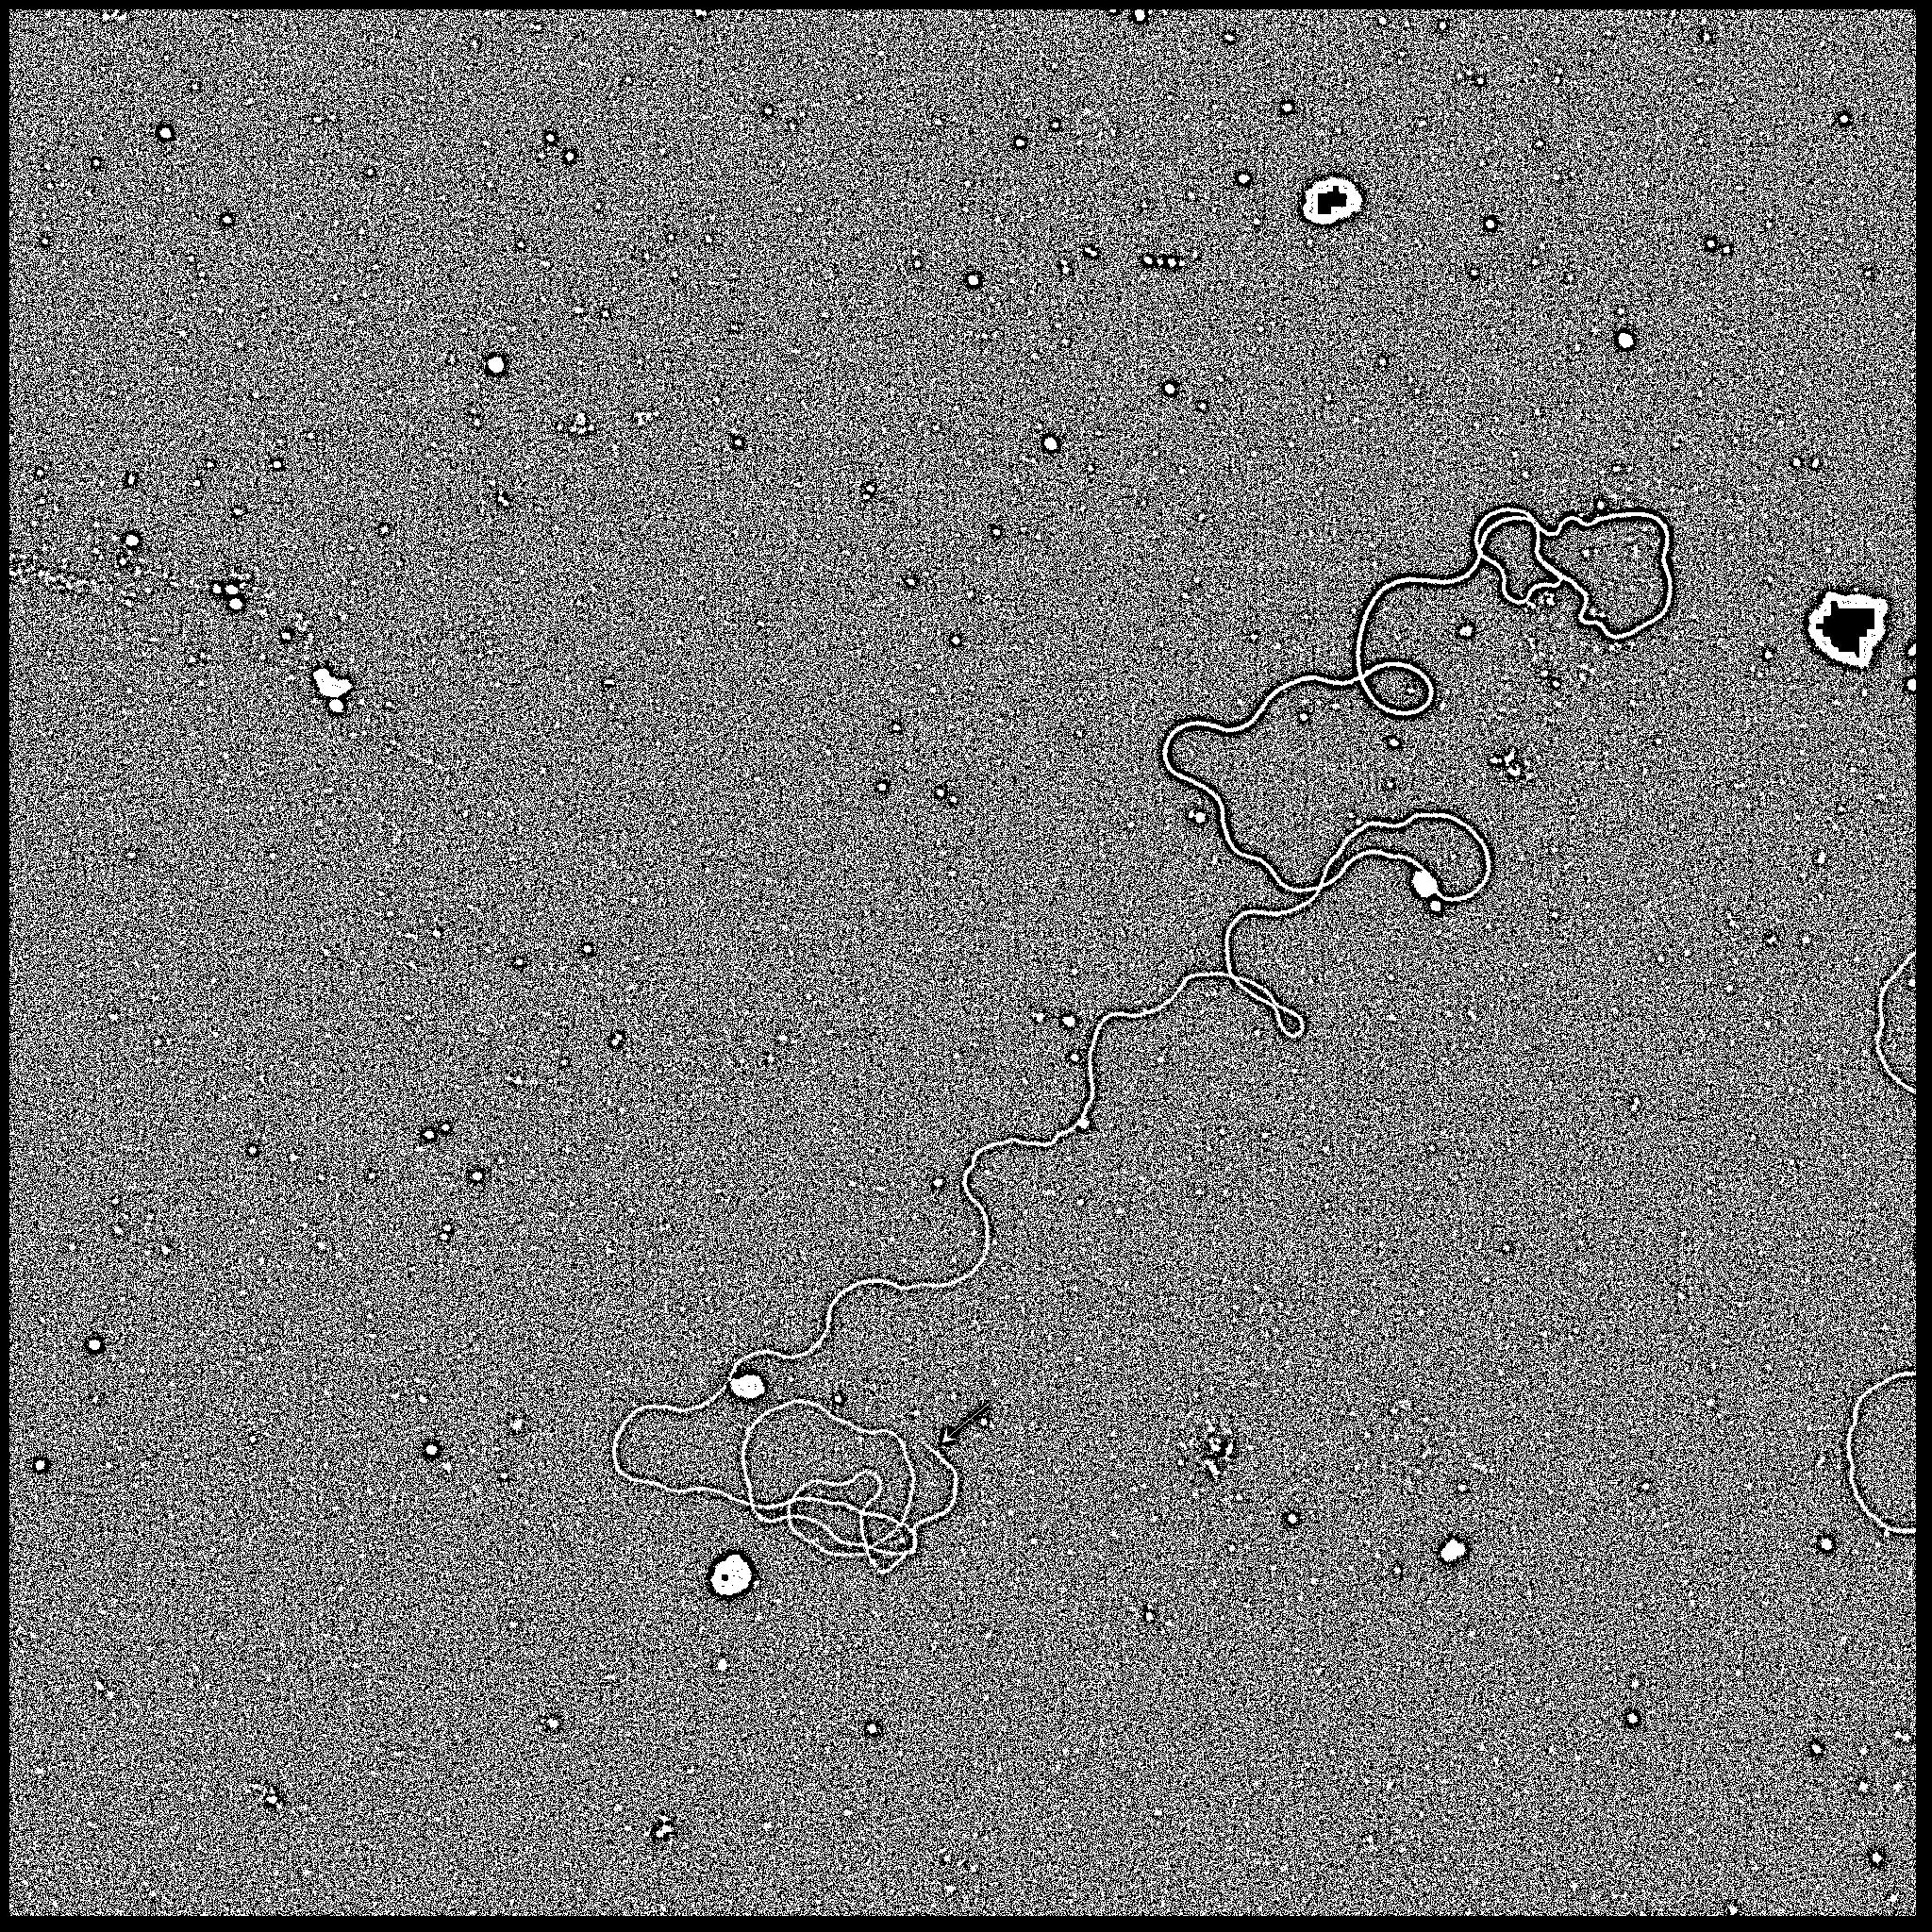
If we still use 24708.1_3 at 20X.jpg as the input, the output is:
Now it's very clear to see the cell.
The time complexity of this algorithm is O(mn). m is the width of the image, n is the height of the image.
After using the thin algorithm, my results were much larger than correct results.
I used n*Math.sqrt(2)/3.06, n is the number of piexls to calculate the length of the cell.
If we have too many pixels, this will affect our result.
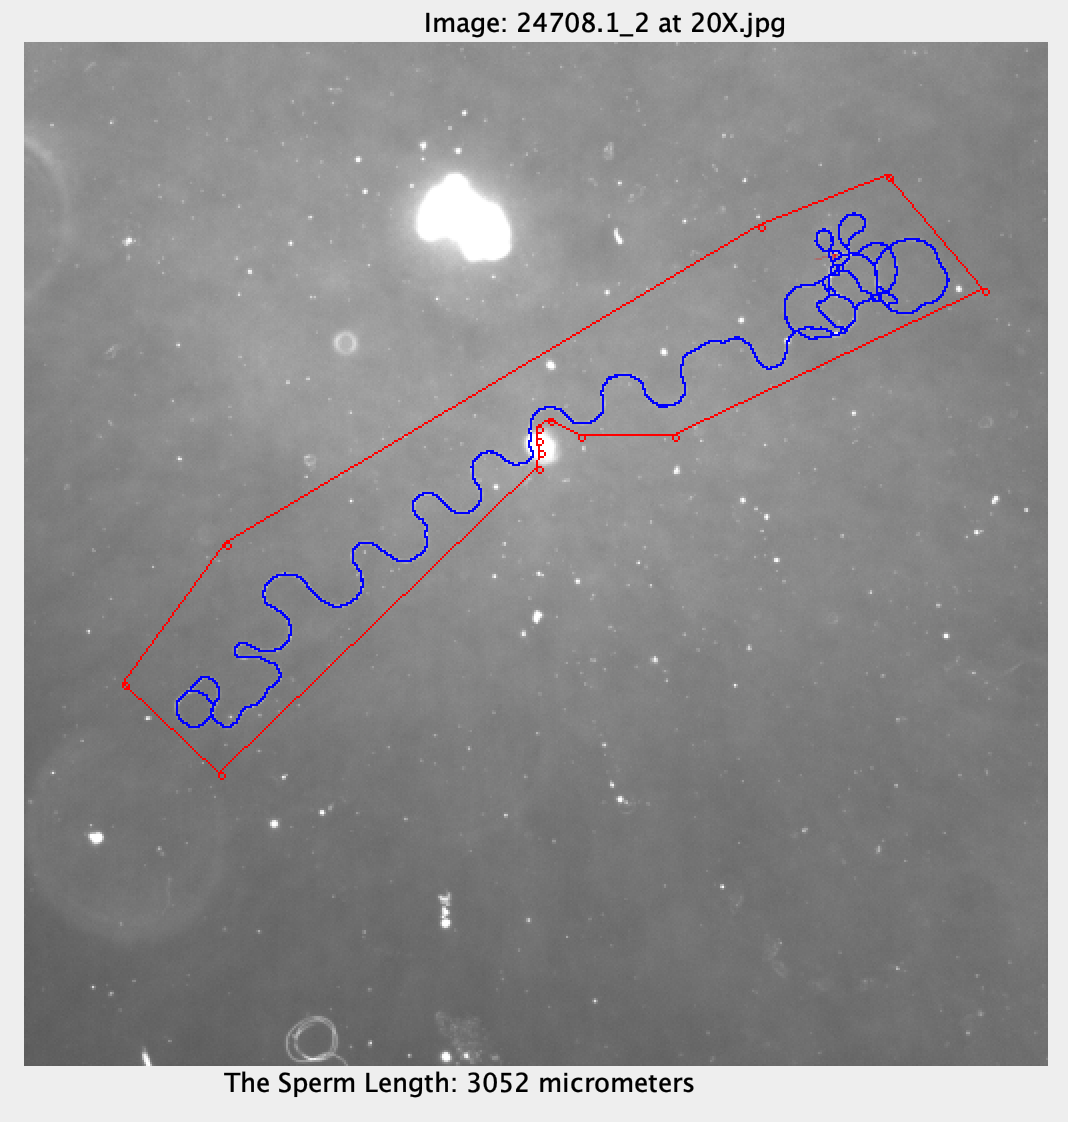
Let's see this example: 24708.1_2 at 20X.jpg.
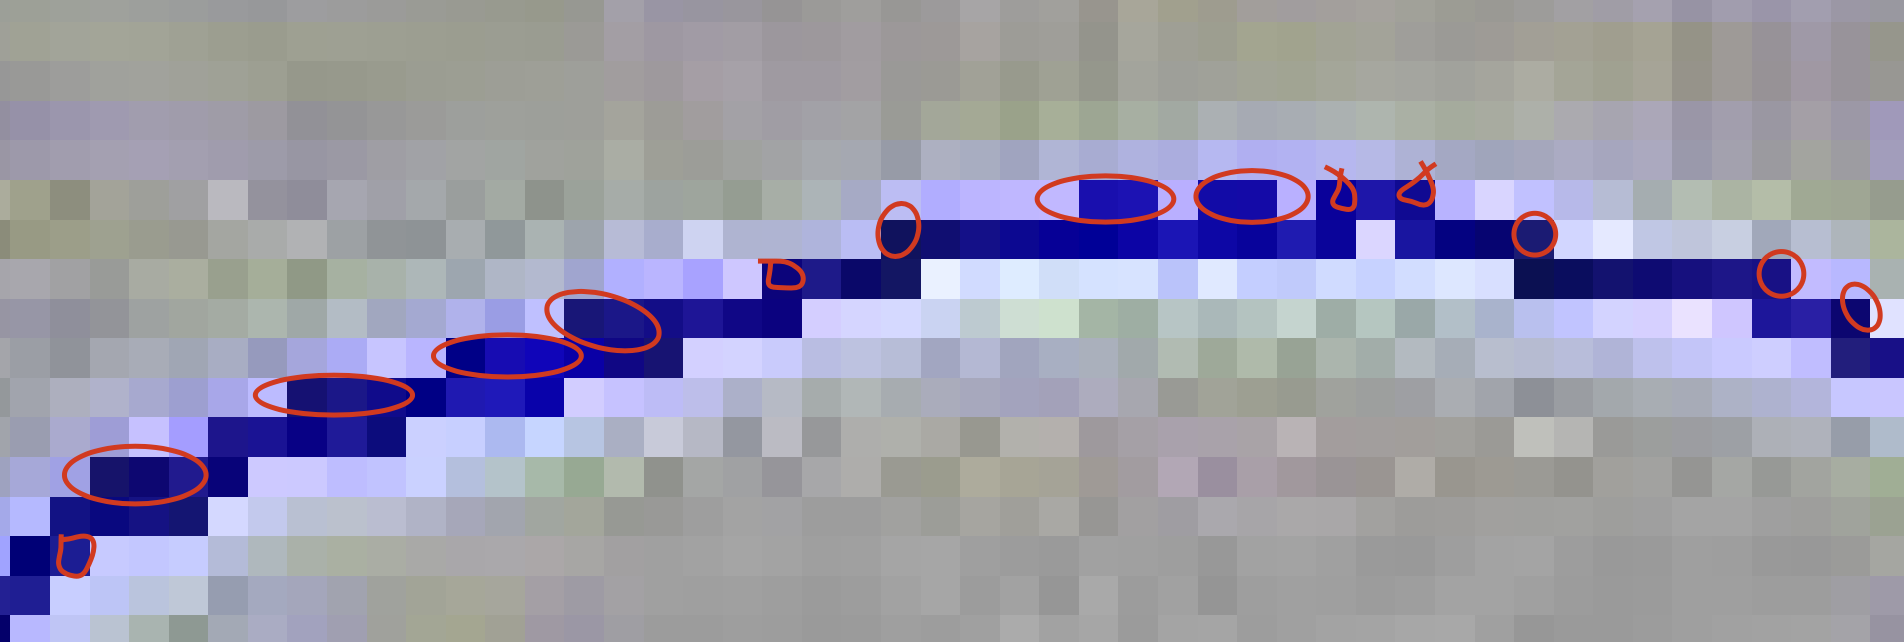
The cell looks very good. But the length is 3052 micrometers and the ground truth is 1787. The deviation is 70.79%. If we zoom in, you will see something like this.
I drew some red circles on this image. I think these pixels can be deleted. I think we still can build a good cell outline if most pixels only have 2 neighboring pixels.
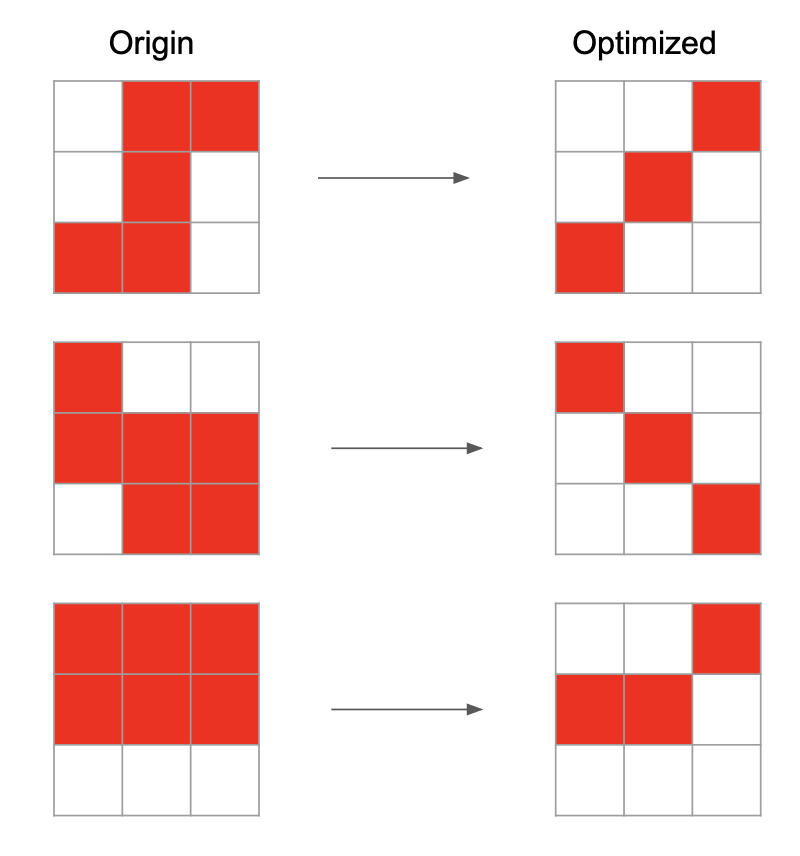
I drew some examples here:
Therefore, I think most pixels can be reduced to only have 2 neighboring pixels.
The step of my algorithm is:
-
Construct a boolean matrix for the image. The default value is false.
-
Iterate the result from thin algorithm. For each position (x,y) in the result, matrix[x][y]=true.
-
Iterate all pixels of image.
a. If matrix[x][y]= false, skip this position.
b. If matrix[x][y]= true, find all its neighboring pixels.
c. If the number of neighboring pixels are larger than 2, I only save 2 neighboring pixels. For all rest neighboring pixels, set matrix[neighborx][neighbory] = false.
-
Iterate the matrix, if matrix[x][y] = true, position (x,y) is part of our result. Otherwise, it's the background.
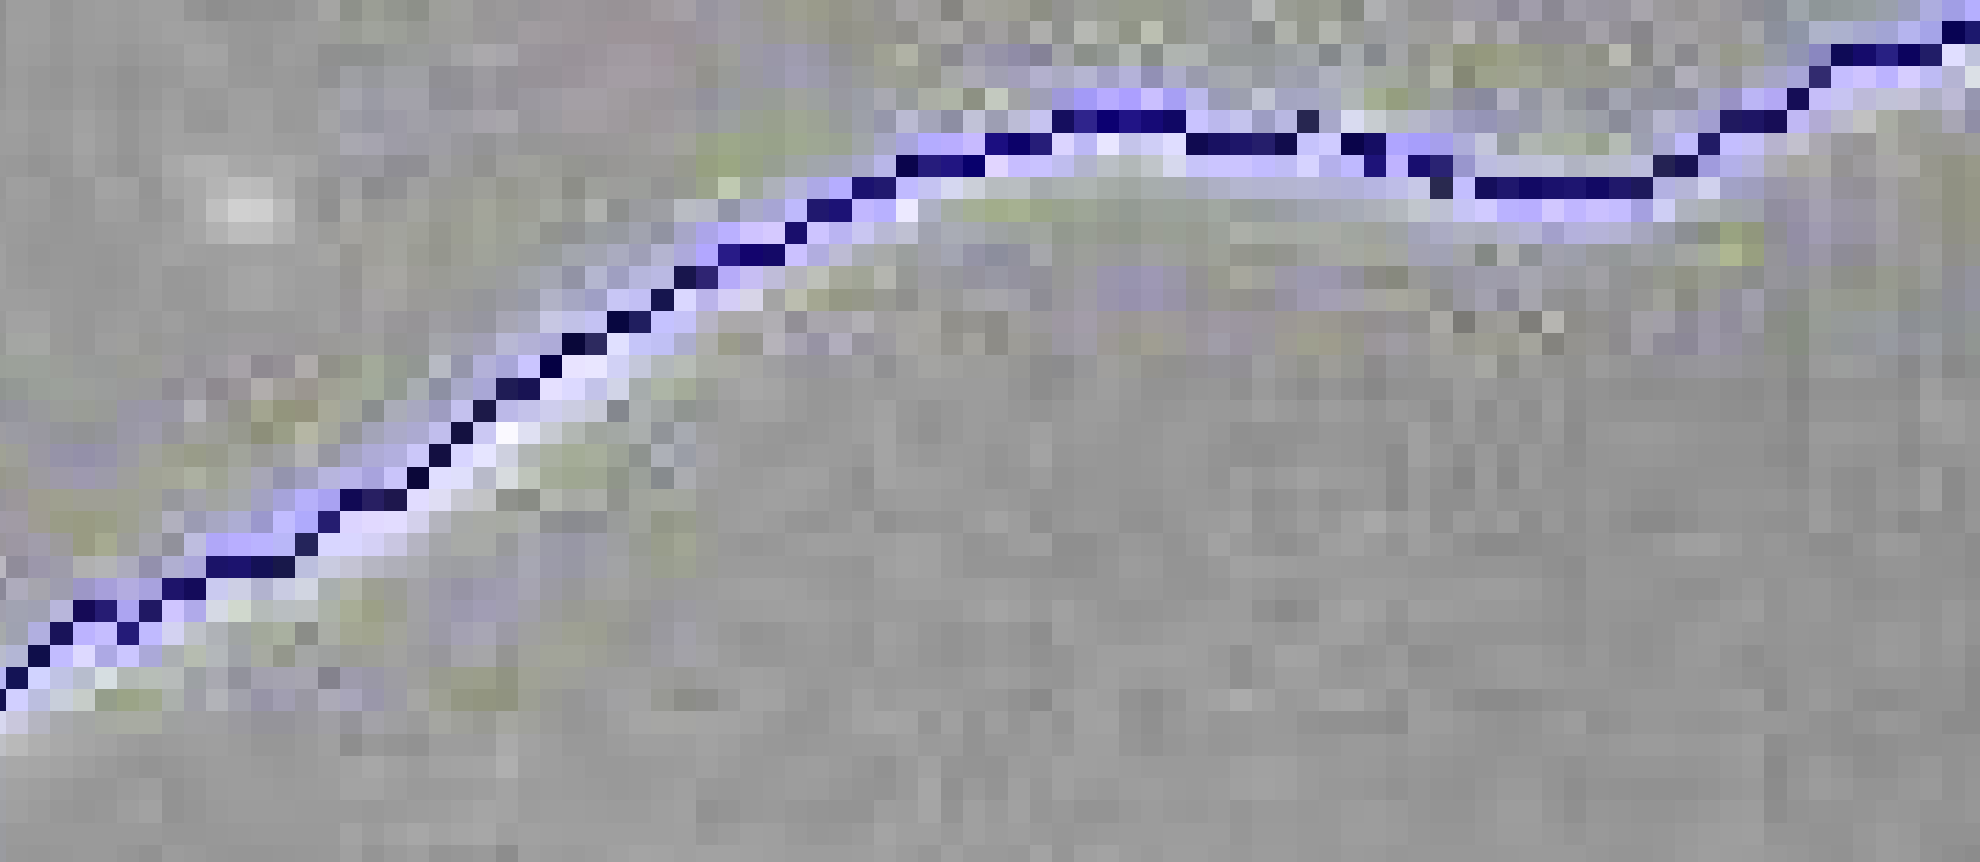
After using my algorithm, the result in the same region is:
I deleted most meaningless pixels. This one looks like a real cell. But I still need to continue to optimize the algorithm, because you can see that there are some places where it is broken.
Let's use this algorithm on 24708.1_2 at 20X.jpg again. We get a very perfect result. The deviation is less than 1%.
I use JFrame and JLabel in Java to develop my GUI. You can find all code in GUI.java.
Step 1:
- Upload button: By clicking this button, you can upload an image from your machine.
- Increase contrast: By using RescaleOp in Java, I increase the contrast of the current image 1.2f each time.
Step 2:
- Select Color: Users can select the color of points and lines, there are six colors.
- Input the width of lines: Users can input the width of lines.
- Draw a rectangle: If you are interested in one area, you can draw a rectangle range. You are able to draw a rectangle by two diagonal points of the rectangle. After clicking this button, you can draw two points on the image. These two points are diagonal points of your rectangle range. Then you can click 'Complete' button, it will draw a rectangle automatically.
- Draw a polygon: Same as the 'Draw a rectangle'. You can draw a polygon and the shape of the polygon is decided by you. After clicking this button, you can draw as many point as you want on the image. These points are points of the polygon. Remember you need to draw your points clockwise or counterclockwise, because I will connect these points in the order in which you draw them to form a polygon. Then you can click 'Complete' button, it will connect points automatically.
- Undo: Delete points you just drew.
- Complete: After drawing points, click this button to form a range.
Step 3:
- Input k value: Input the k value. k is how many largest components you want to get. For different images, you may want to specific different k value to get the best results.
Step 4:
- Run: After clicking this button, I will use my algorithms to process your image and display the output on the image.
- Erase: Clear the canvas. Delete all points, lines on the image.
- Download: After clicking this button, my program will download your processed images in your current folder. The name of new image is "result_[your file name].png".
Text & Image:
After you upload your image, you will see it on the right of the GUI. And you will see the name of this image at the top and the length of the cell at the bottom
My code used Java language. Make sure your machine can run Java program. The version of my SDK is 11.
-
Download the code. Run 'GUI.java' in your IDE. My IDE is IntelliJ IDEA. After downloading, I need to specific the source and output folder and SDK in File-> Project Structure.
-
You can see my interface. Now, click the button 'Upload' to upload an image. After uploading, you will see your image at the right of the interface.
-
Optional: If you think your image is too dark, click "Increase Contrast". You can click that button as many times as you want. And you will see your result at the right of the interface.
-
Draw the interest-range.
a. Select the color and width of your points and lines.
b. If you want to draw a rectangle range, click "Draw a rectangle". And then you can draw only two points on the image. These two points are diagonal points of the rectangle range. Then you can click 'Complete' button, it will draw a rectangle automatically.
c. If you want to draw a polygon range, click "Draw a polygon". After clicking this button, you can draw as many point as you want on the image. These points are points of the polygon. Remember you need to draw your points clockwise or counterclockwise, because I will connect these points in the order in which you draw them to form a polygon. Then you can click 'Complete' button, it will connect points automatically.
-
Optional: If you draw a wrong point, you can click "Undo" button to delete it. You can undo as many times as you want until there are no points on the image.
-
Input k value. The range of k value is from 1 to 10. Different images may have different k values to get the best results.
-
Click 'Run' button. After clicking this button, I will use my algorithms to process your images. And you will see the cell on the image which you uploaded before. You will also see the length of the cell at the bottom of the image.
-
Click 'Erase' button to clear the canvas. You can continue to draw a new range or upload a new image.
-
Click 'Download' button to download processed images.
-
Like what I said about my
Process the outline of the final result, this algorithm can continue to be optimized. I can't prove the correctness of this algorithm. And I don't have enough data to prove its result. It's not a bug. But in the future, we can continue to work on this algorithm. Make sure we will not see some broken parts in the cell. -
My algorithms can't handle the huge debris which is connected with the cell. We can continue to find a good way to handle this kind of debris.
-
For some images which are very dark, my algorithms can't output good results. We can continue to work on this in the future to find a better way to handle the dark image.
| File Name | 24708.1_1 at 20X.jpg | 24708.1_2 at 20X.jpg | 24708.1_3 at 20X.jpg |
|---|---|---|---|
| My best result | 2030 | 1786 | 1842 |
| Ground truth | 1951 | 1787 | 1786 |
| Deviation | 4.05% | 0.06% | 3.14% |
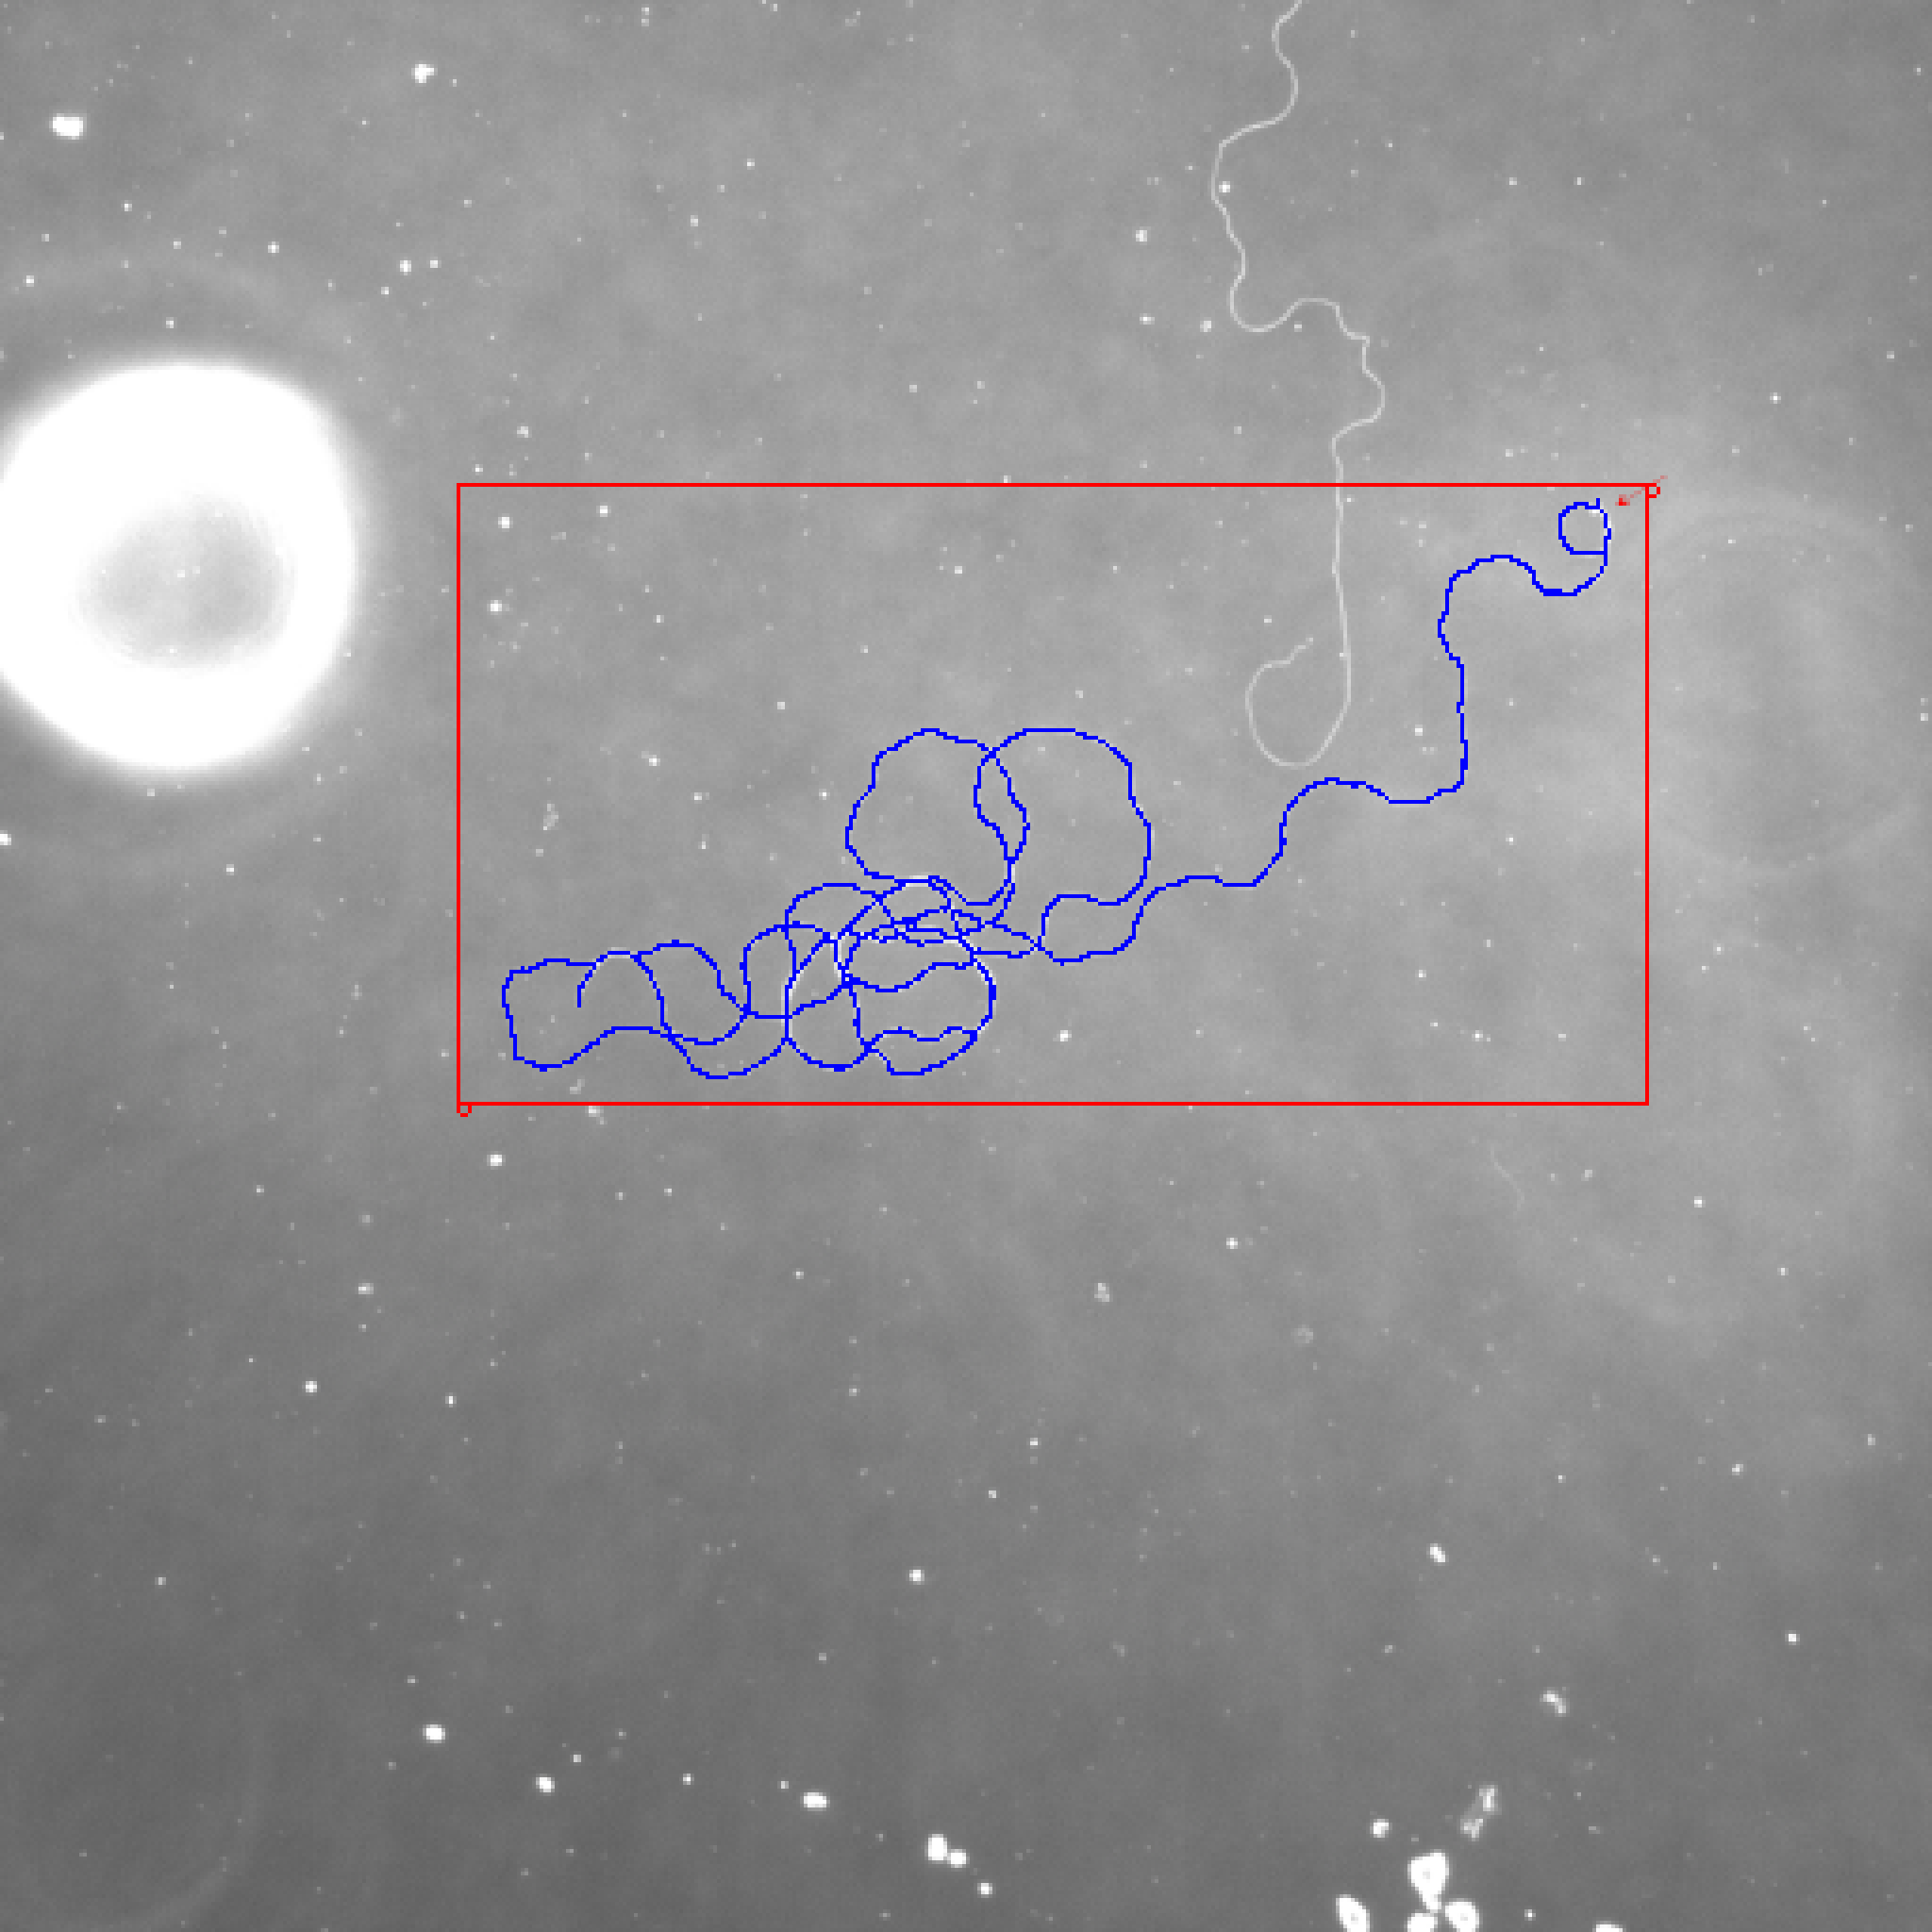
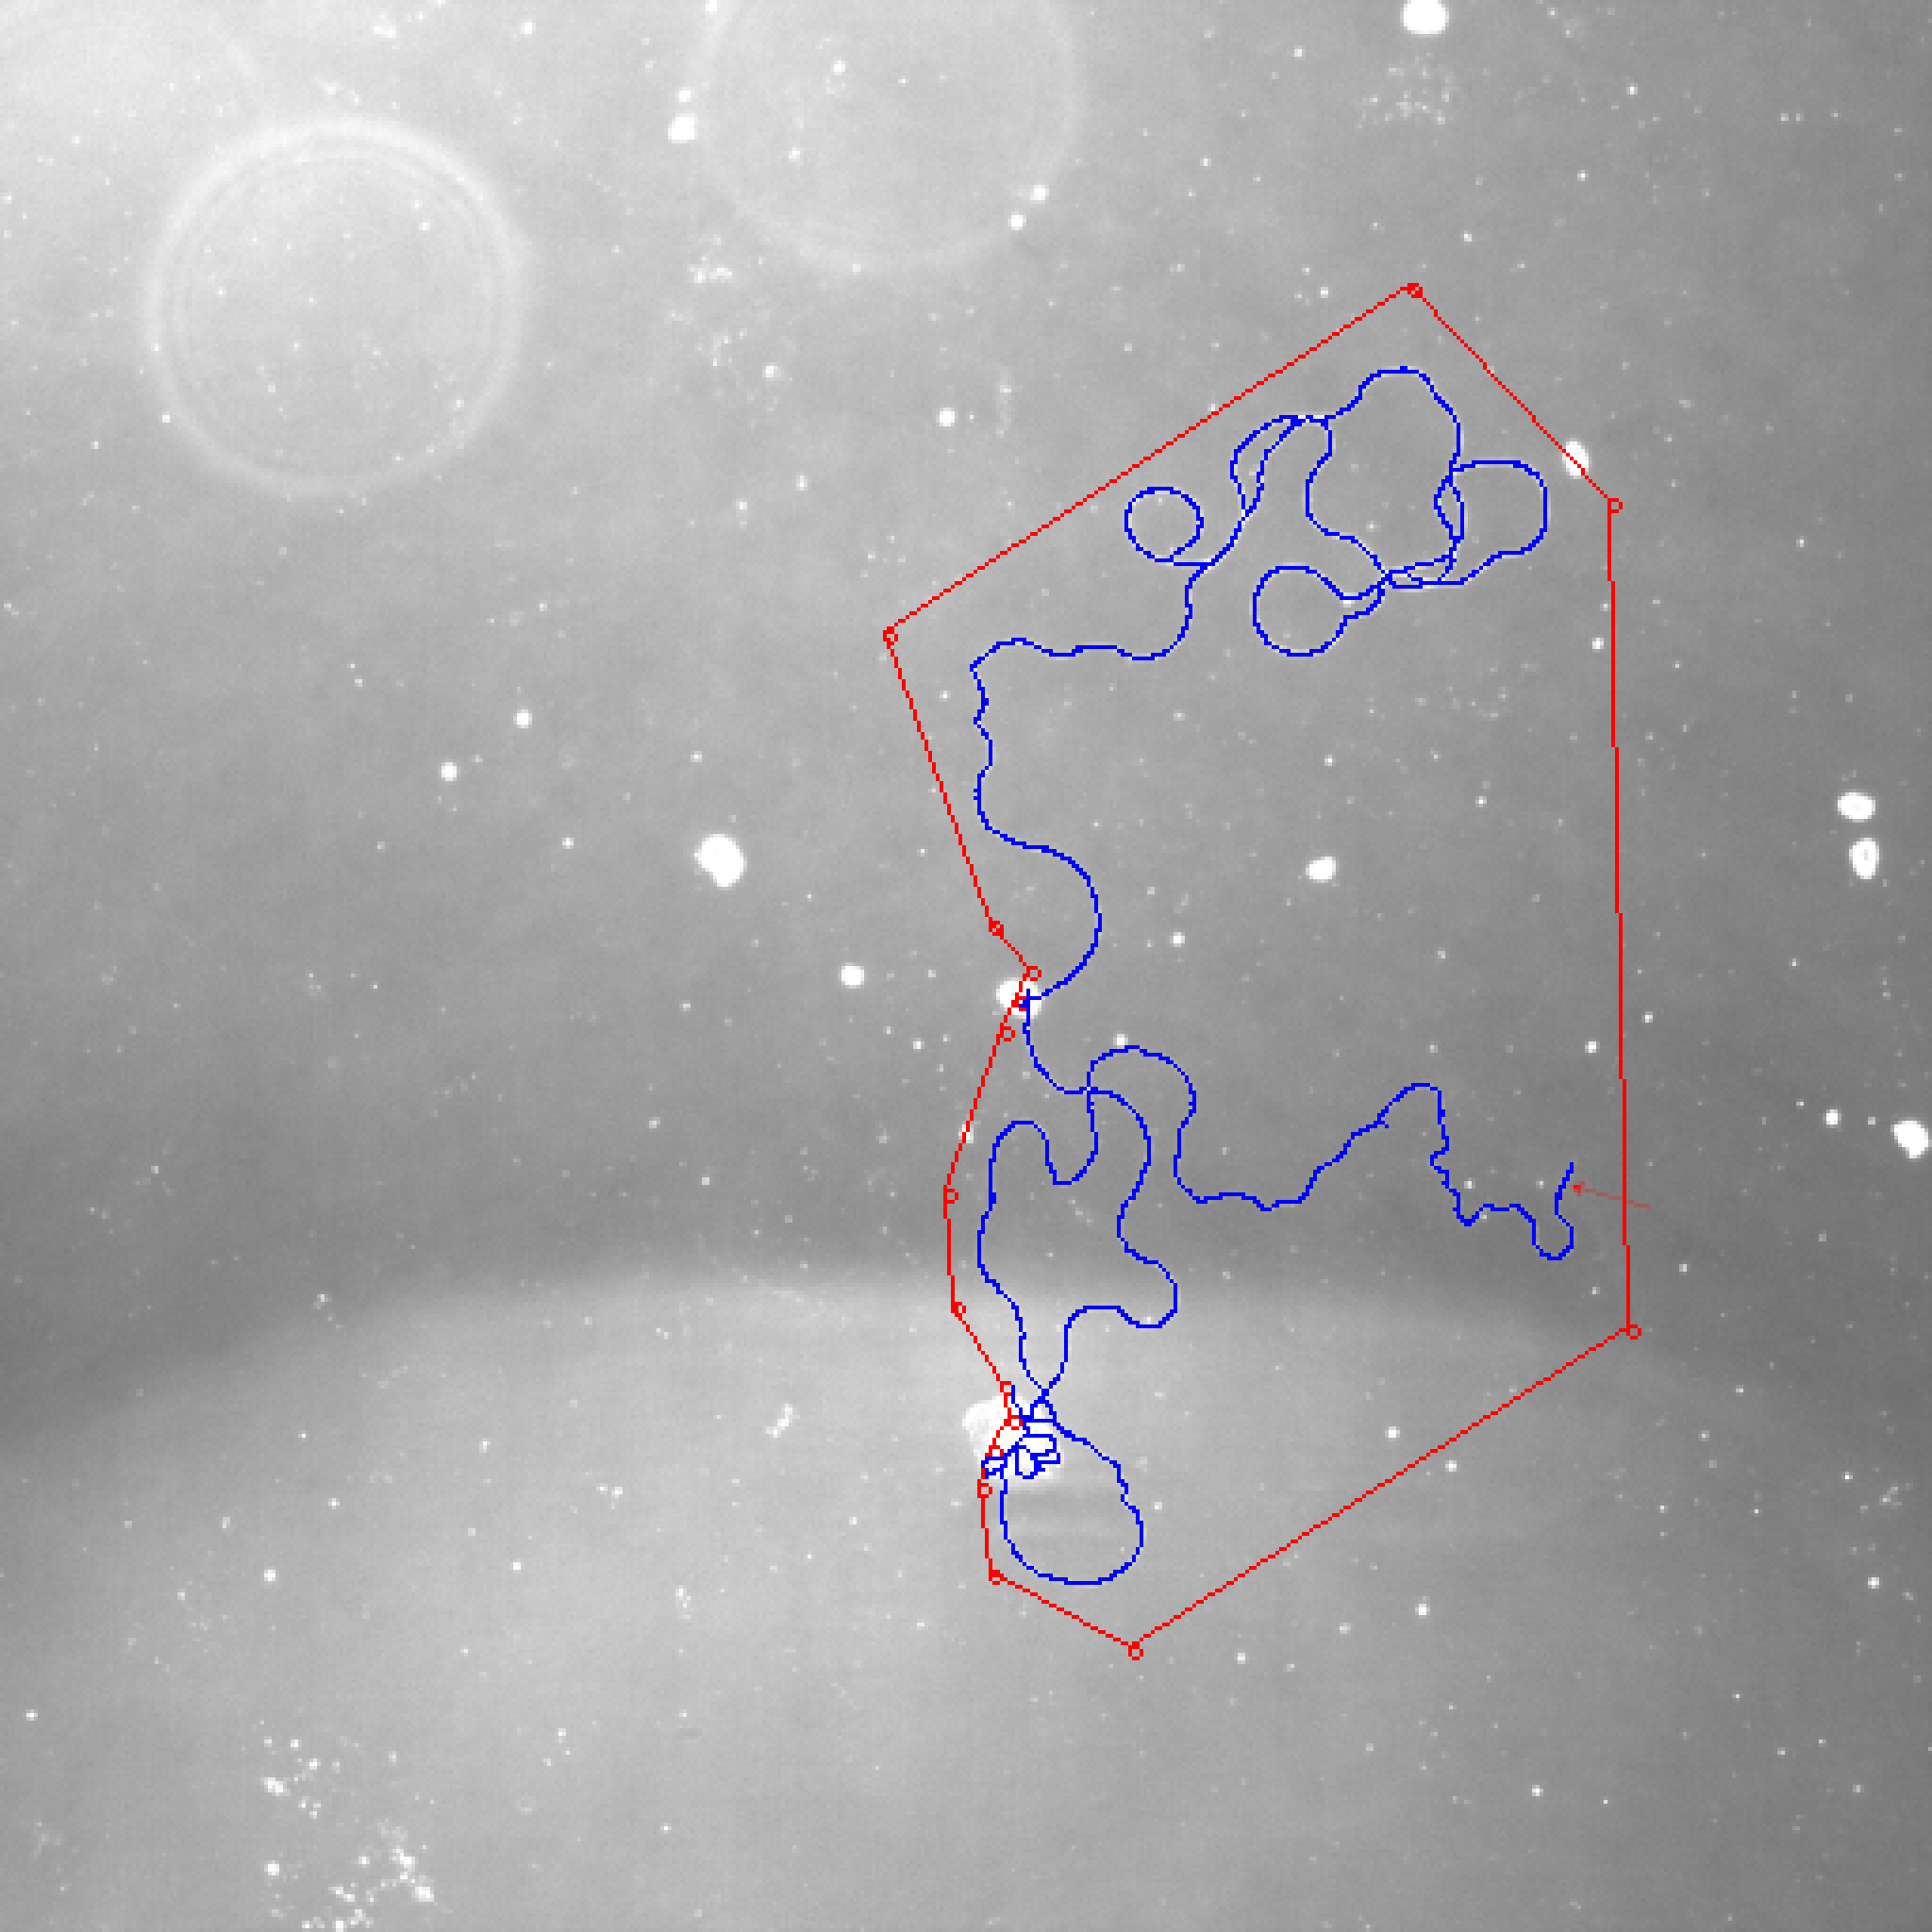
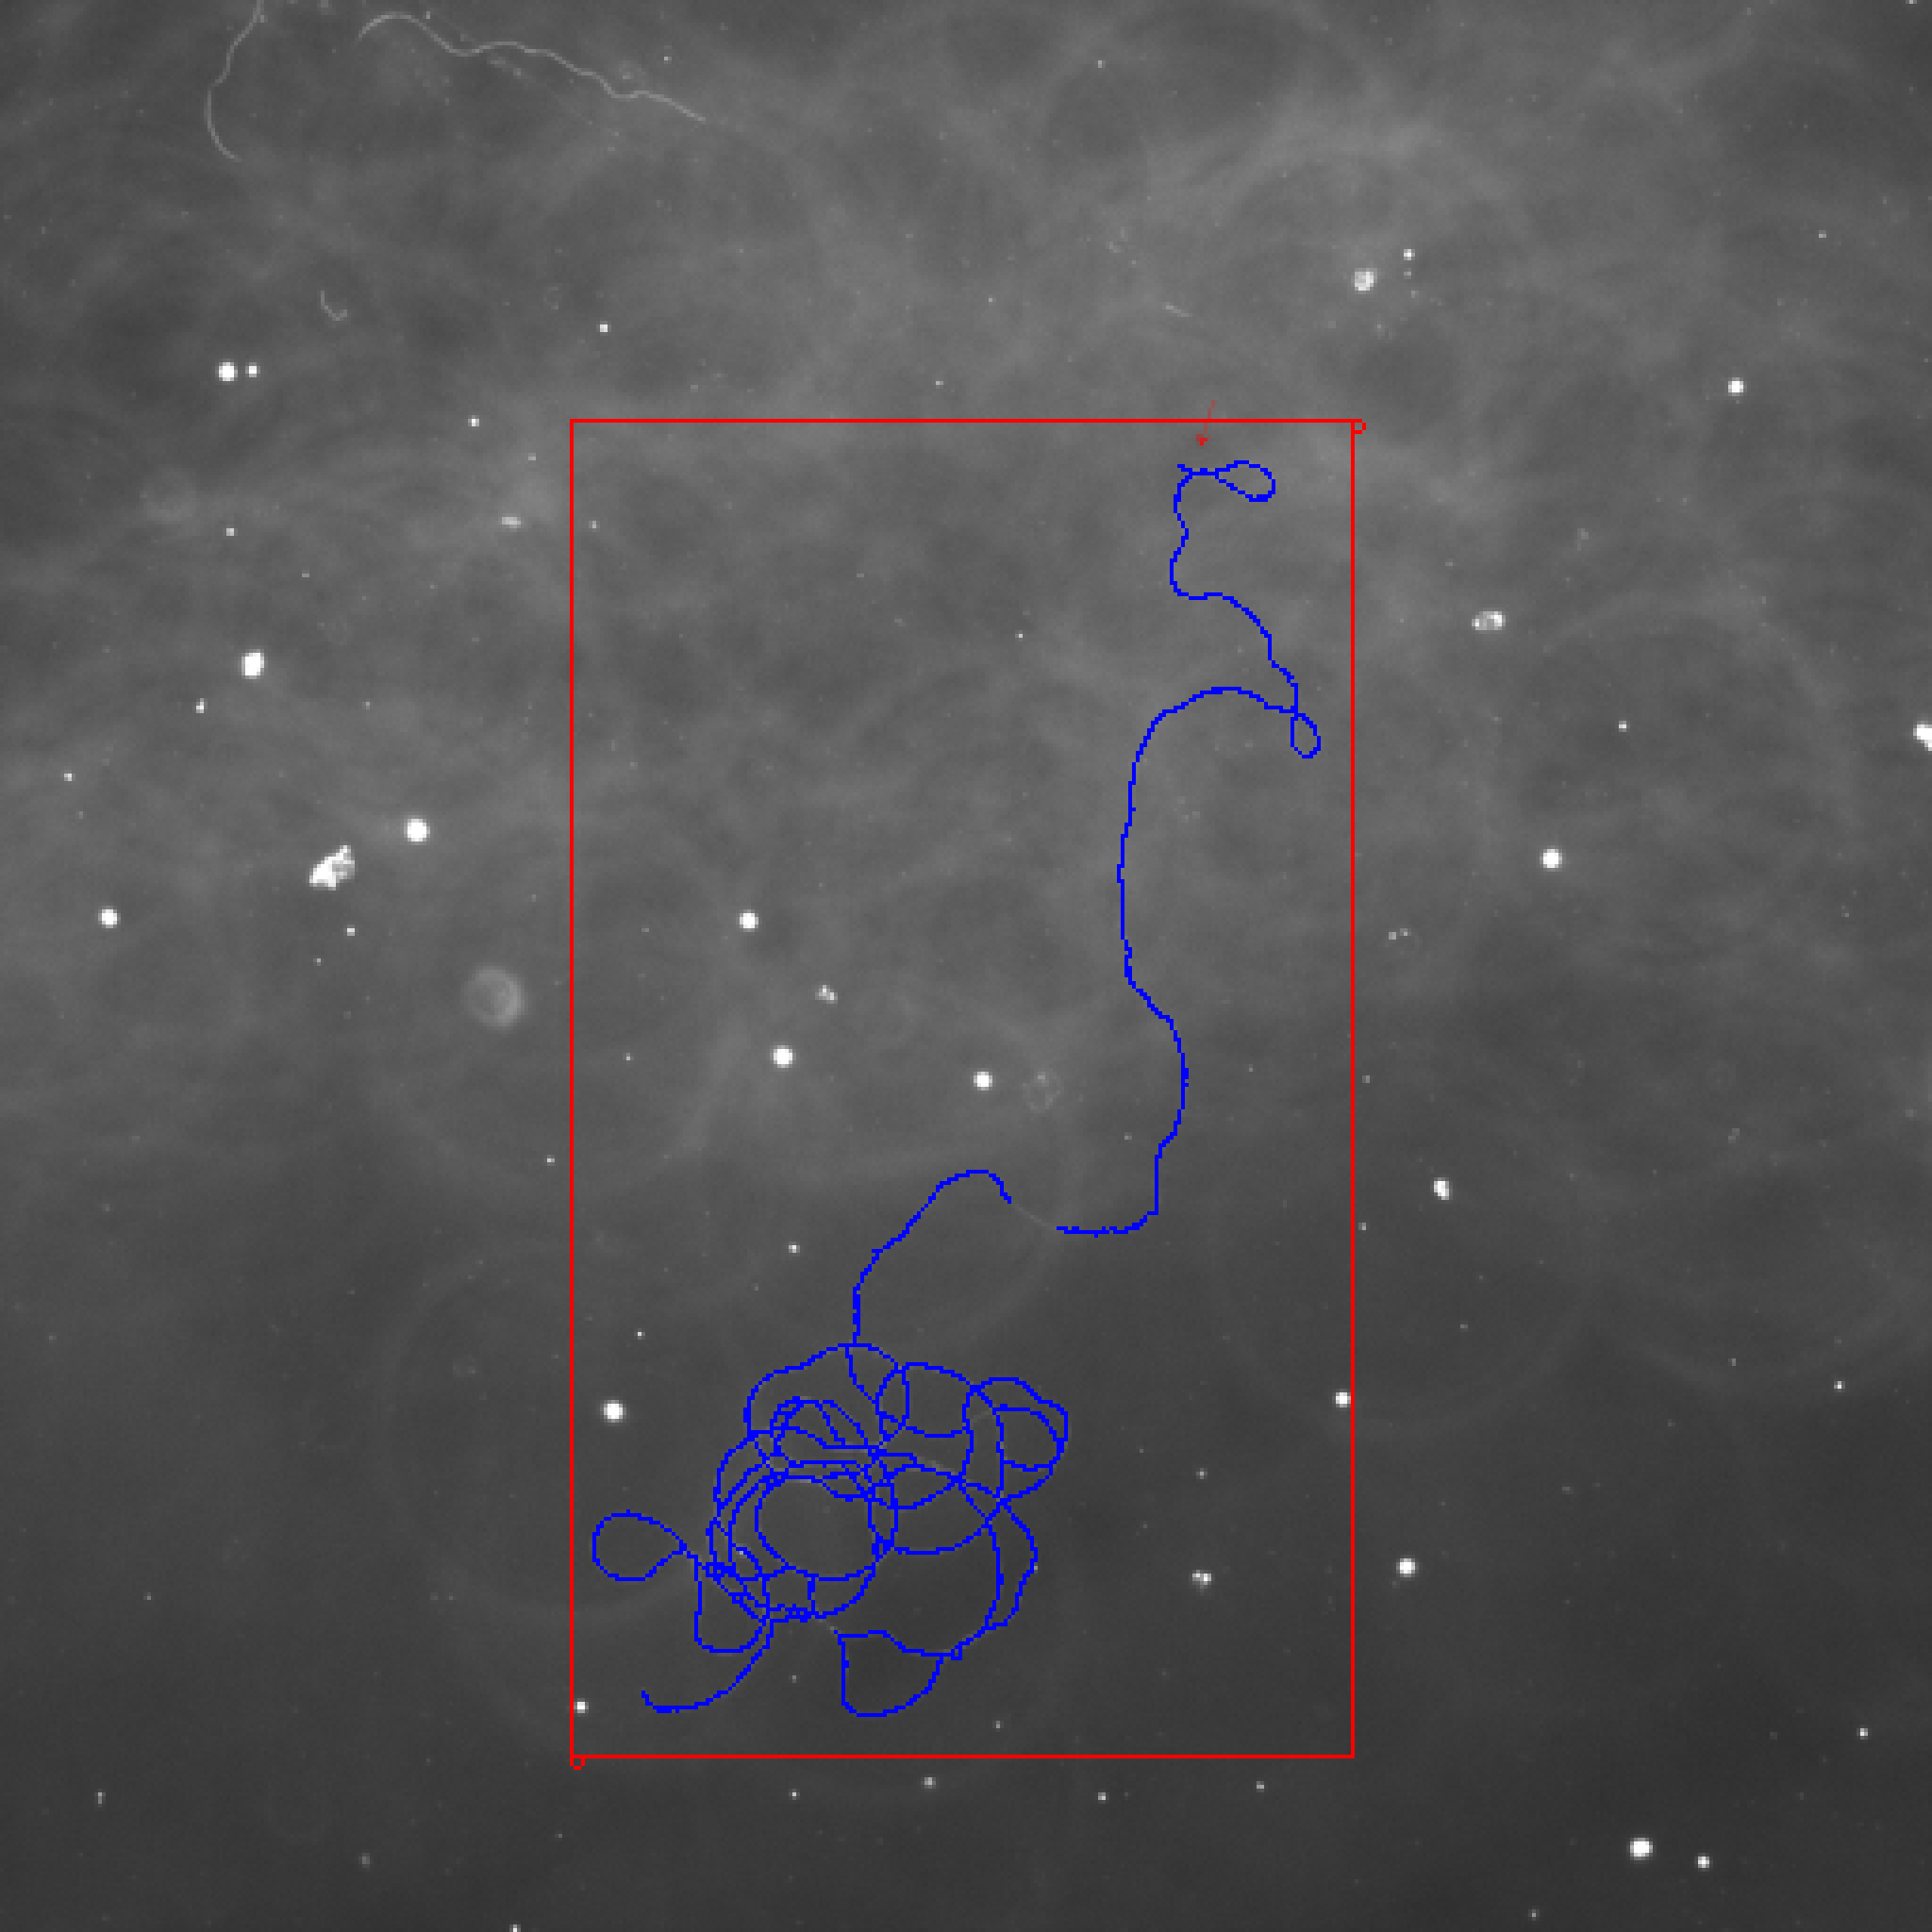
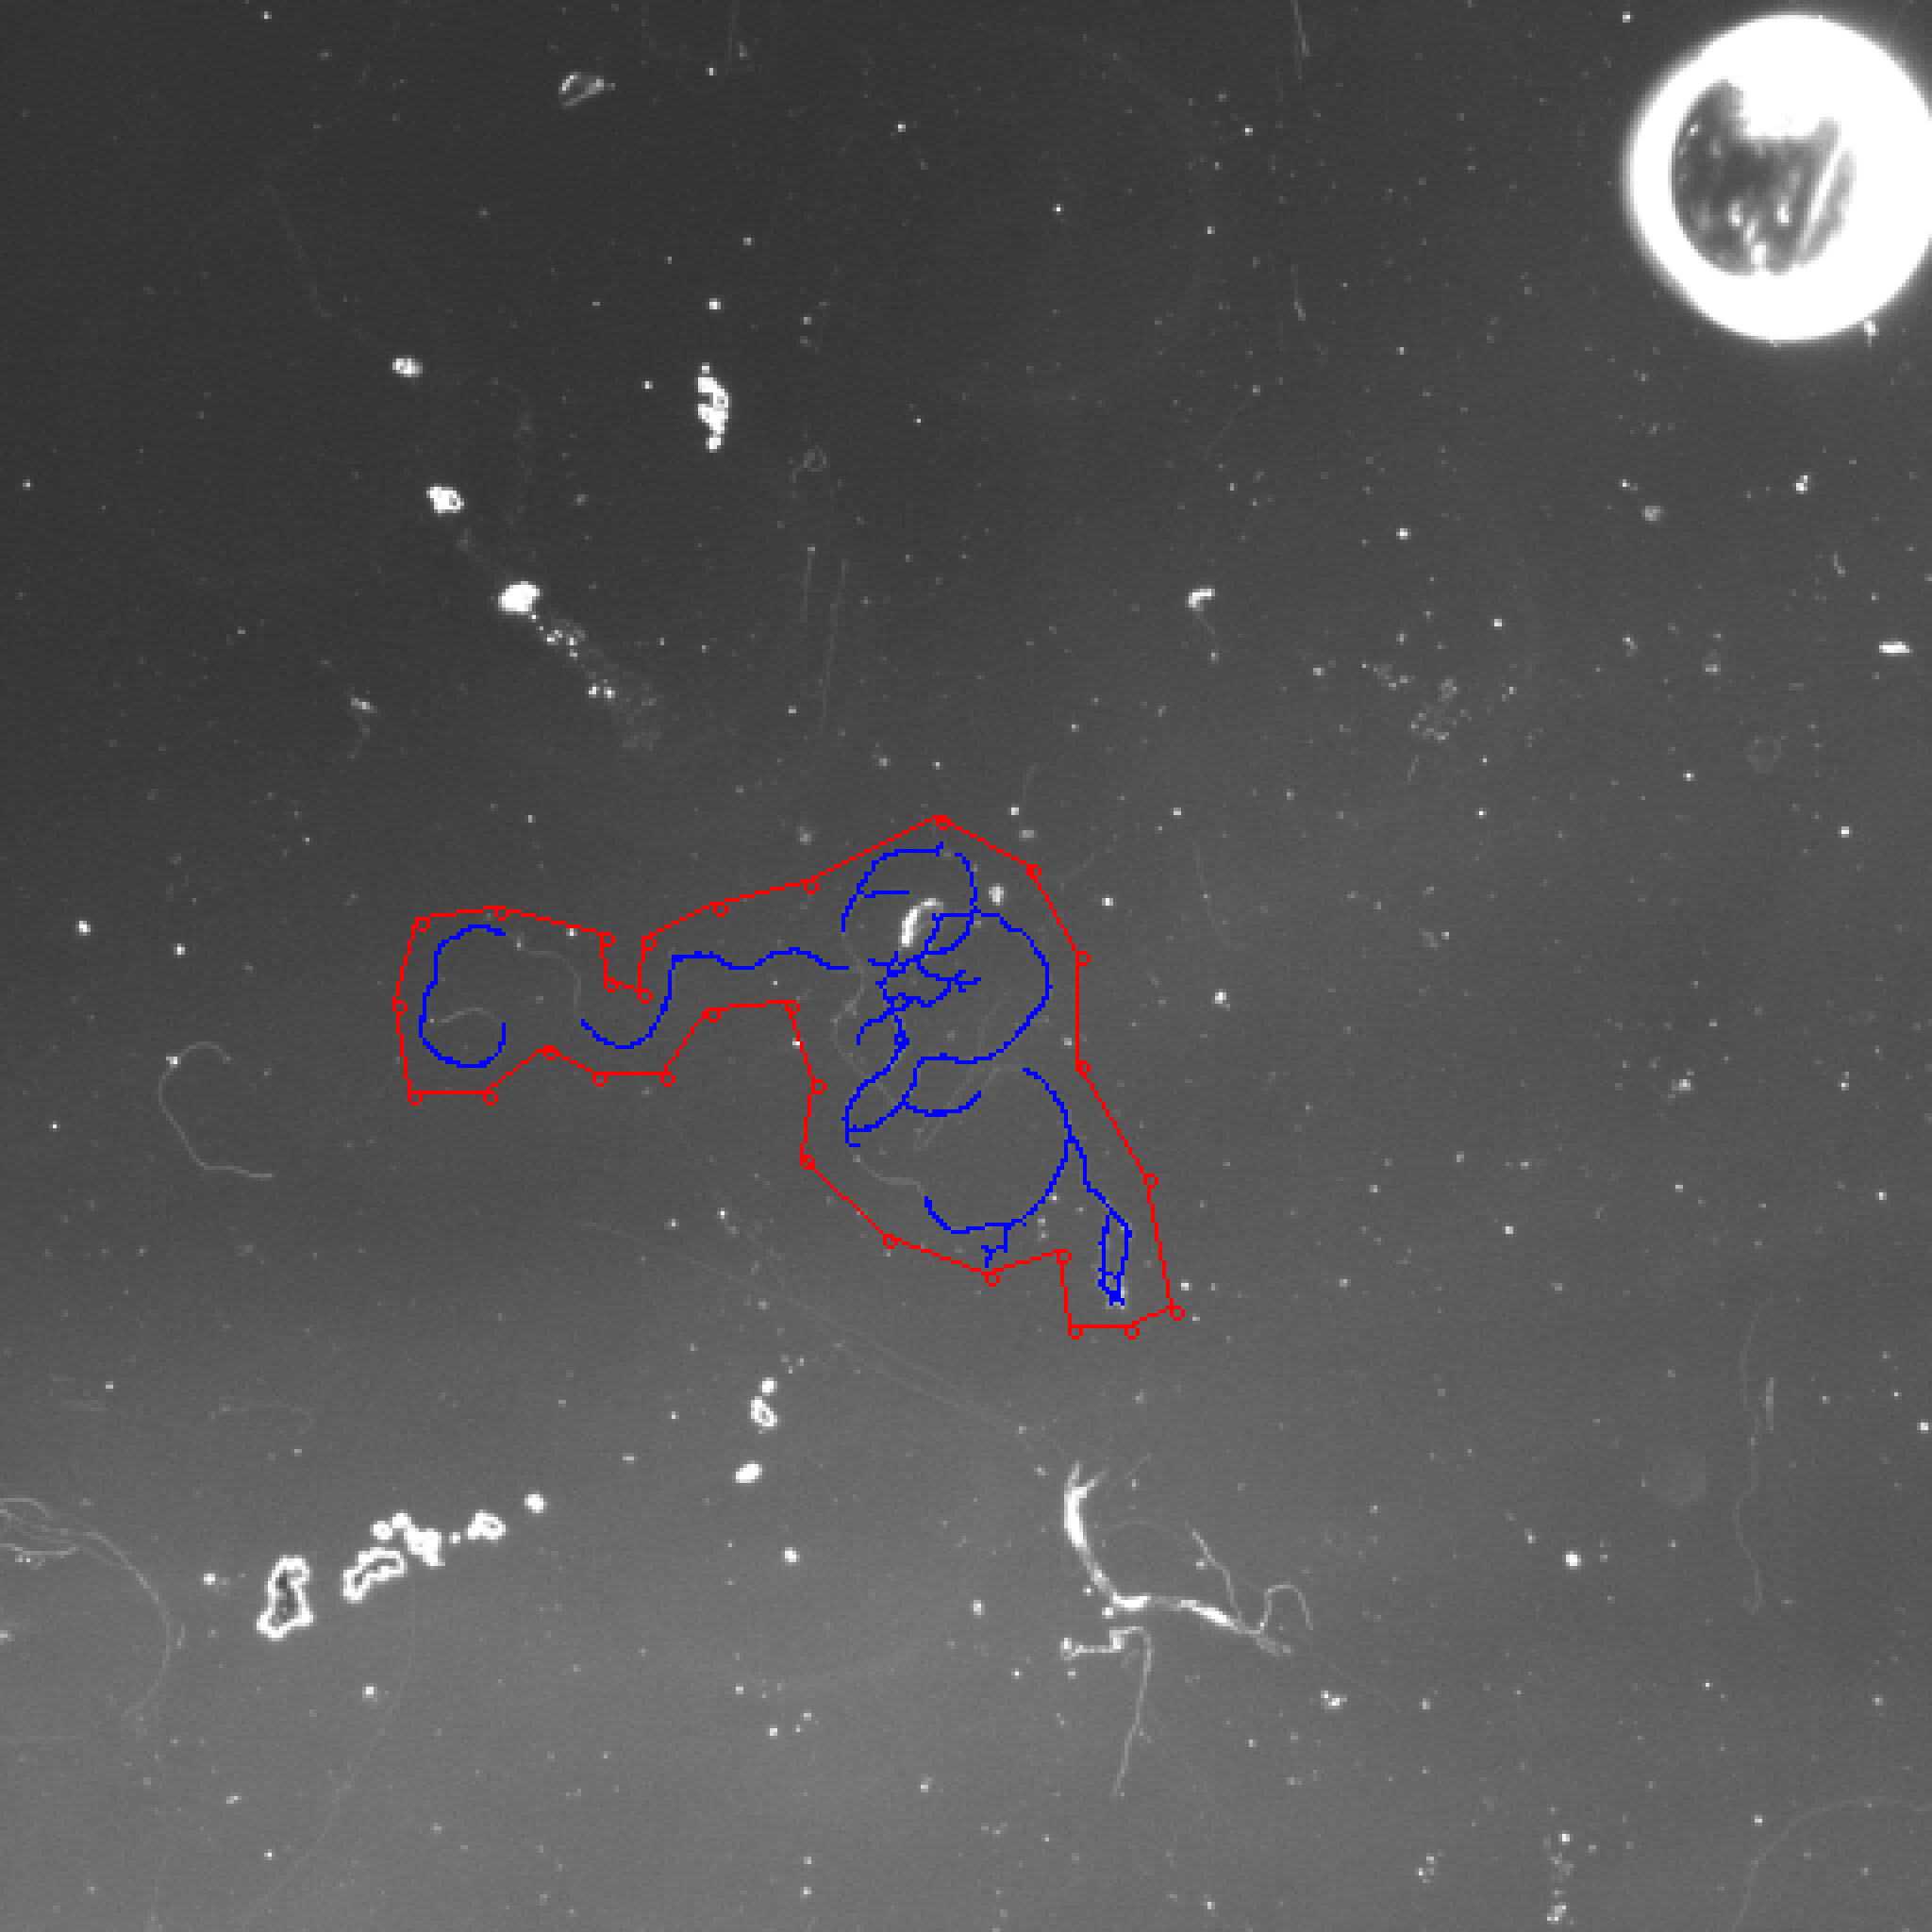
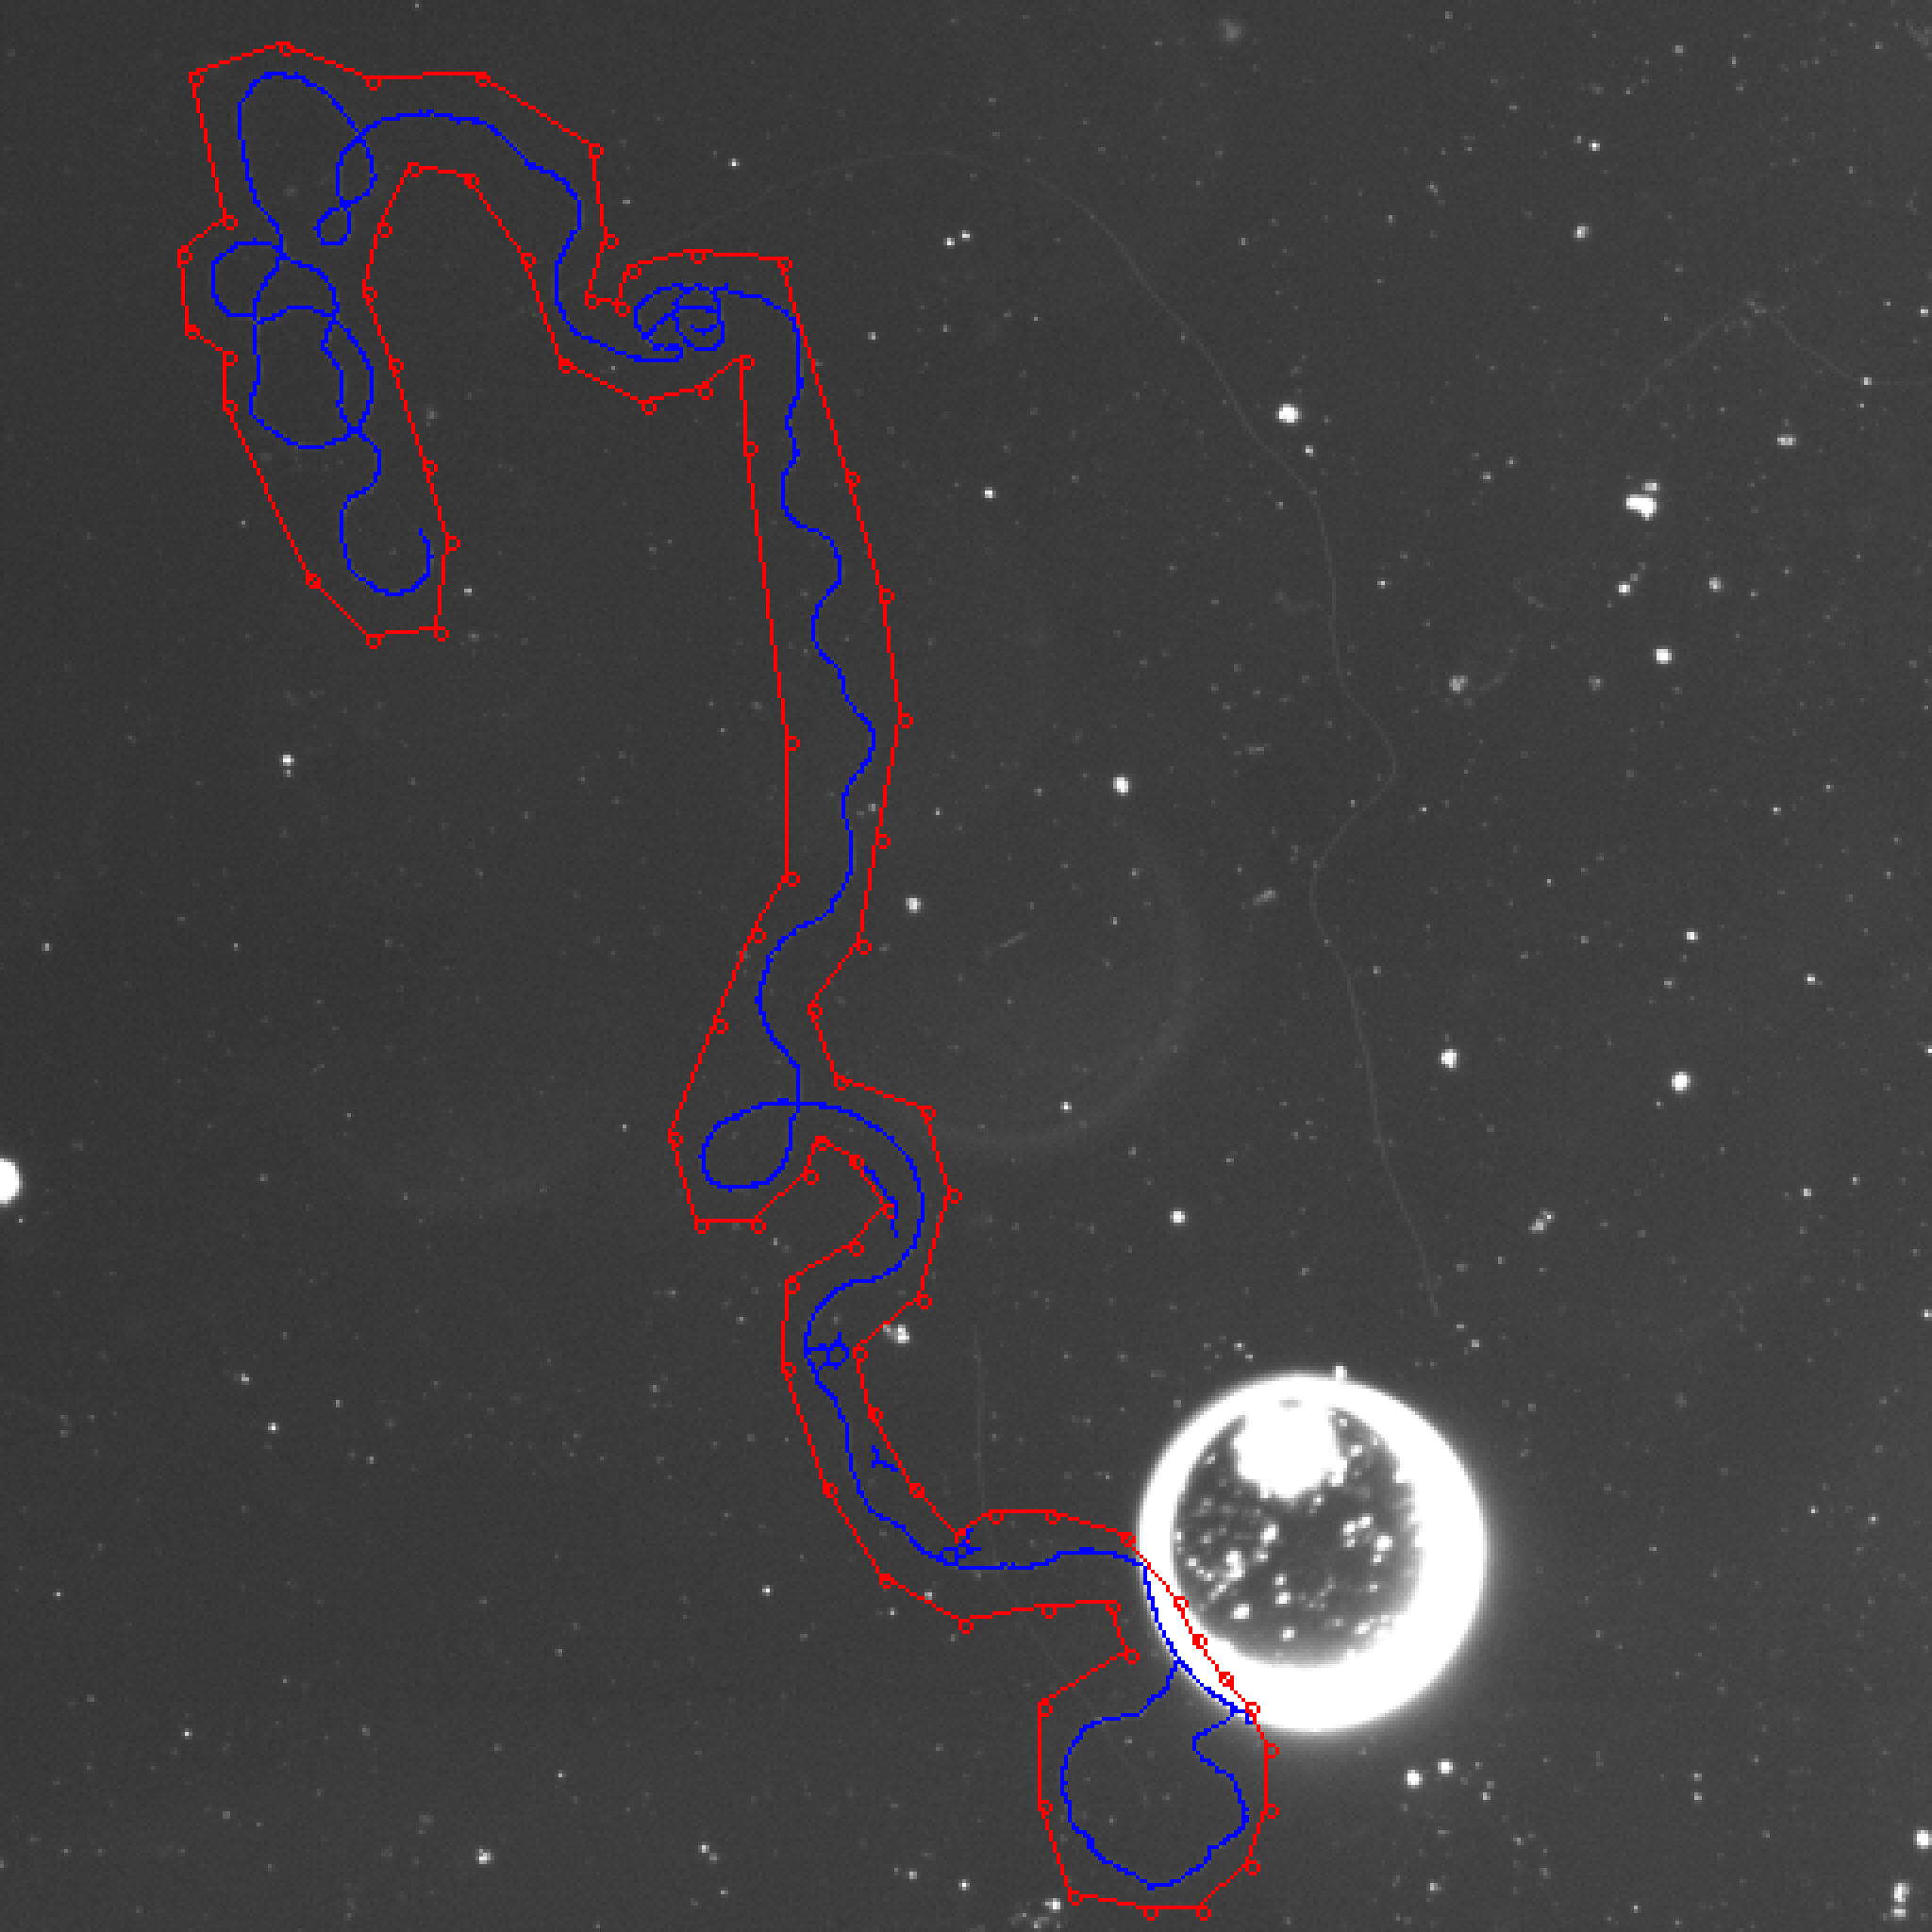
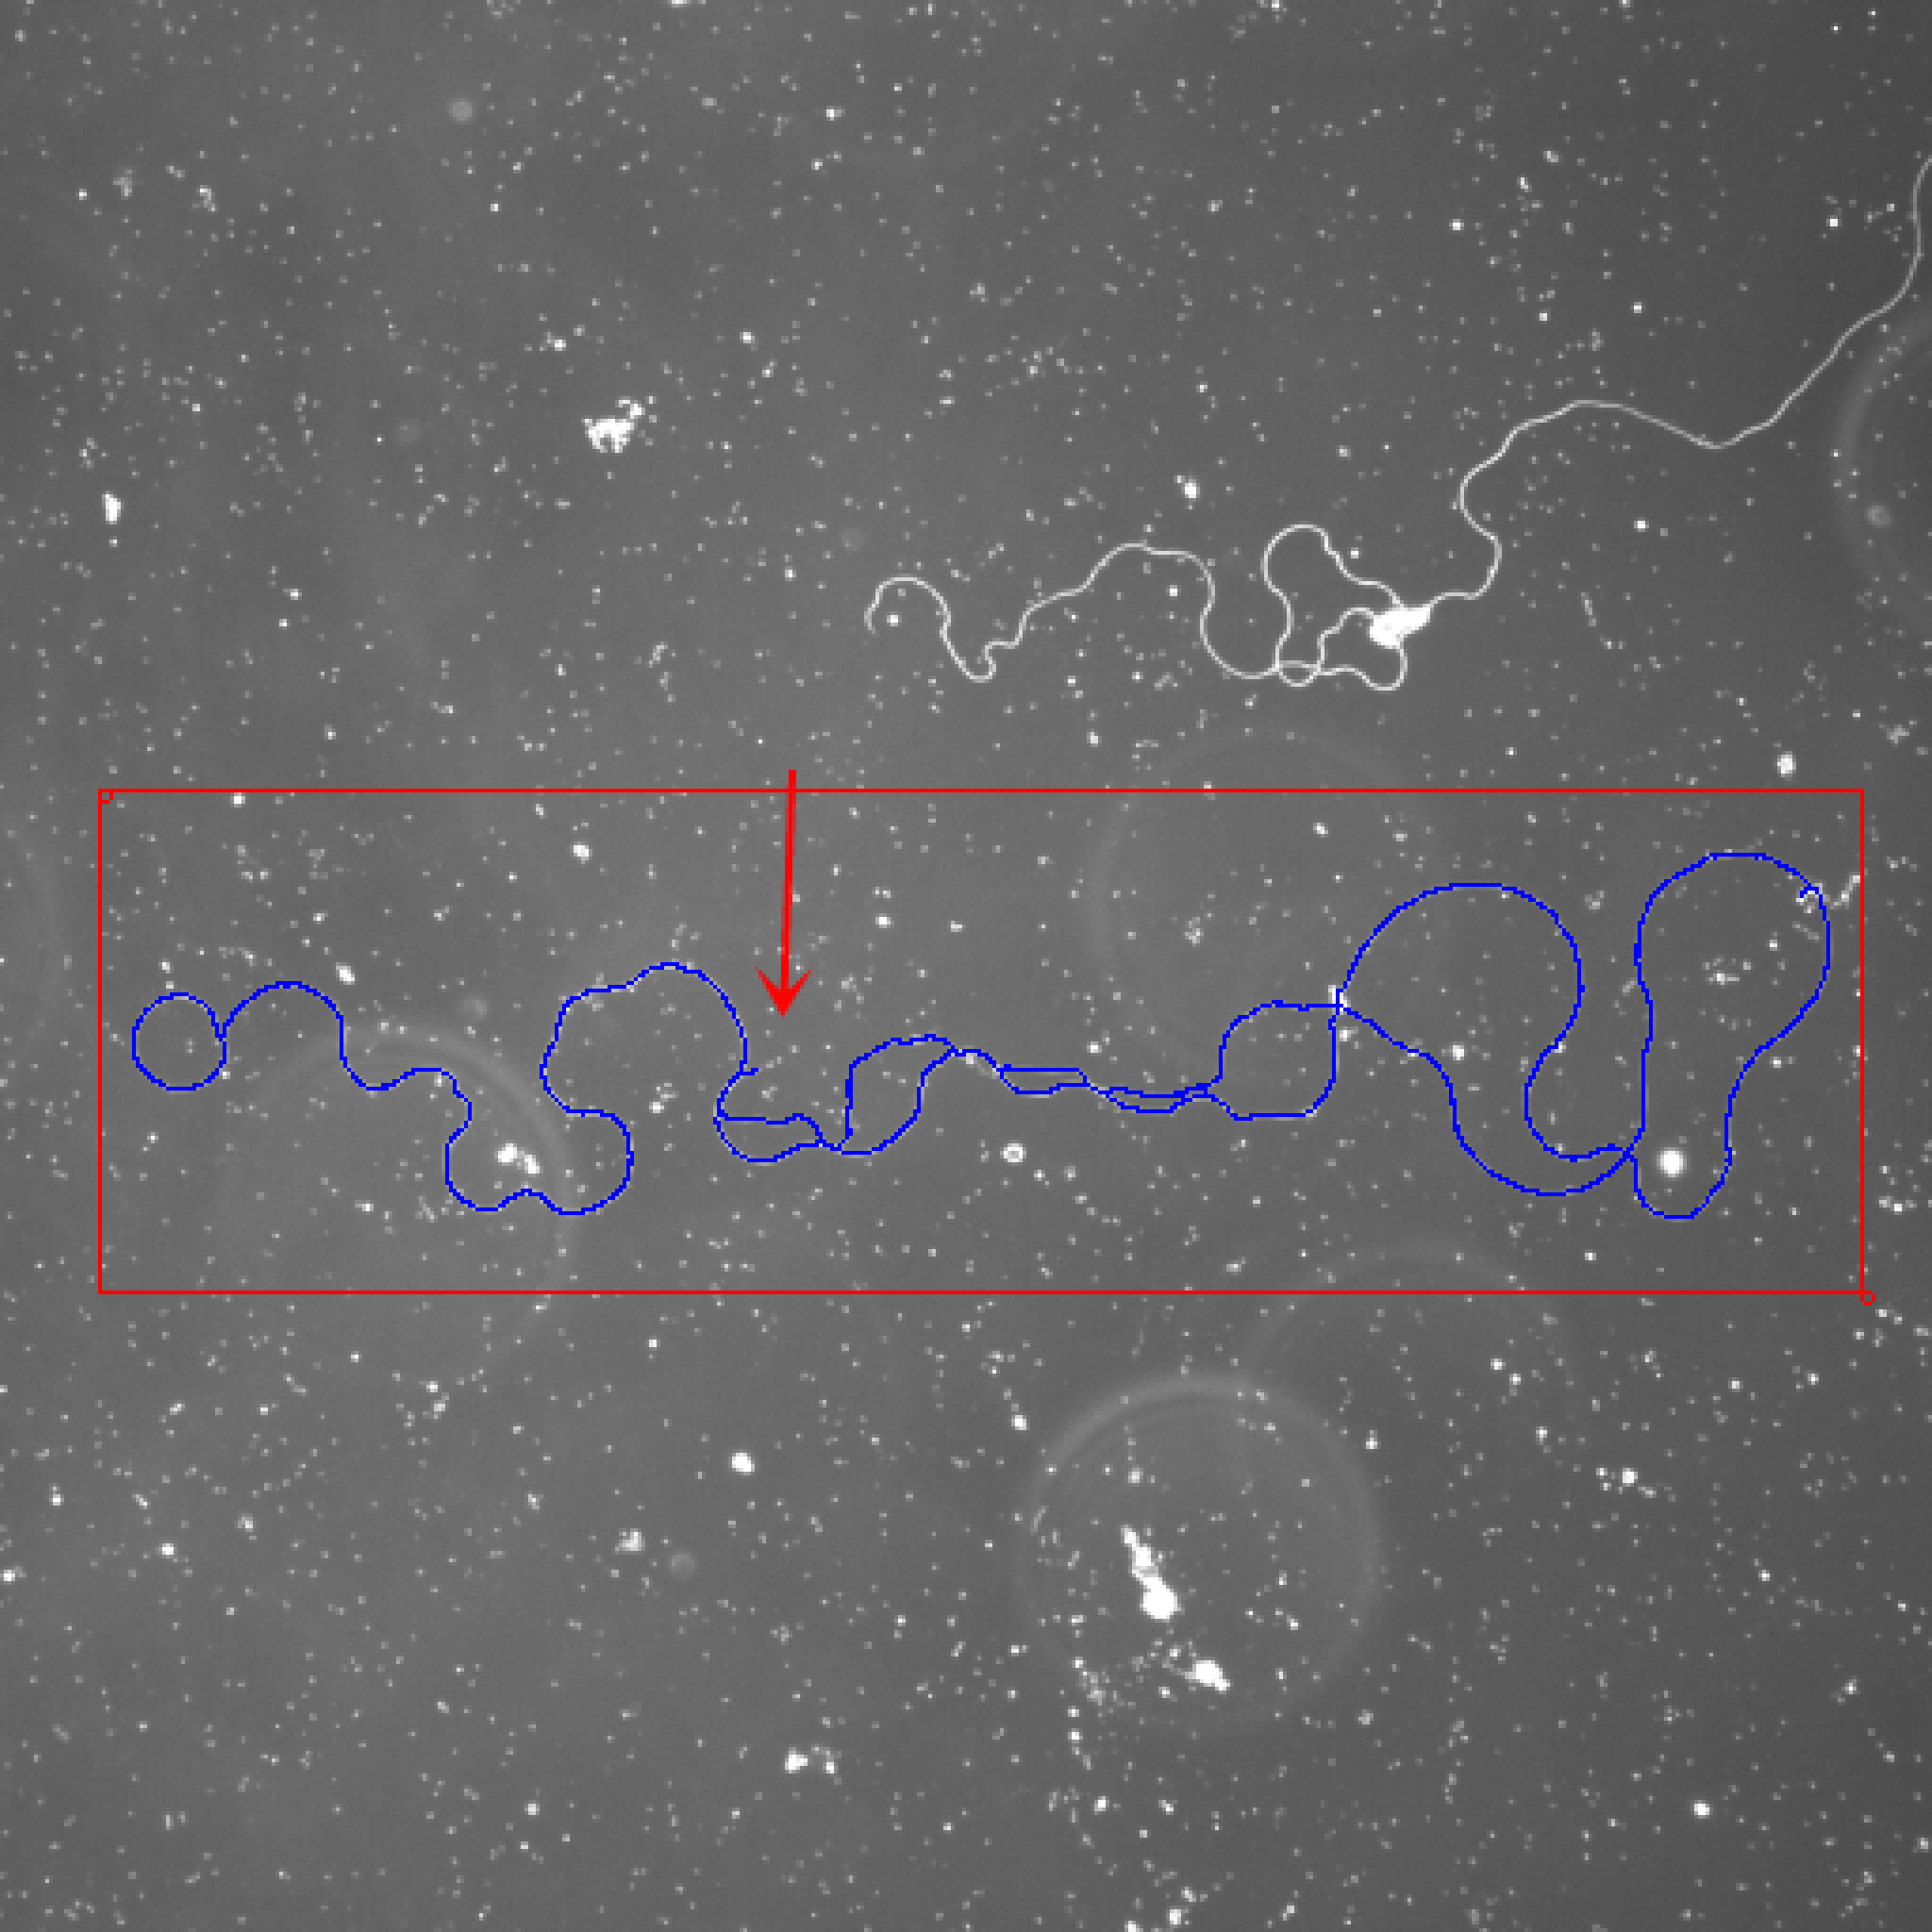
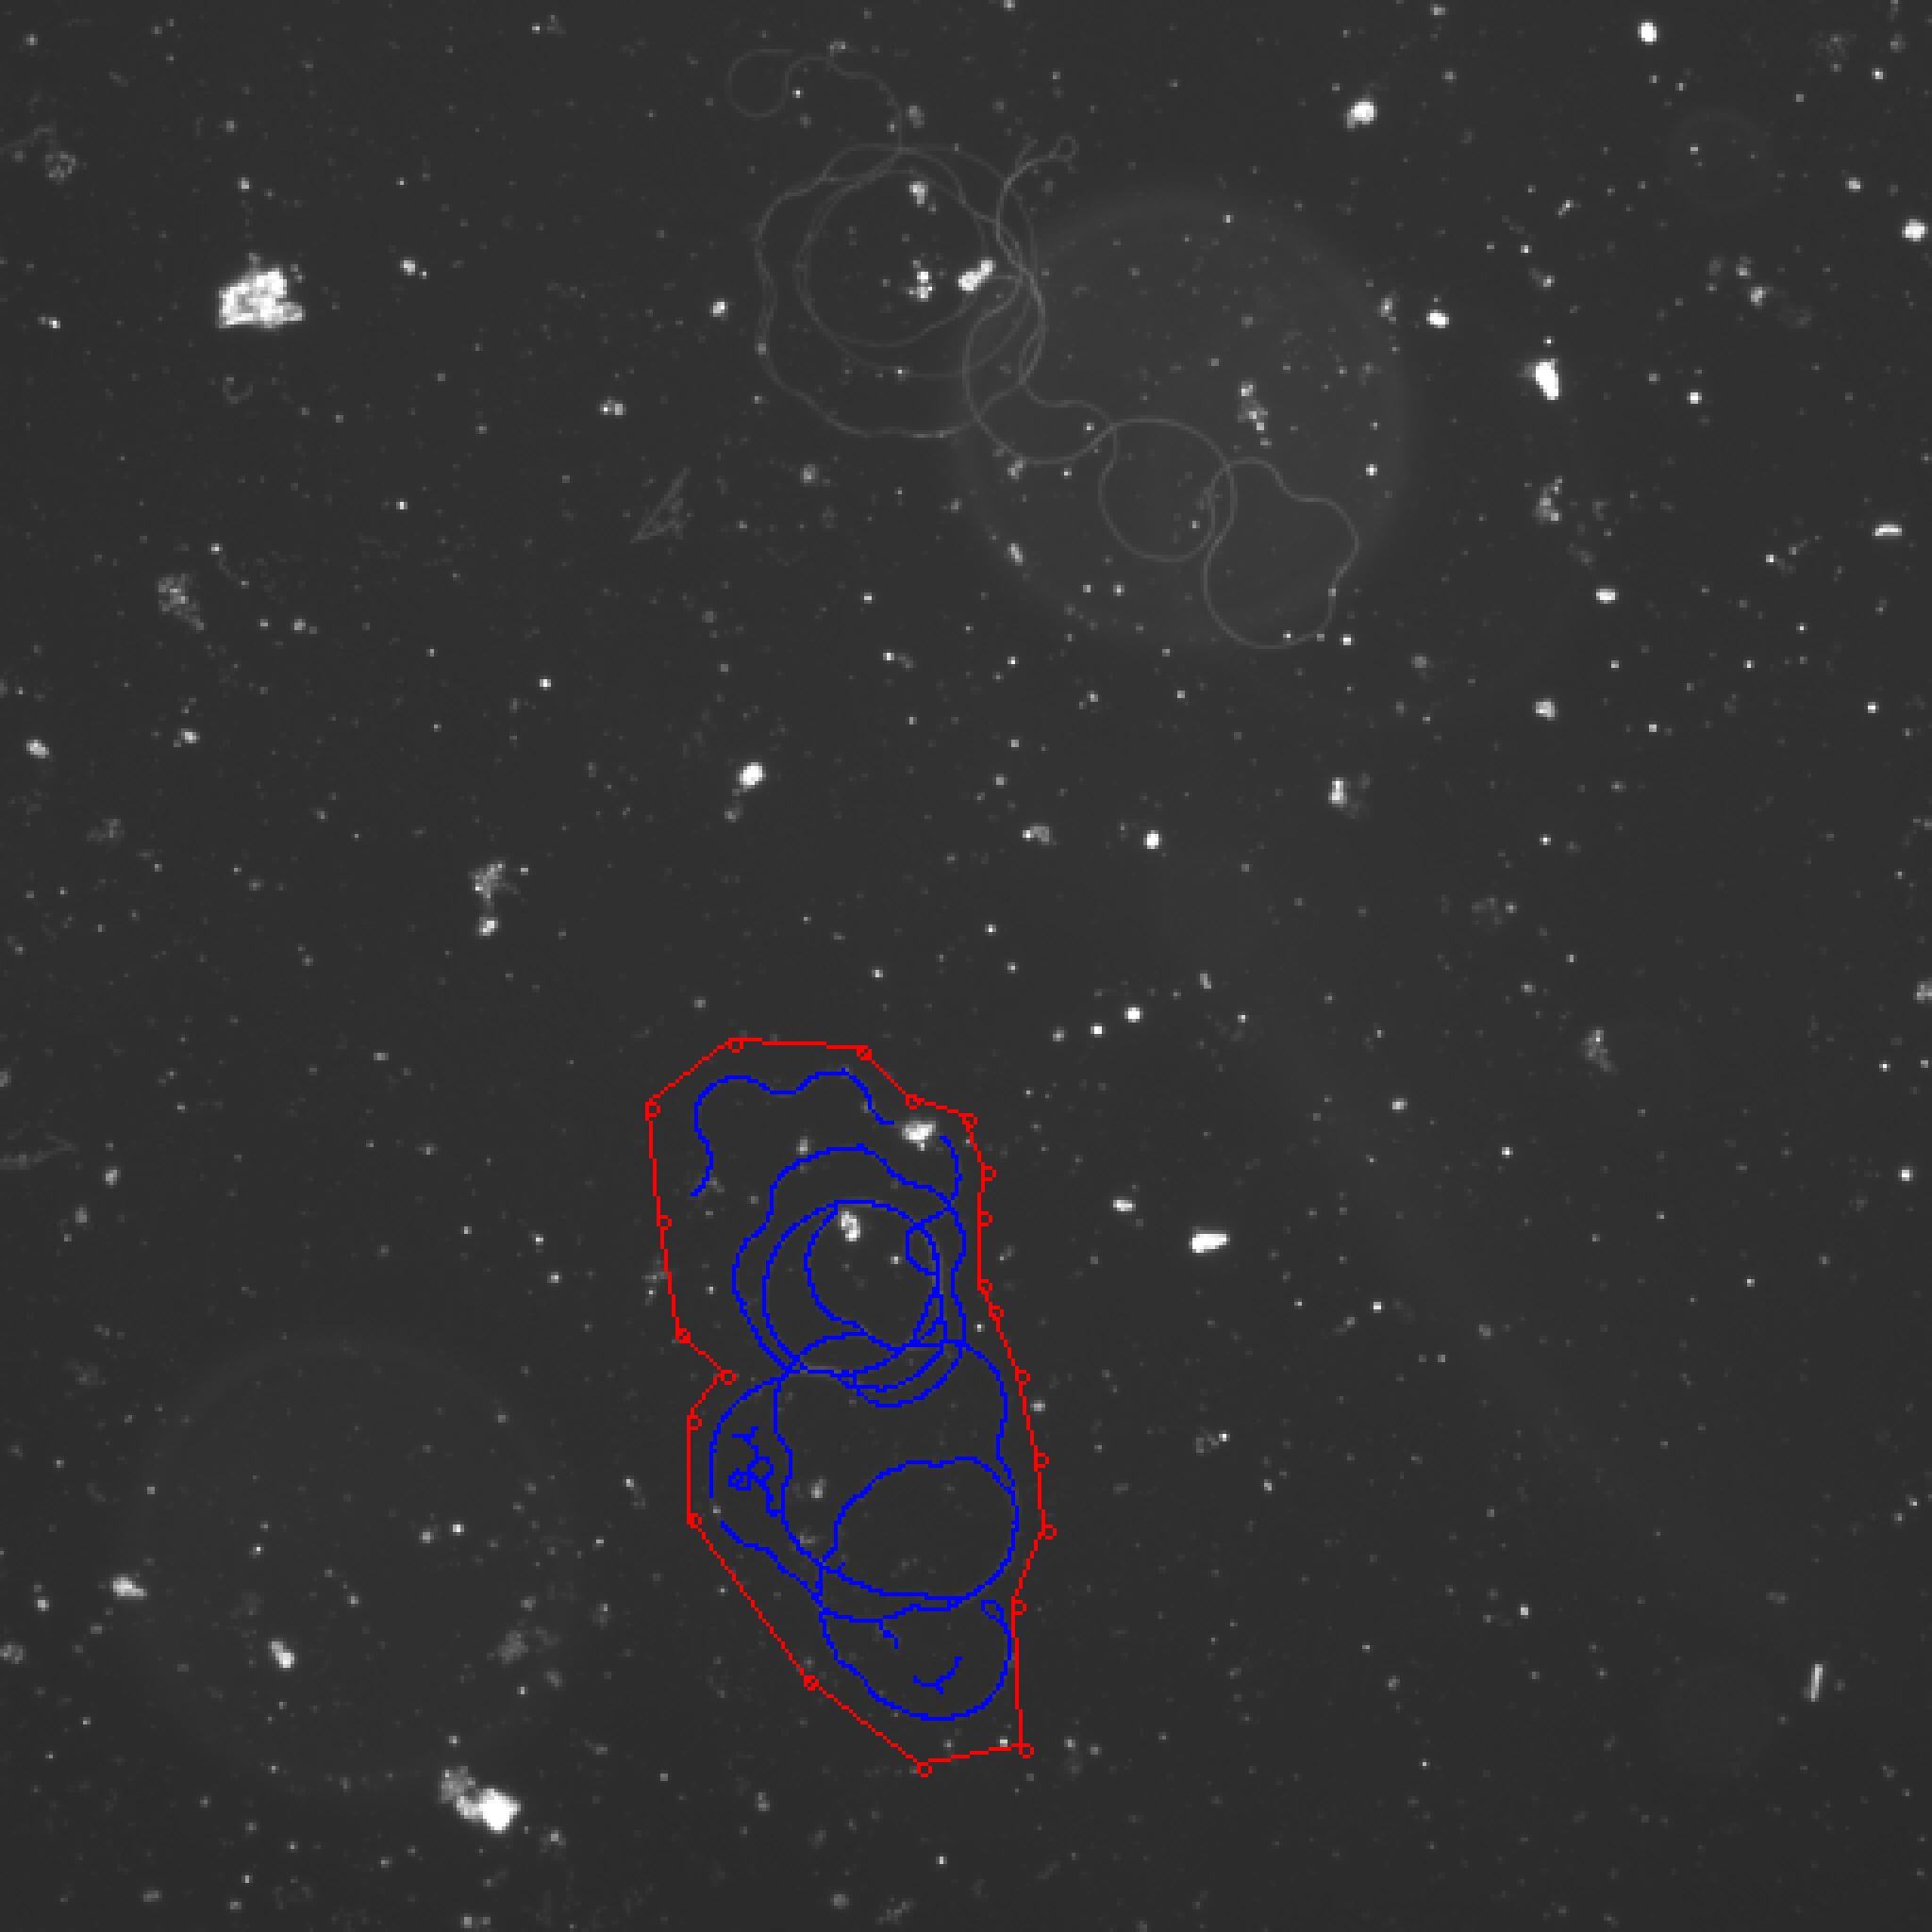
24708.1_1 at 20X.jpg: Draw a rectangle and set k = 1.
My best result is 2030. The ground truth is 1951. The deviation is 4.05%.
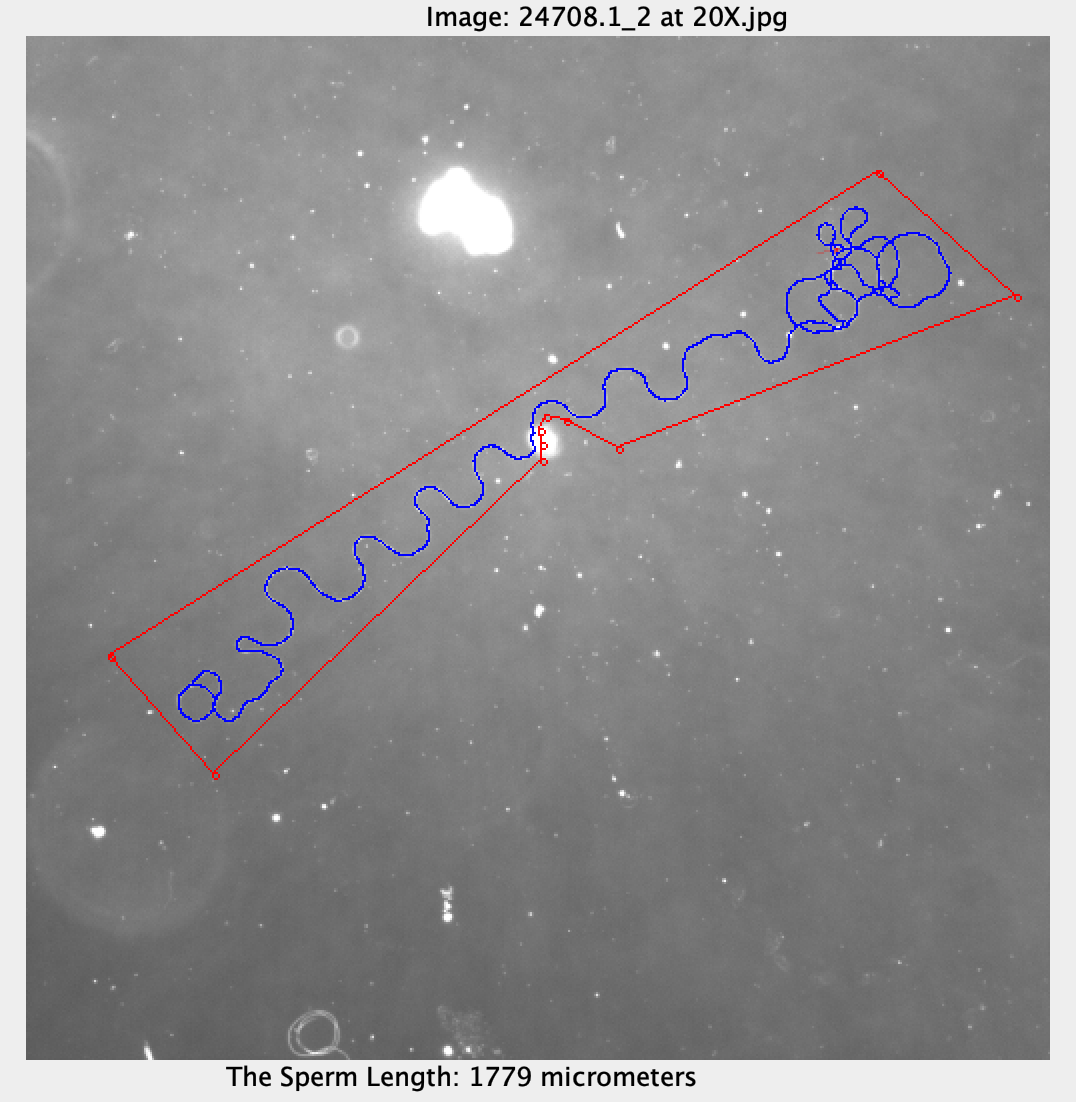
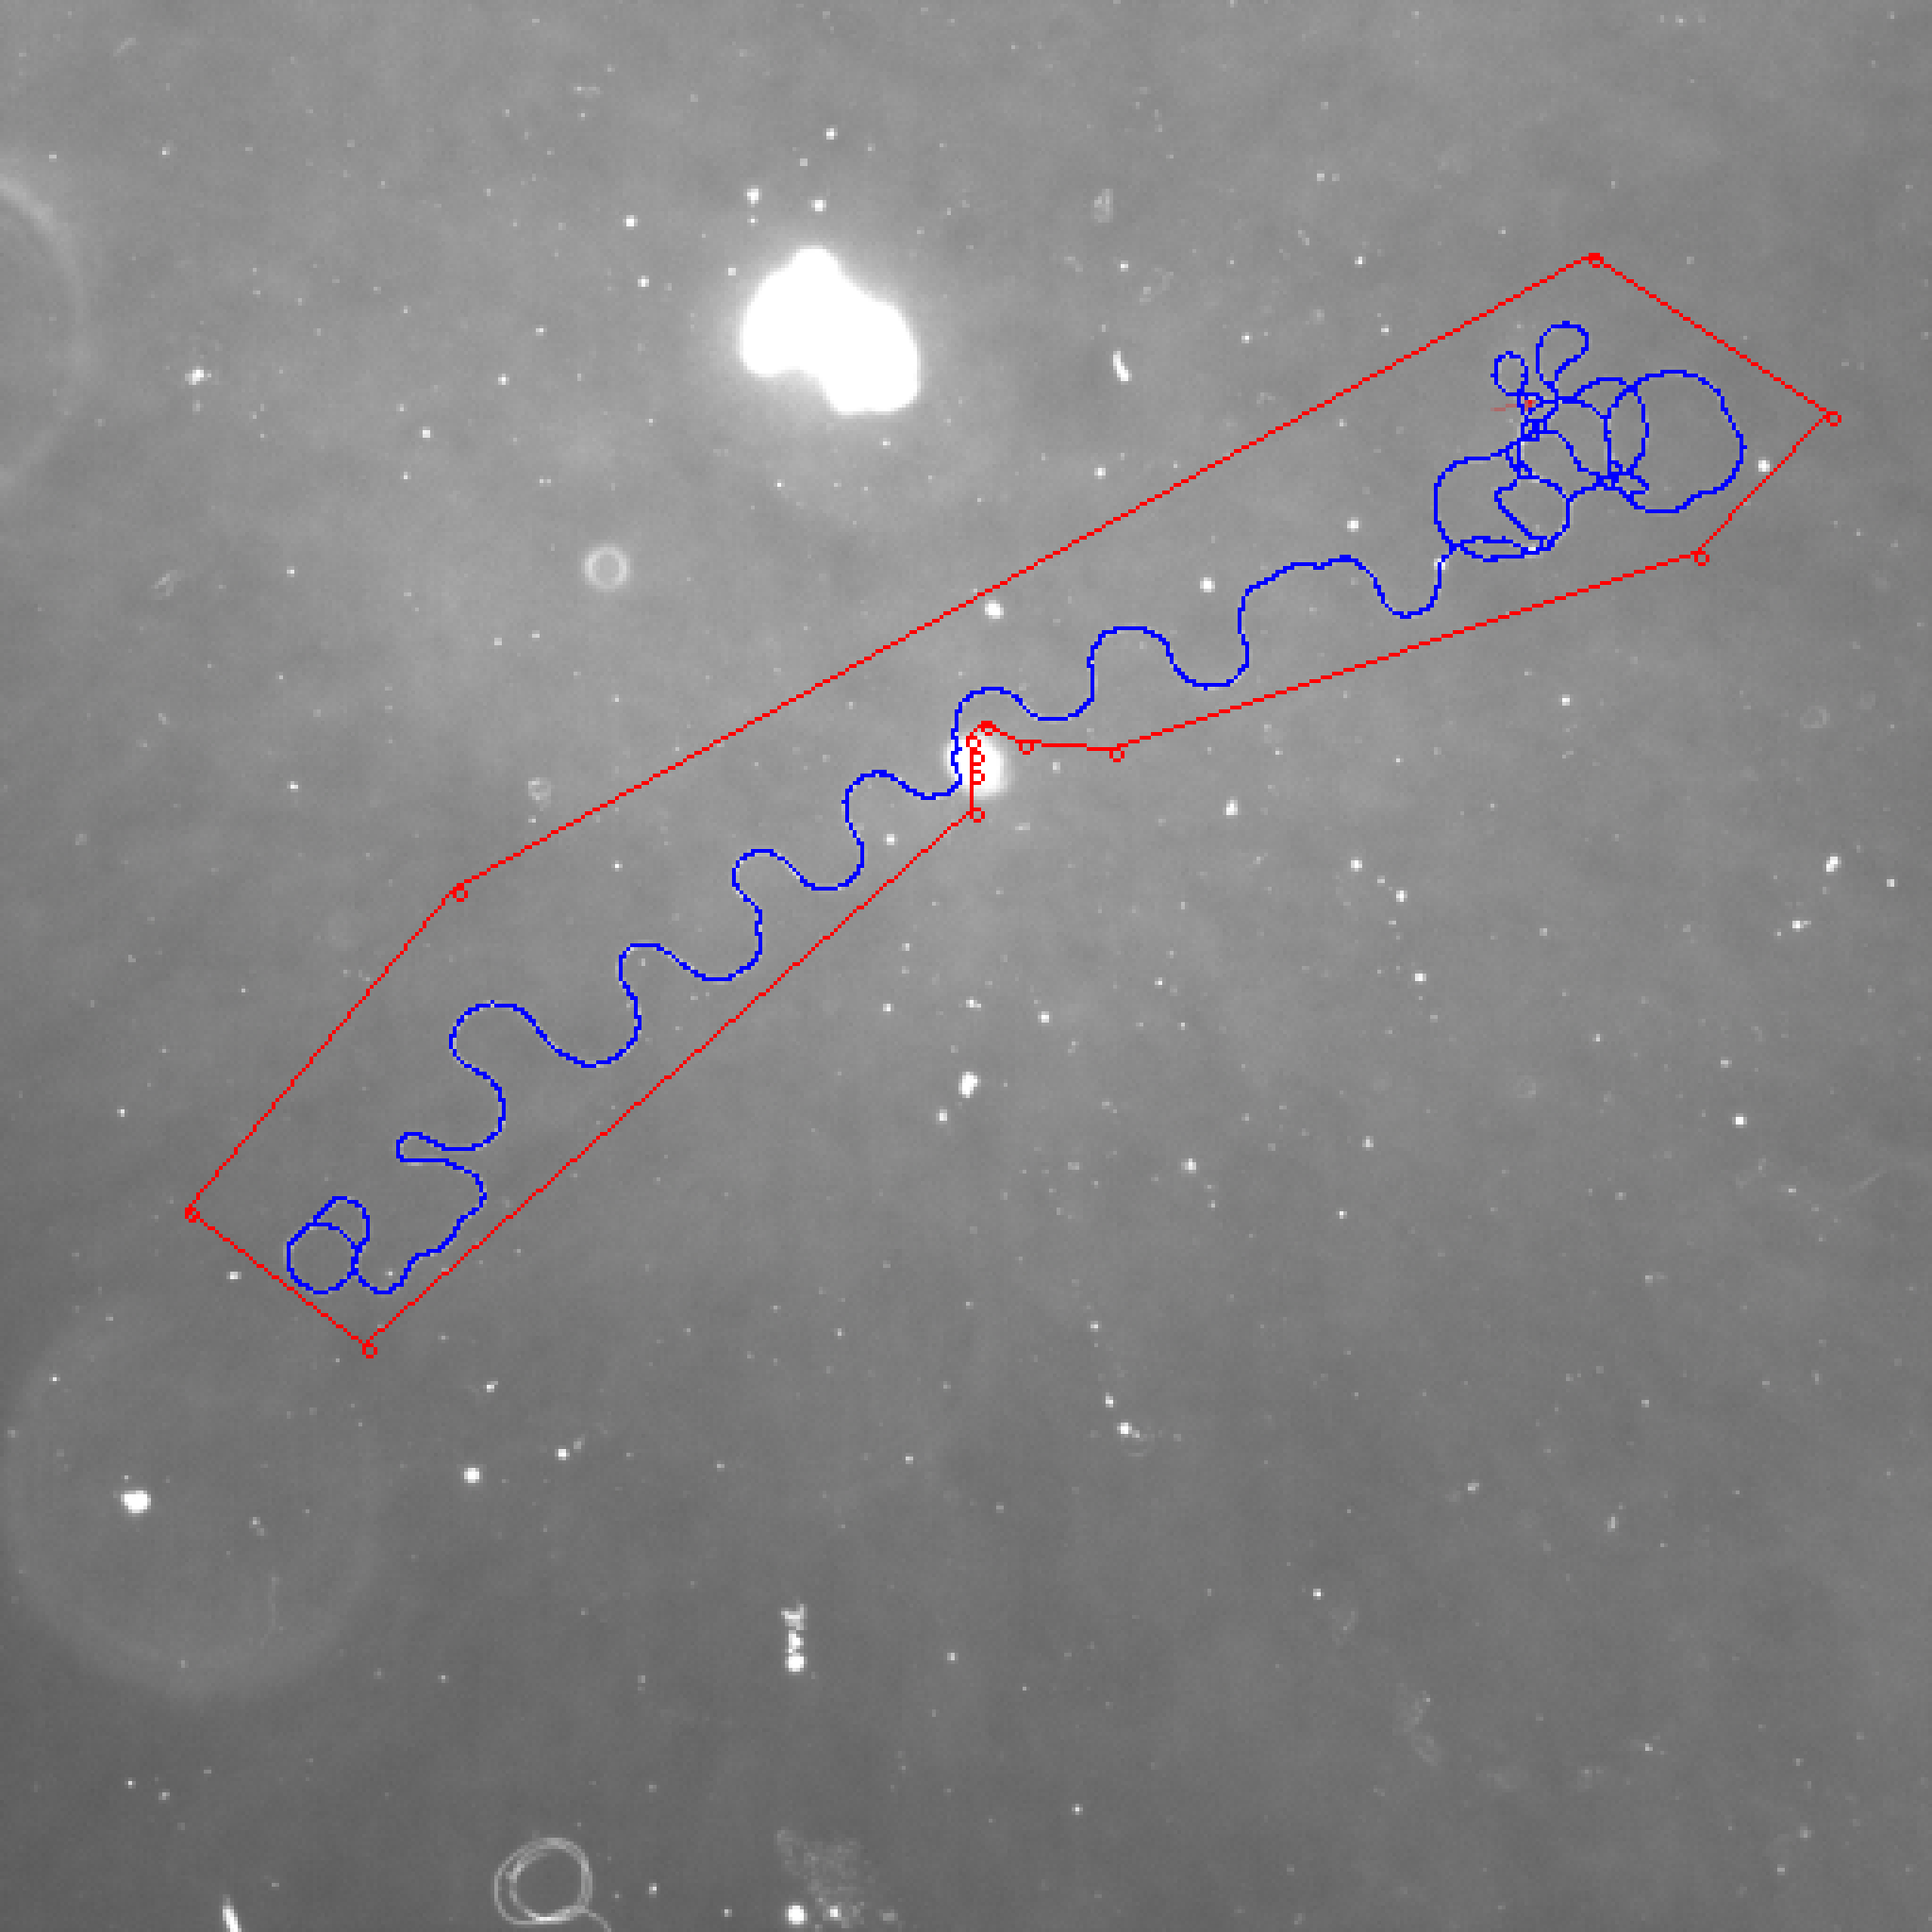
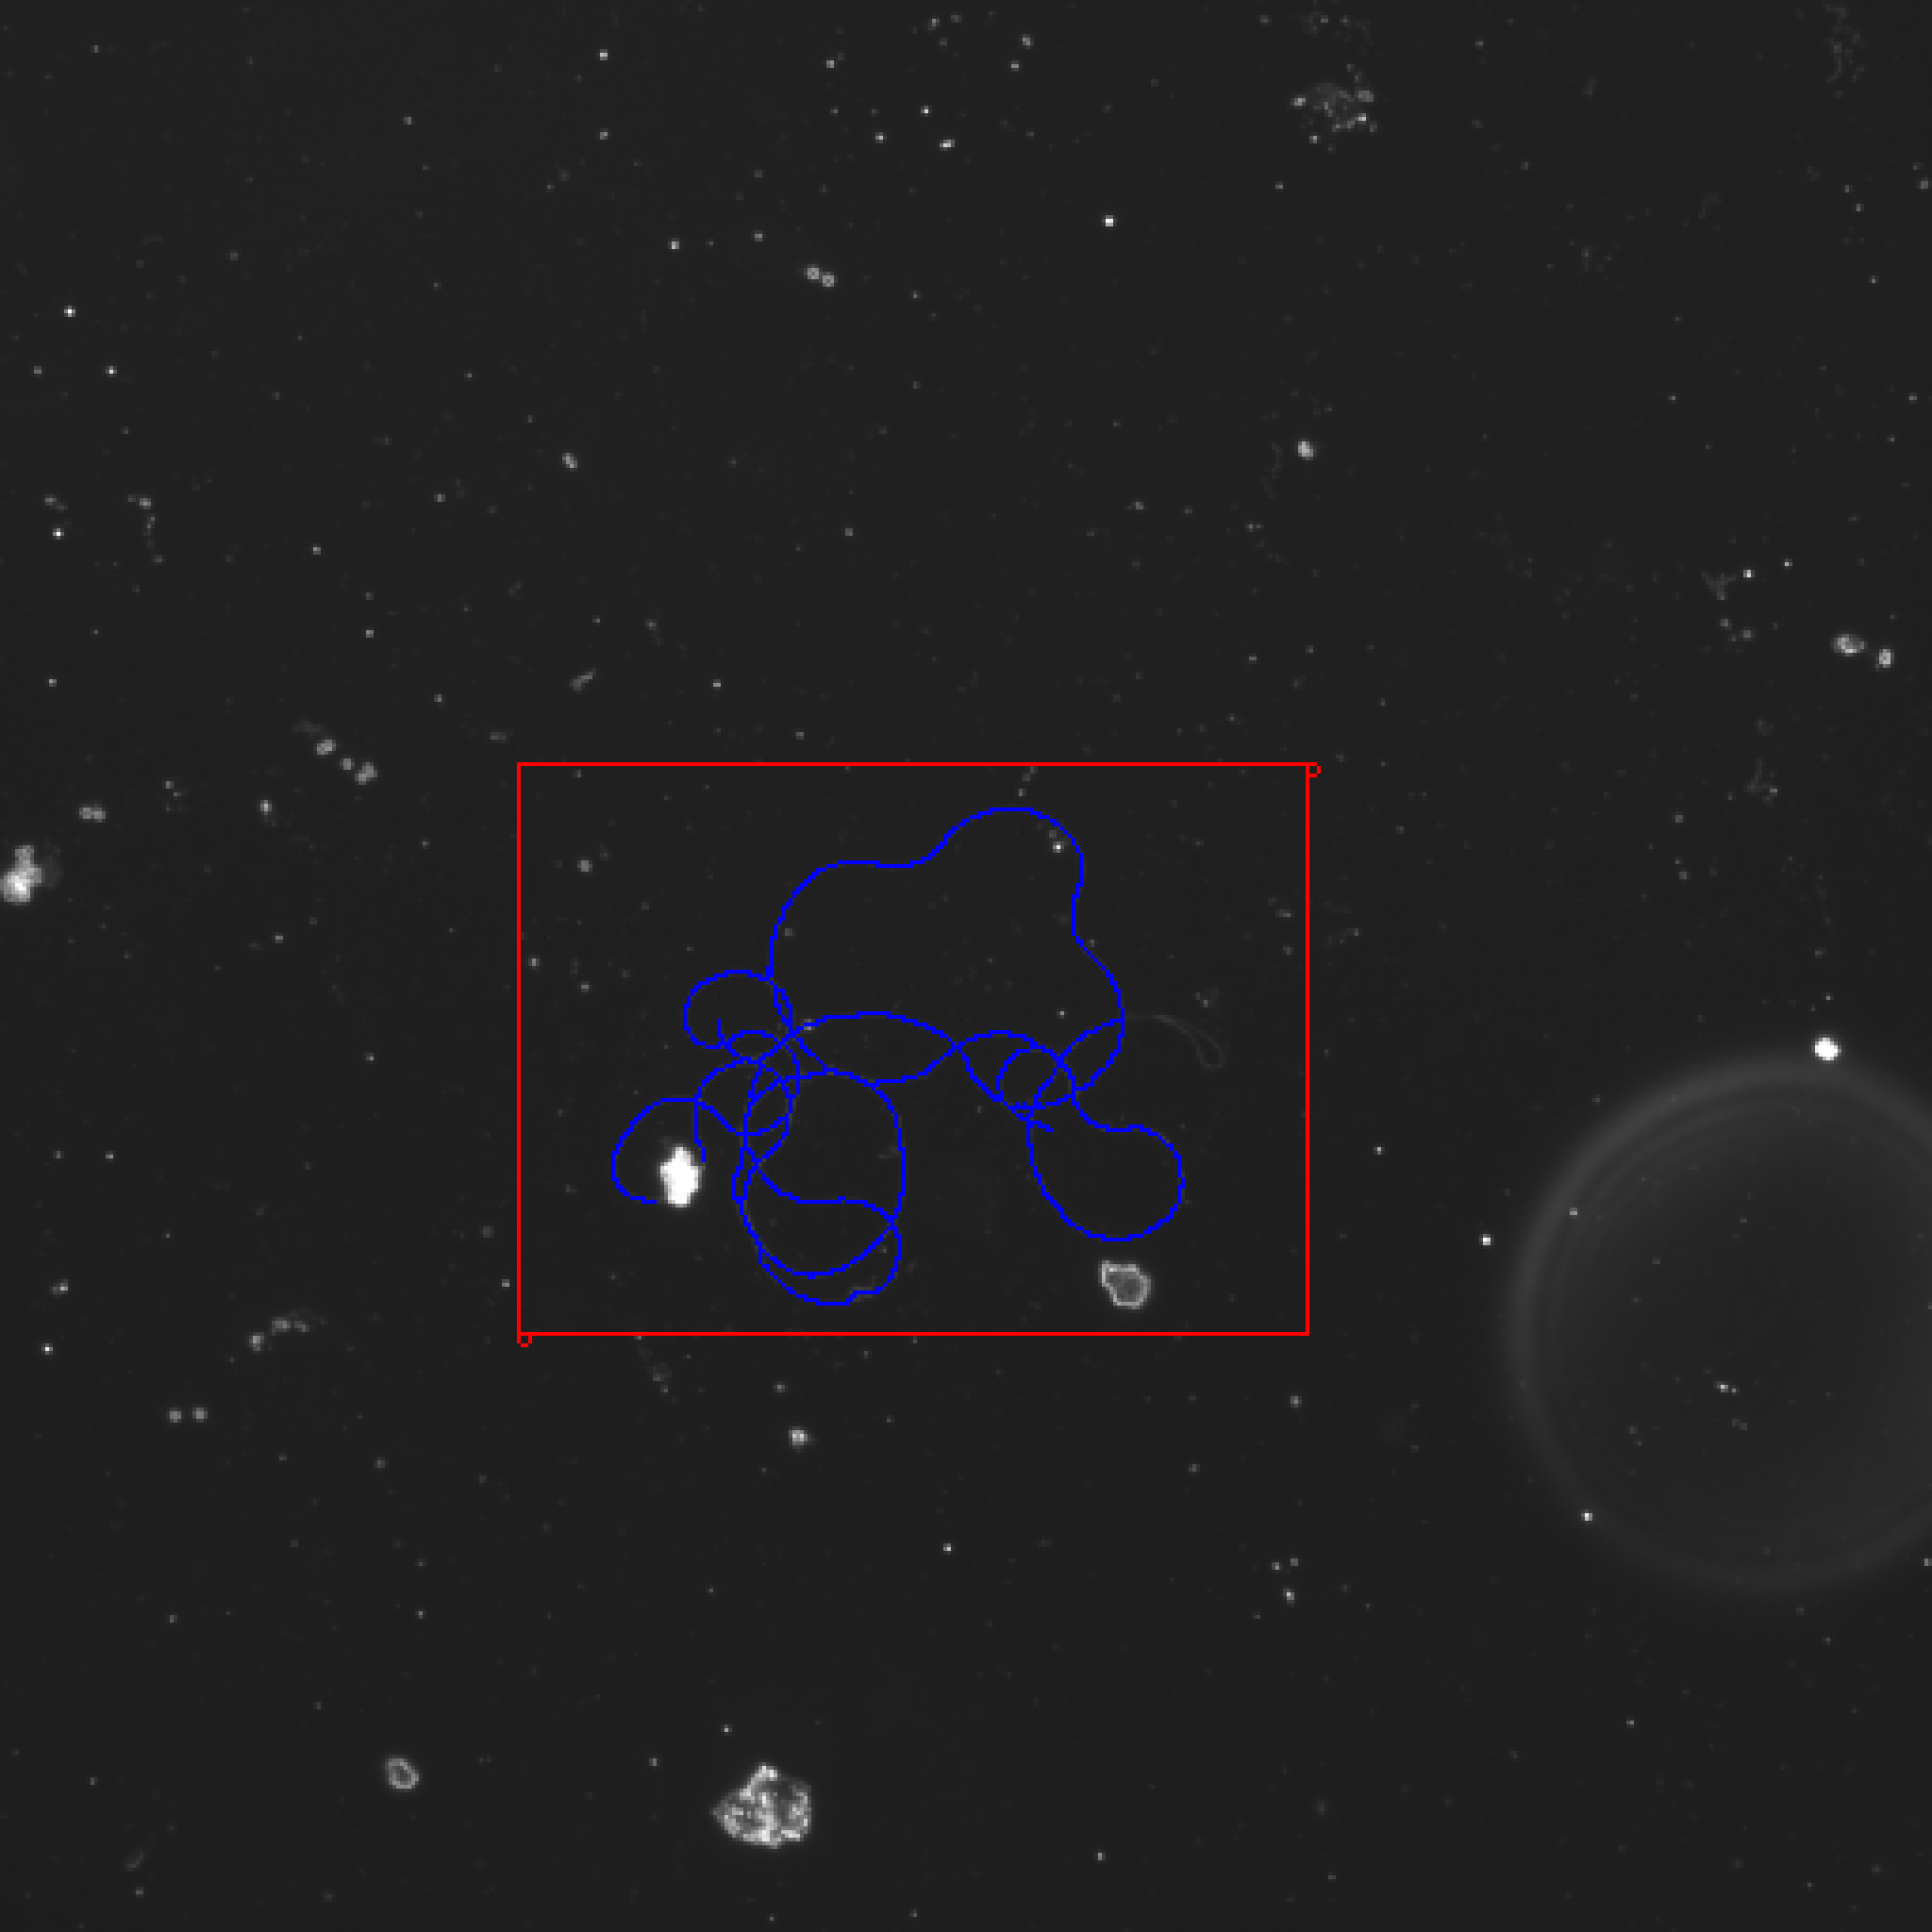
24708.1_2 at 20X.jpg: Draw a polygon and set k = 1.
My best result is 1786. The ground truth is 1787. The deviation is 0.06%.
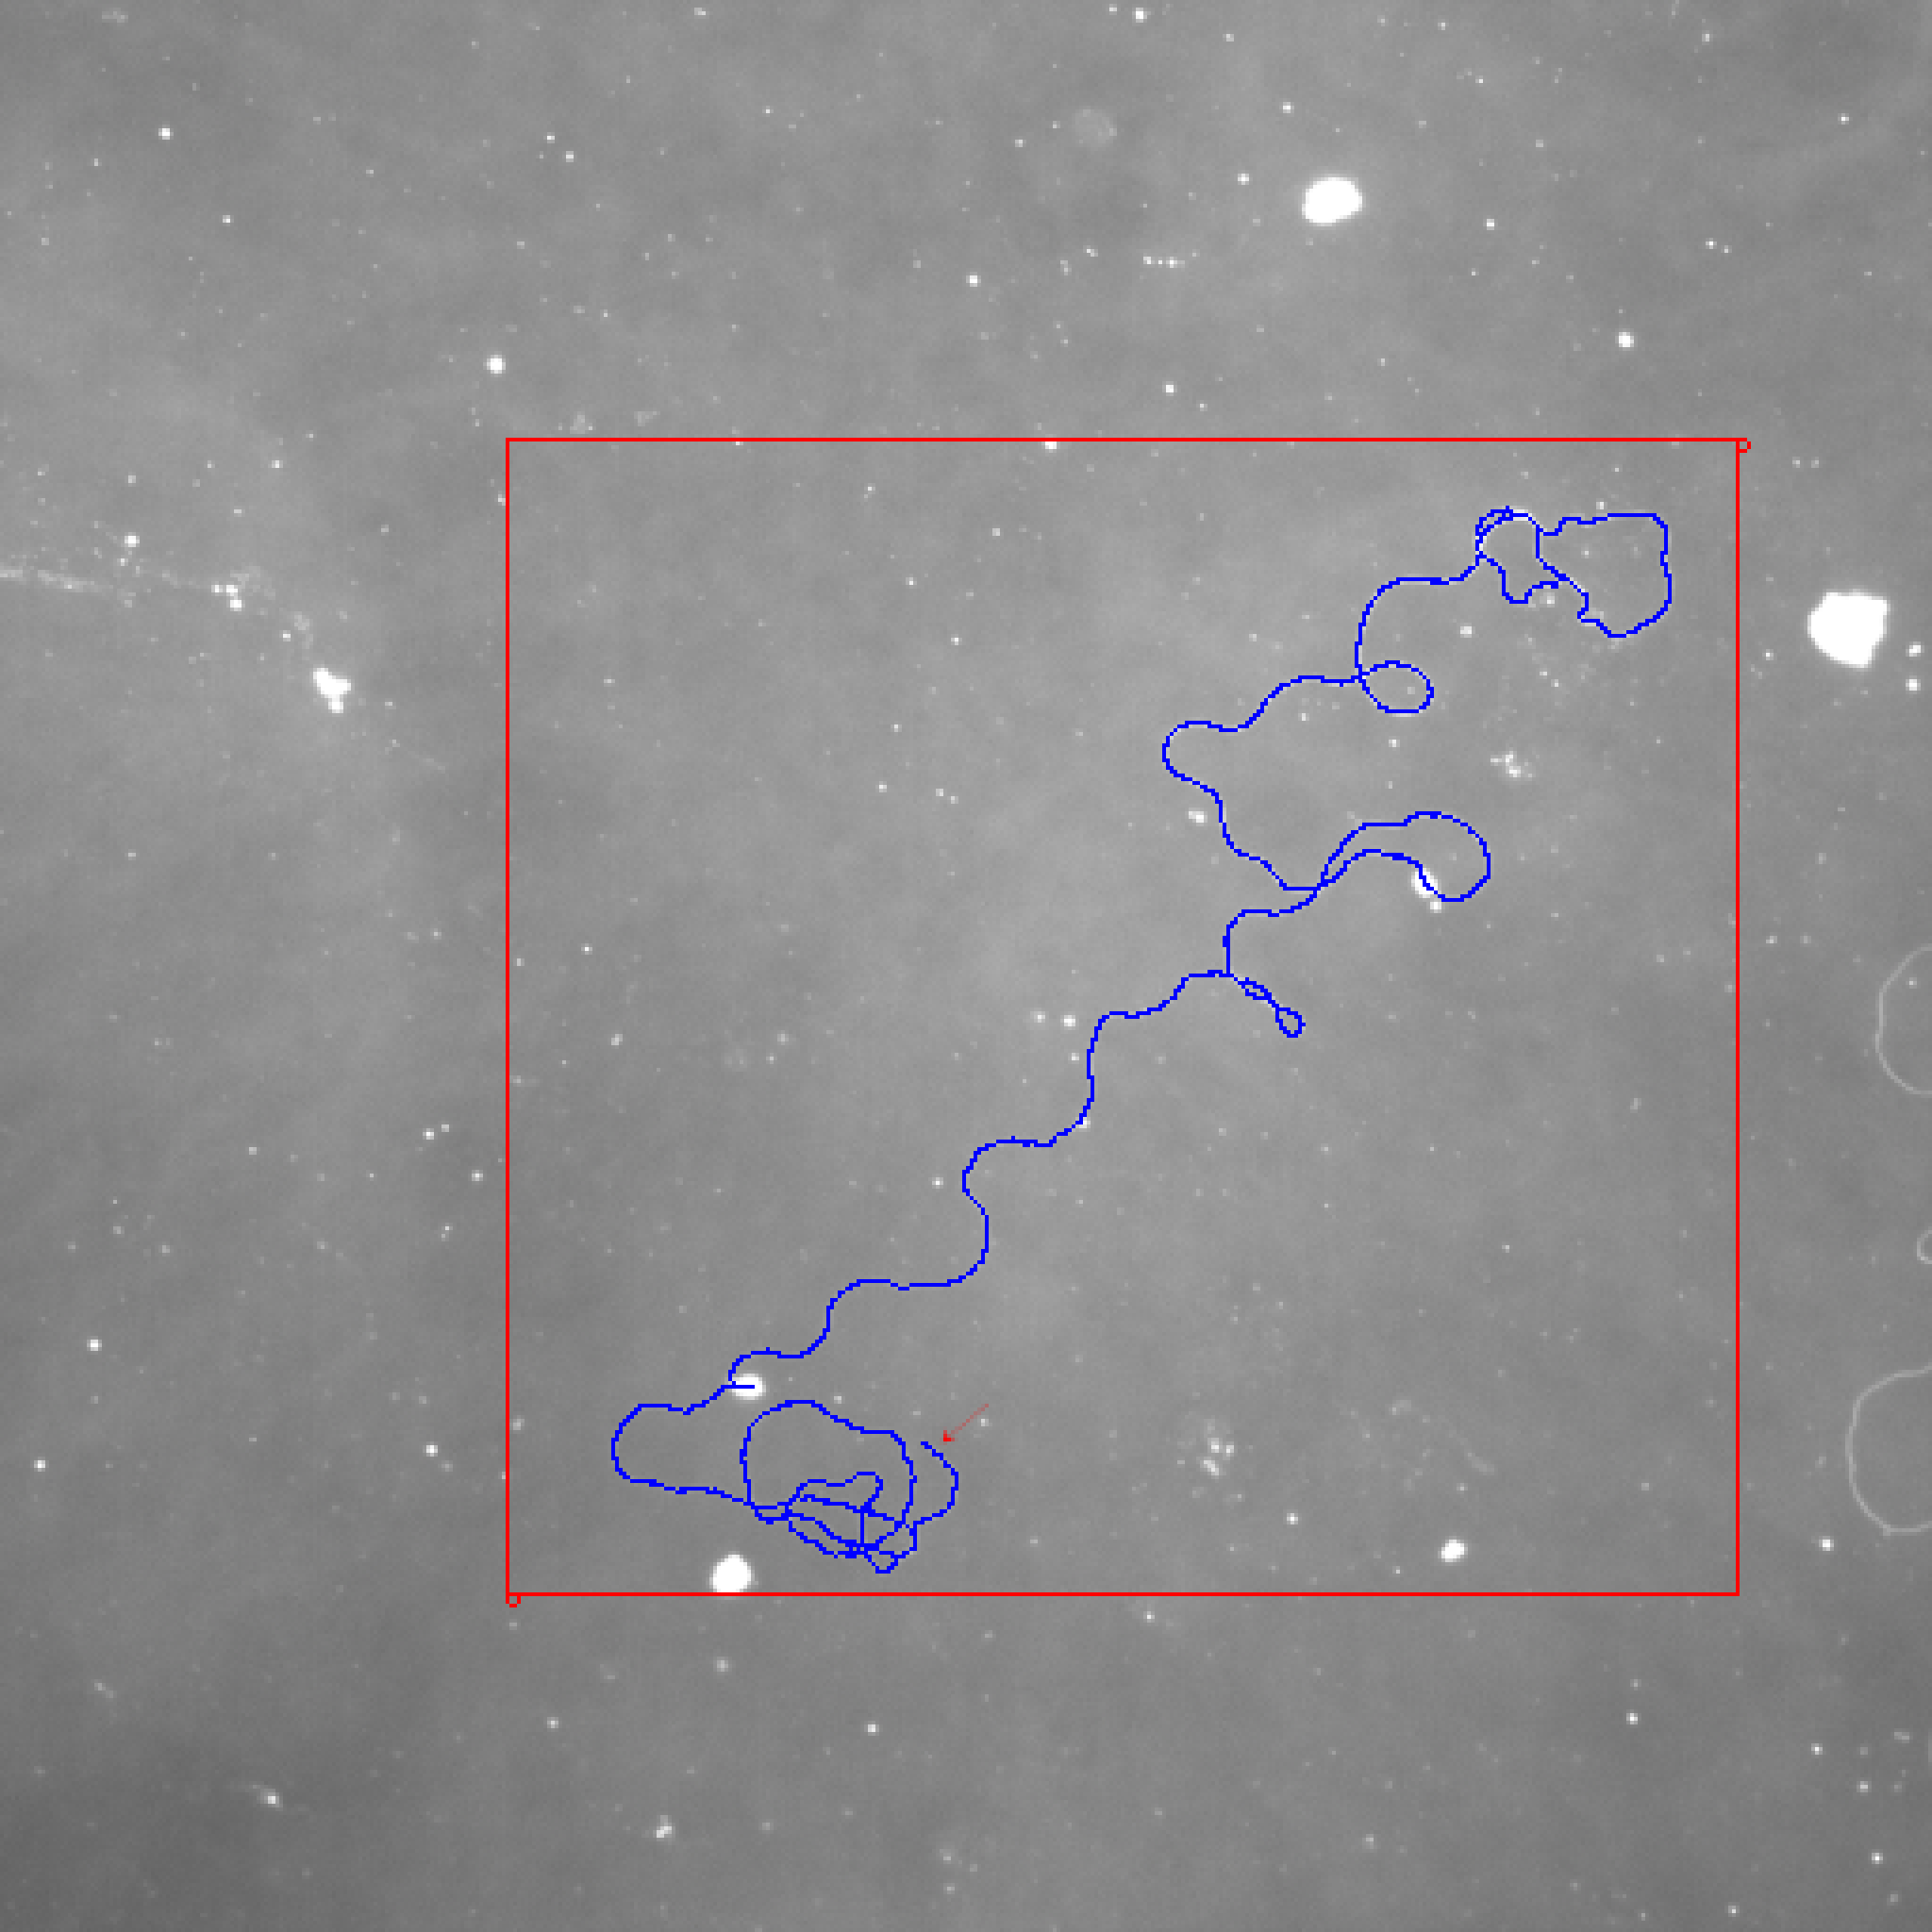
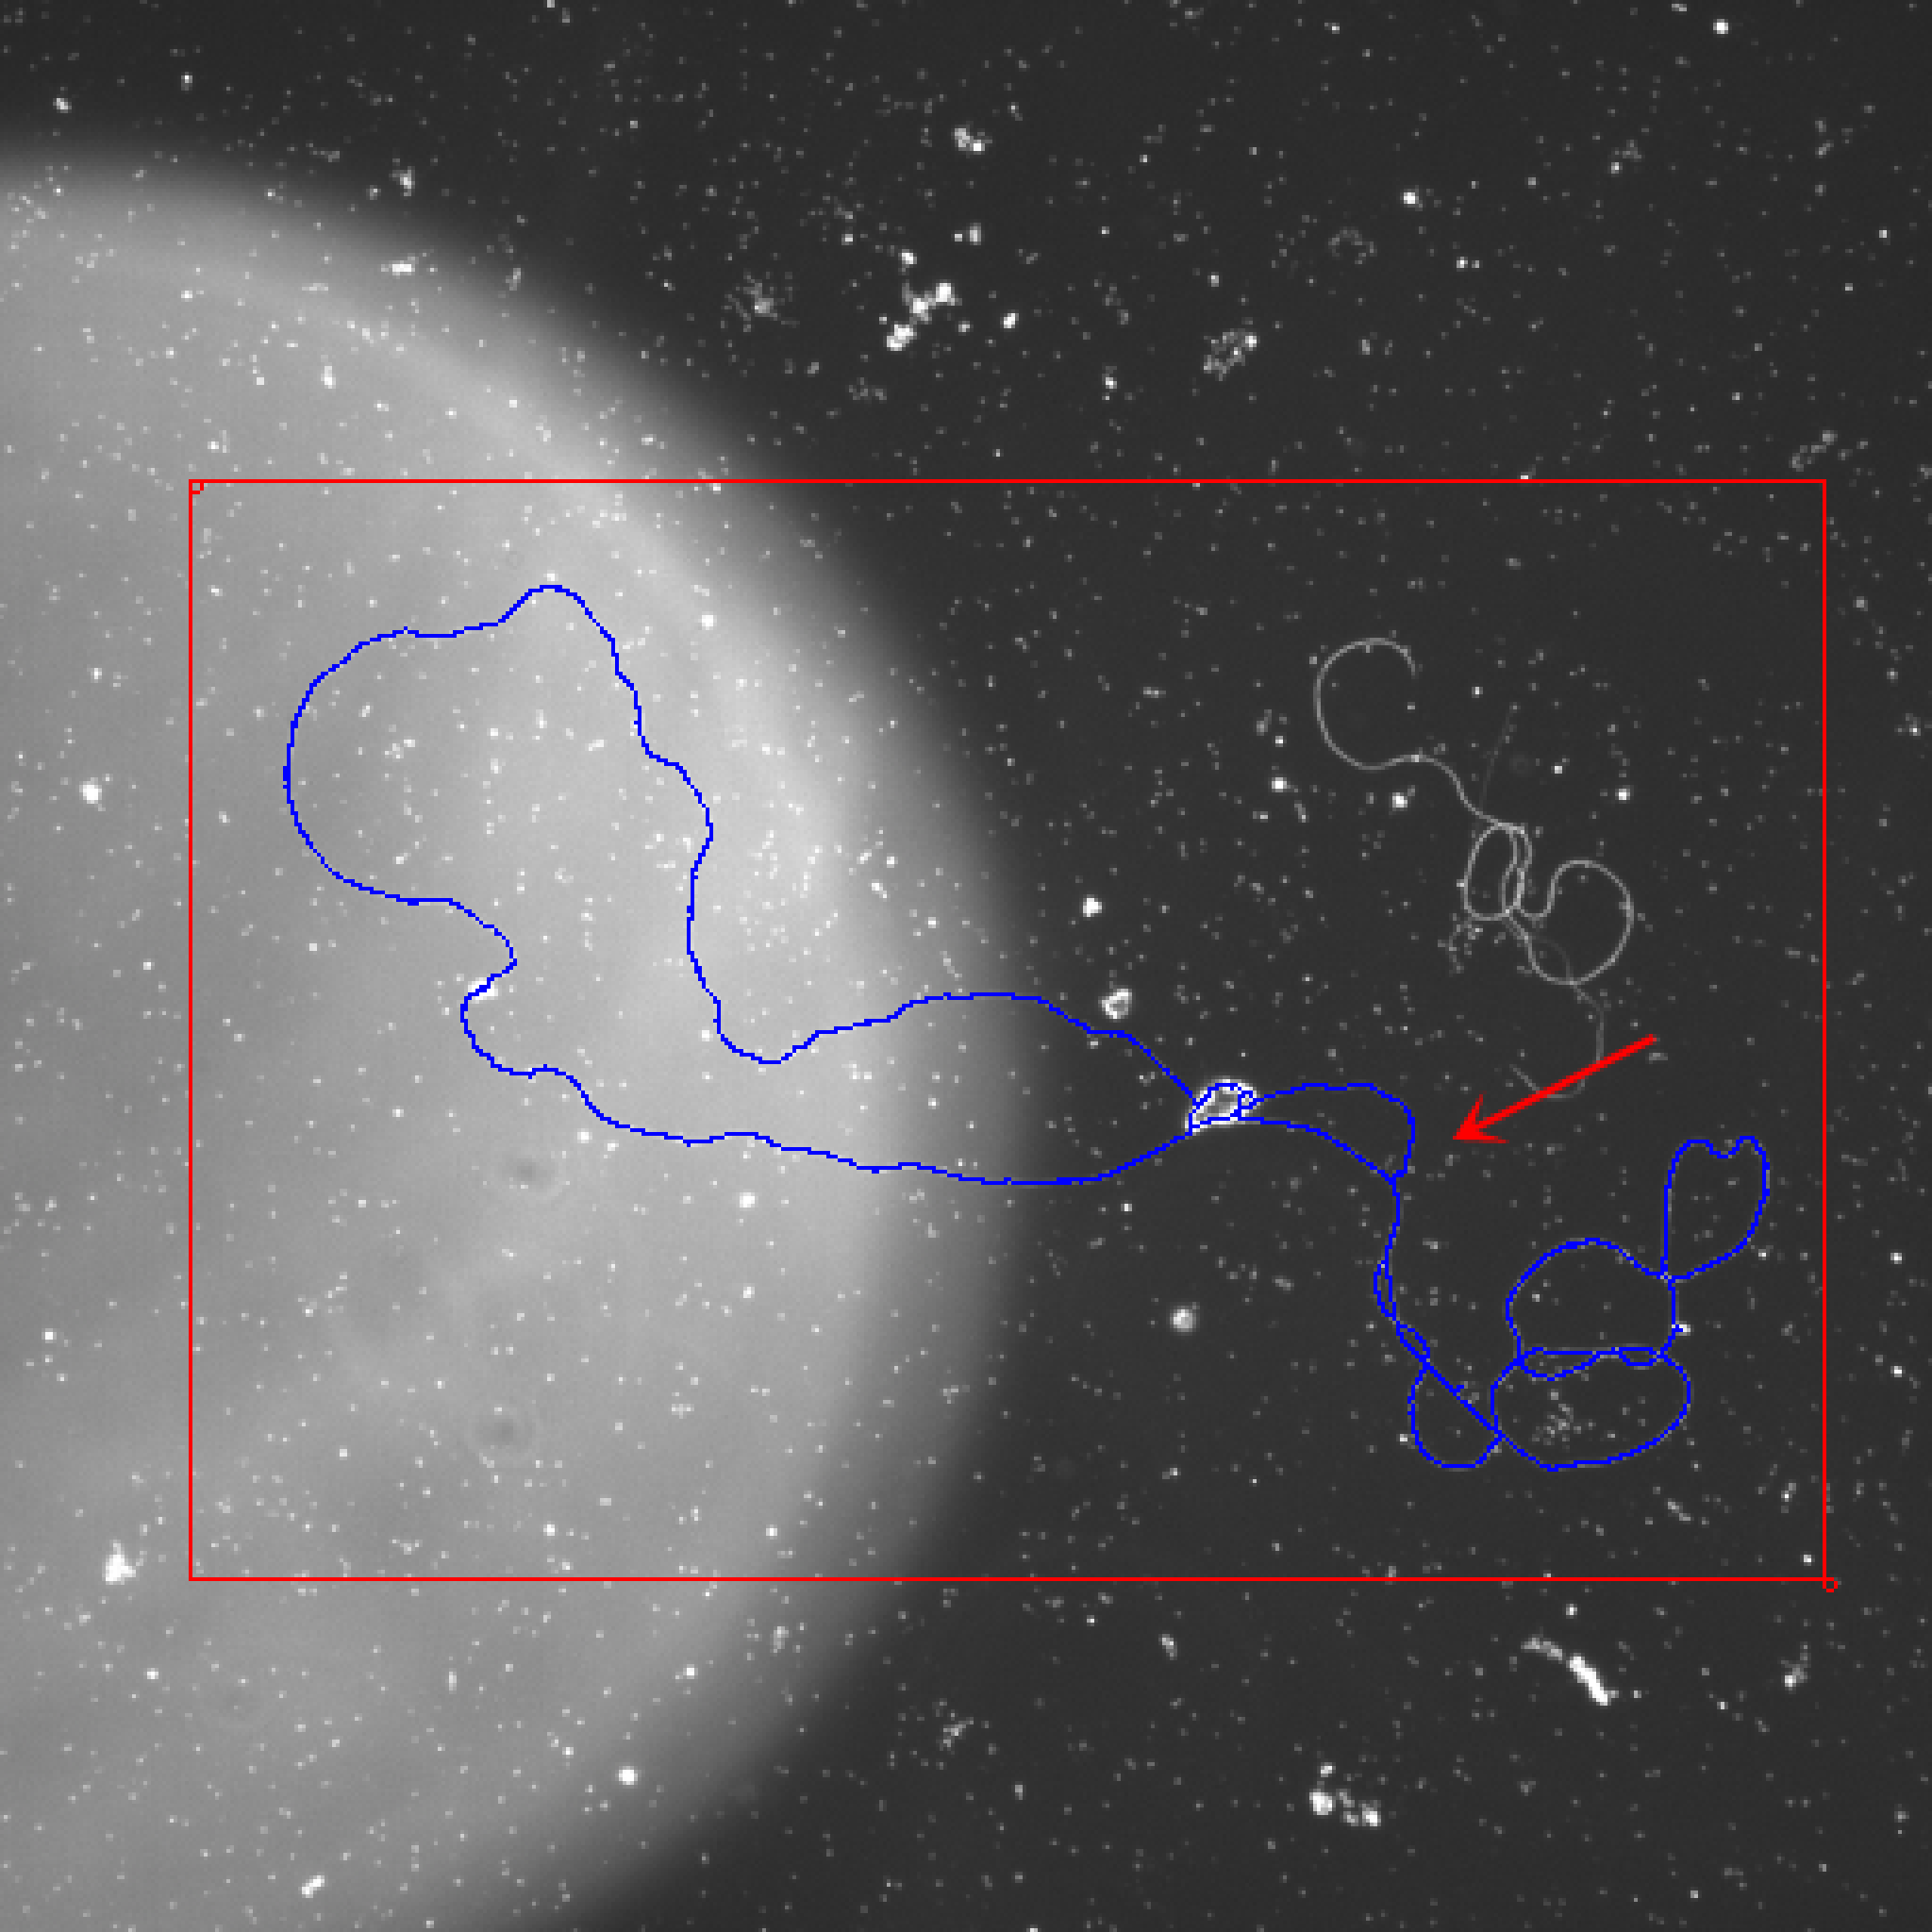
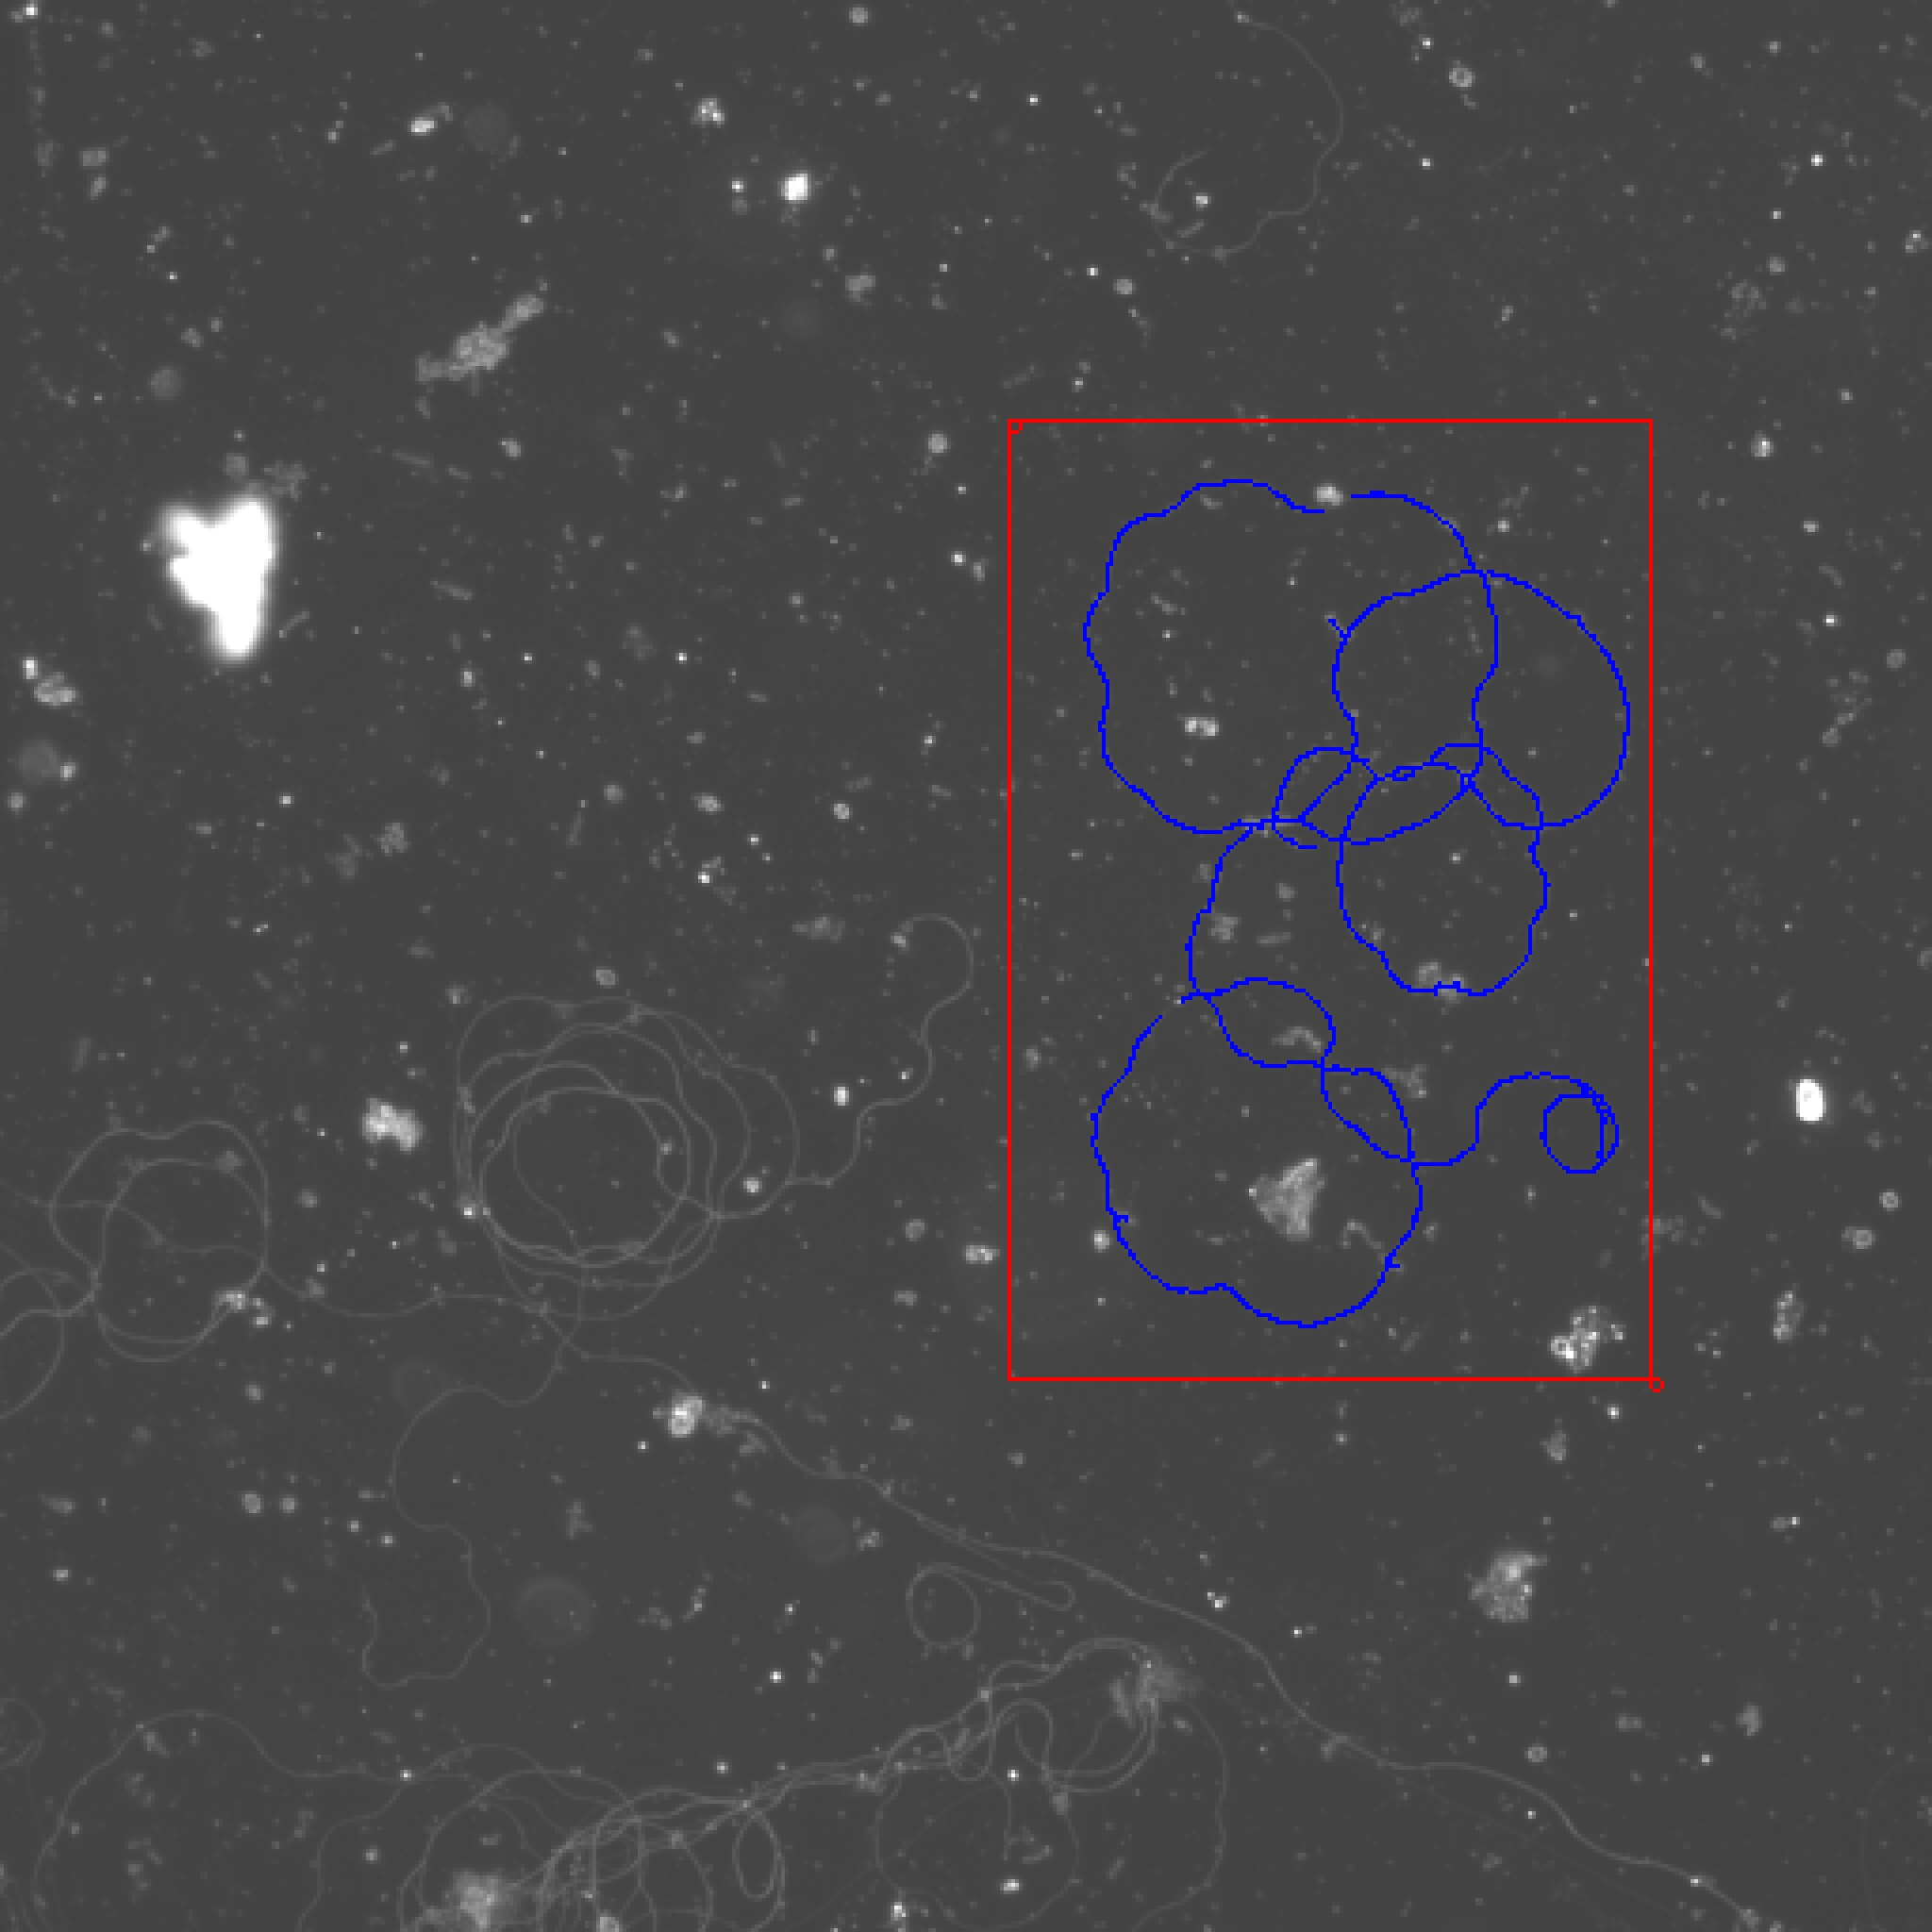
24708.1_3 at 20X.jpg: Draw a rectangle and set k = 2.
My best result is 1842. The ground truth is 1786. The deviation is 3.14%.
| File Name | 24708.1_4 at 20X.jpg | 24708.1_5 at 20X.jpg | 24708.1_6 at 20X.jpg | WT.C.1_20x.jpg | WT.C.2_20x.jpg |
|---|---|---|---|---|---|
| My best result | 1678 | 2213 | 2587 | 978 | 2178 |
| Ground truth | 1681 | 1952 | 1991 | 1090 | 1847 |
| Deviation | -0.18% | 13.37% | 29.93% | -10.28% | 17.92% |
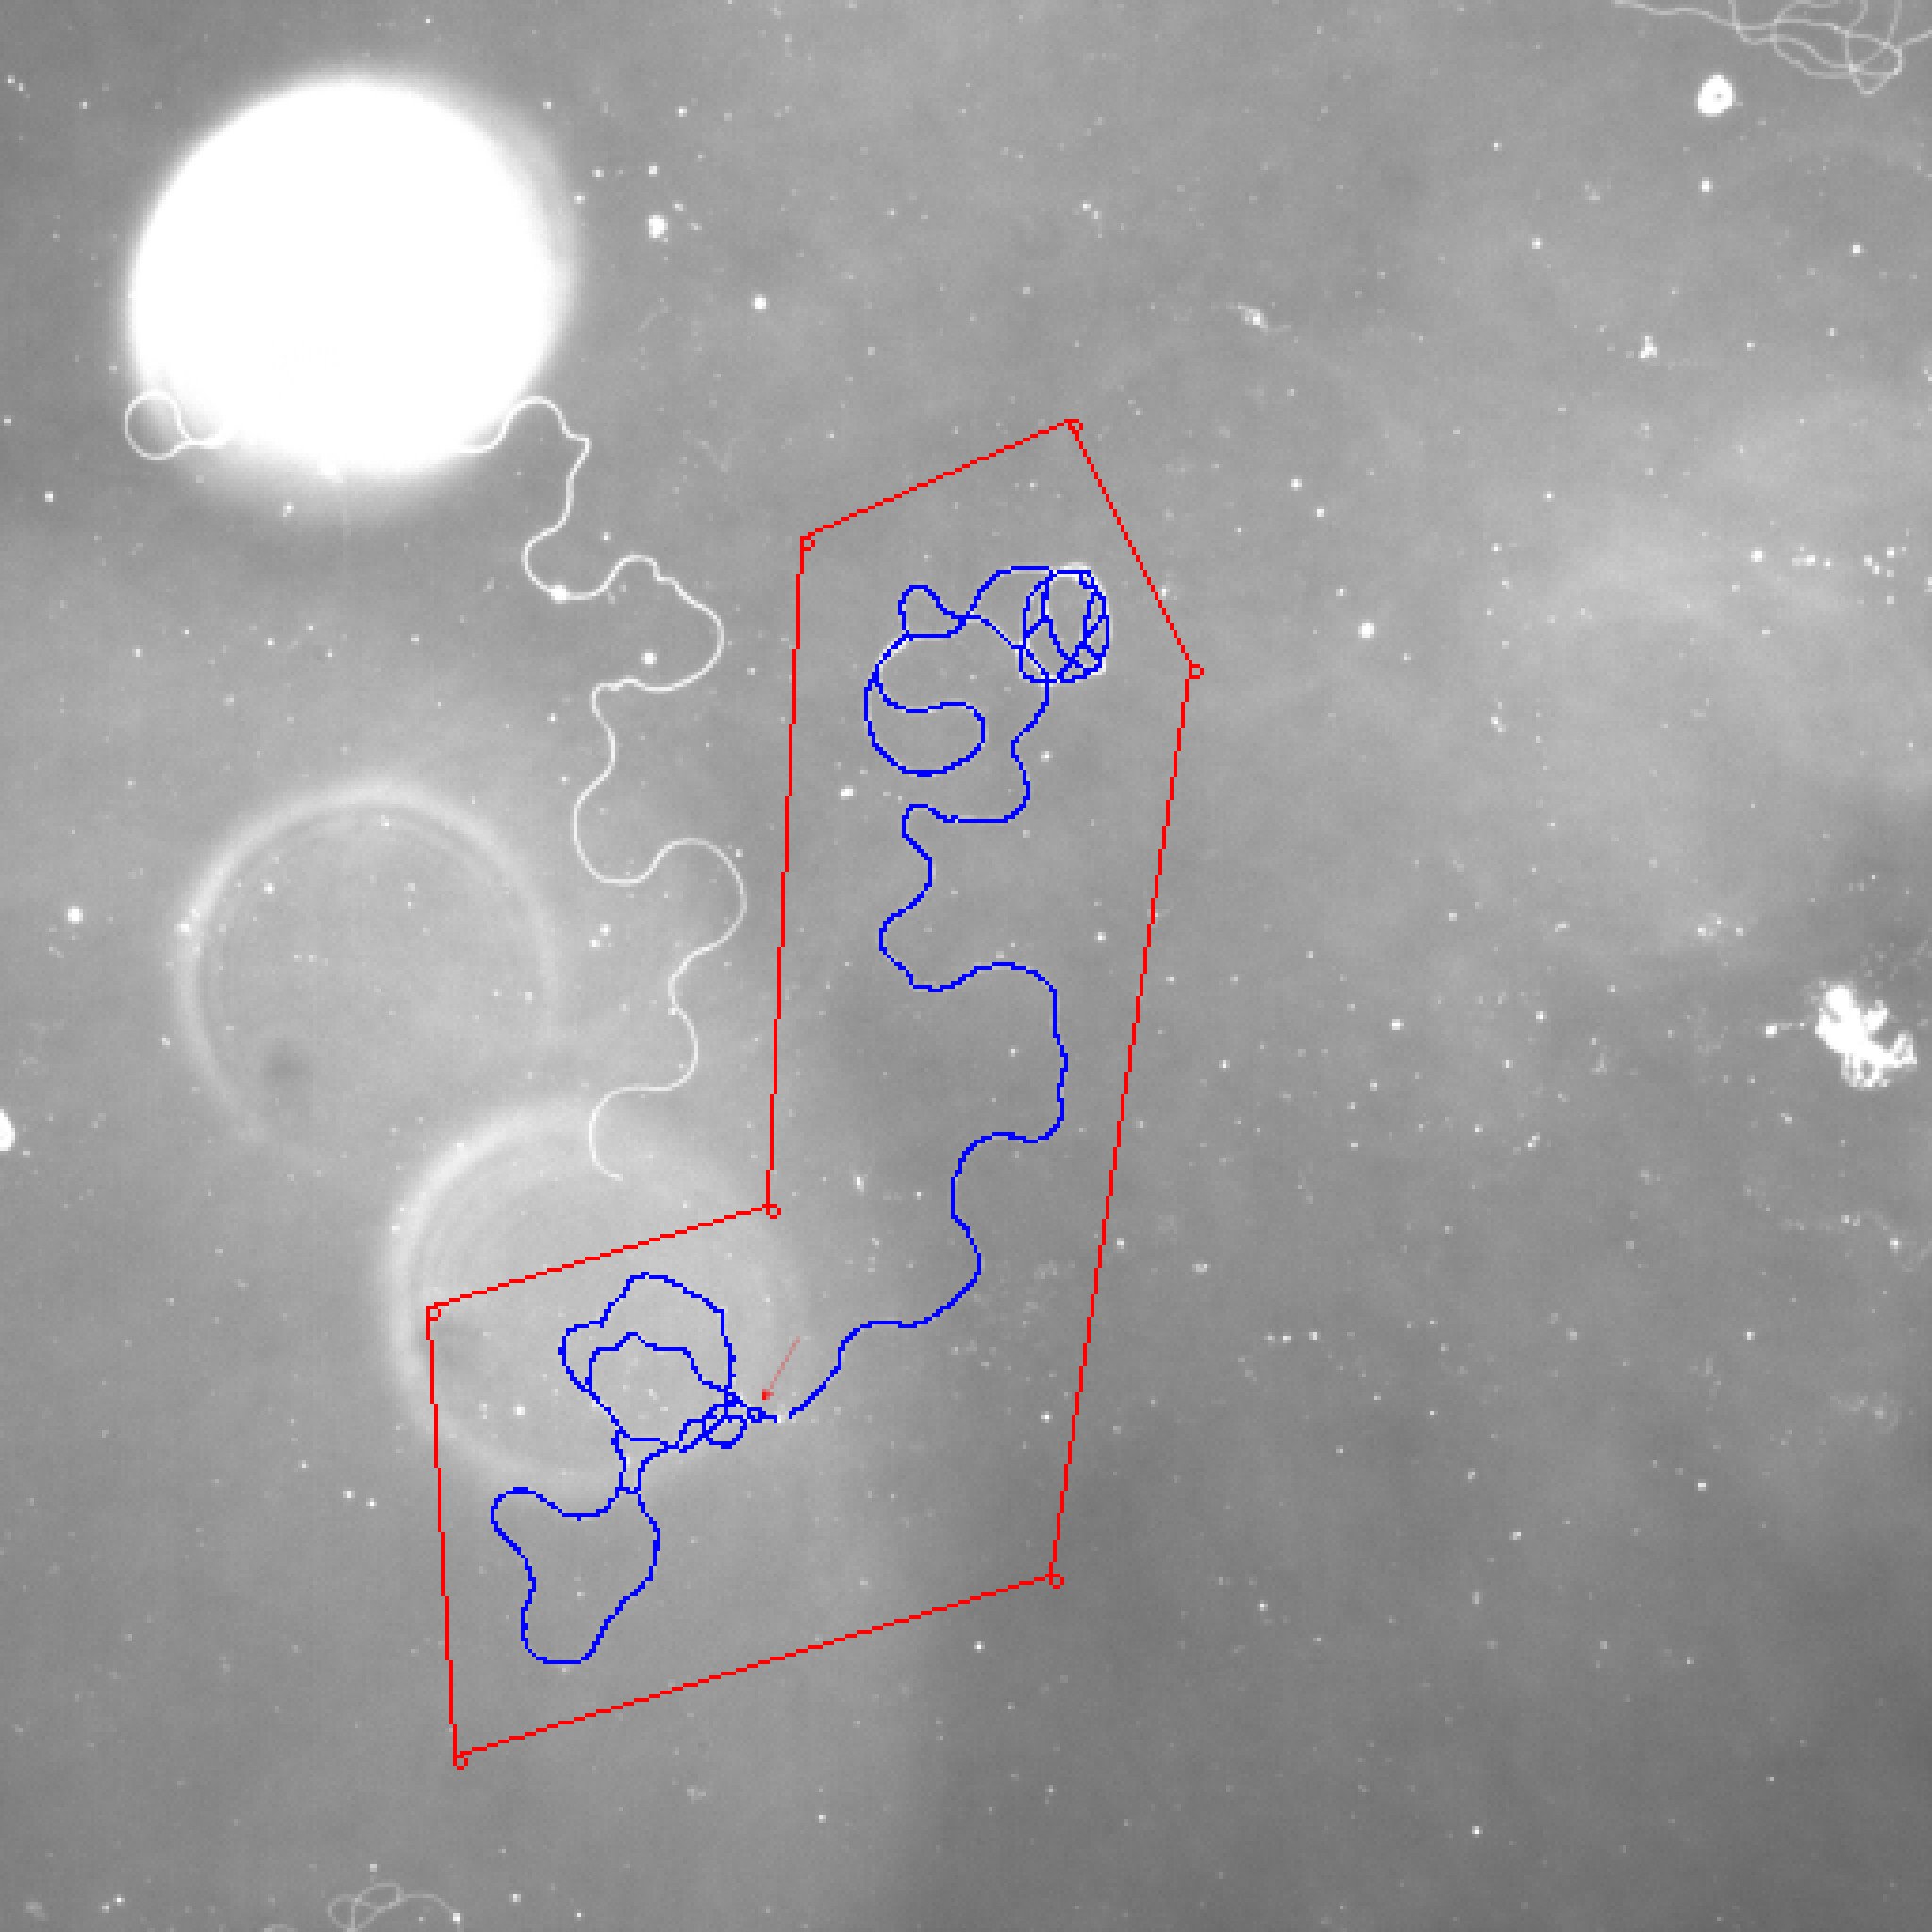
24708.1_4 at 20X.jpg: Draw a polygon and set k = 2.
My best result is 1678. The ground truth is 1681. The deviation is 0.18%.
24708.1_5 at 20X.jpg: Draw a polygon and set k = 1.
My best result is 2213. The ground truth is 1952. The deviation is 13.37%.
24708.1_6 at 20X.jpg: Draw a rectangle and set k = 7.
My best result is 2587. The ground truth is 1991. The deviation is 29.93%.
WT.C.1_20x.jpg: Increase contrast 3 times and draw a polygon and set k = 9.
My best result is 978. The ground truth is 1090. The deviation is 10.28%.
WT.C.2_20x.jpg: Increase contrast 4 times and draw a polygon and set k = 9.
My best result is 2178. The ground truth is 1847. The deviation is 17.92%.
| File Name | 28369.2.6_2.jpg | 28369.2.6_3.jpg | 472.1A.1_5 | 472.1A.1_4 | LHM.1B.3_2&3 | LHM.1B.3_7 | 472.1B.1_5&6 | 53387.1B.2_7&8 | 472.1A.1_2.jpg | 42568.b4.7 | 472.1A.1_3 |
|---|---|---|---|---|---|---|---|---|---|---|---|
| My best result | 2000 | 2070 | 1680 | 1541 | 1733 | 1571 | 2061 | 2088 | bad result | bad result | bad result |
| Ground truth | 1798.116 | 1820.409 | 1827.506 | 1836.393 | 1847 | 1849.383 | 1870.82 | 1873.806 | 1721.22 | 1840.172 | 1849.996 |
| Deviation | 11.23% | 13.74% | -7.94% | -16.07% | -6.17% | -15.05% | 10.17% | 11.43% | N/A | N/A | N/A |
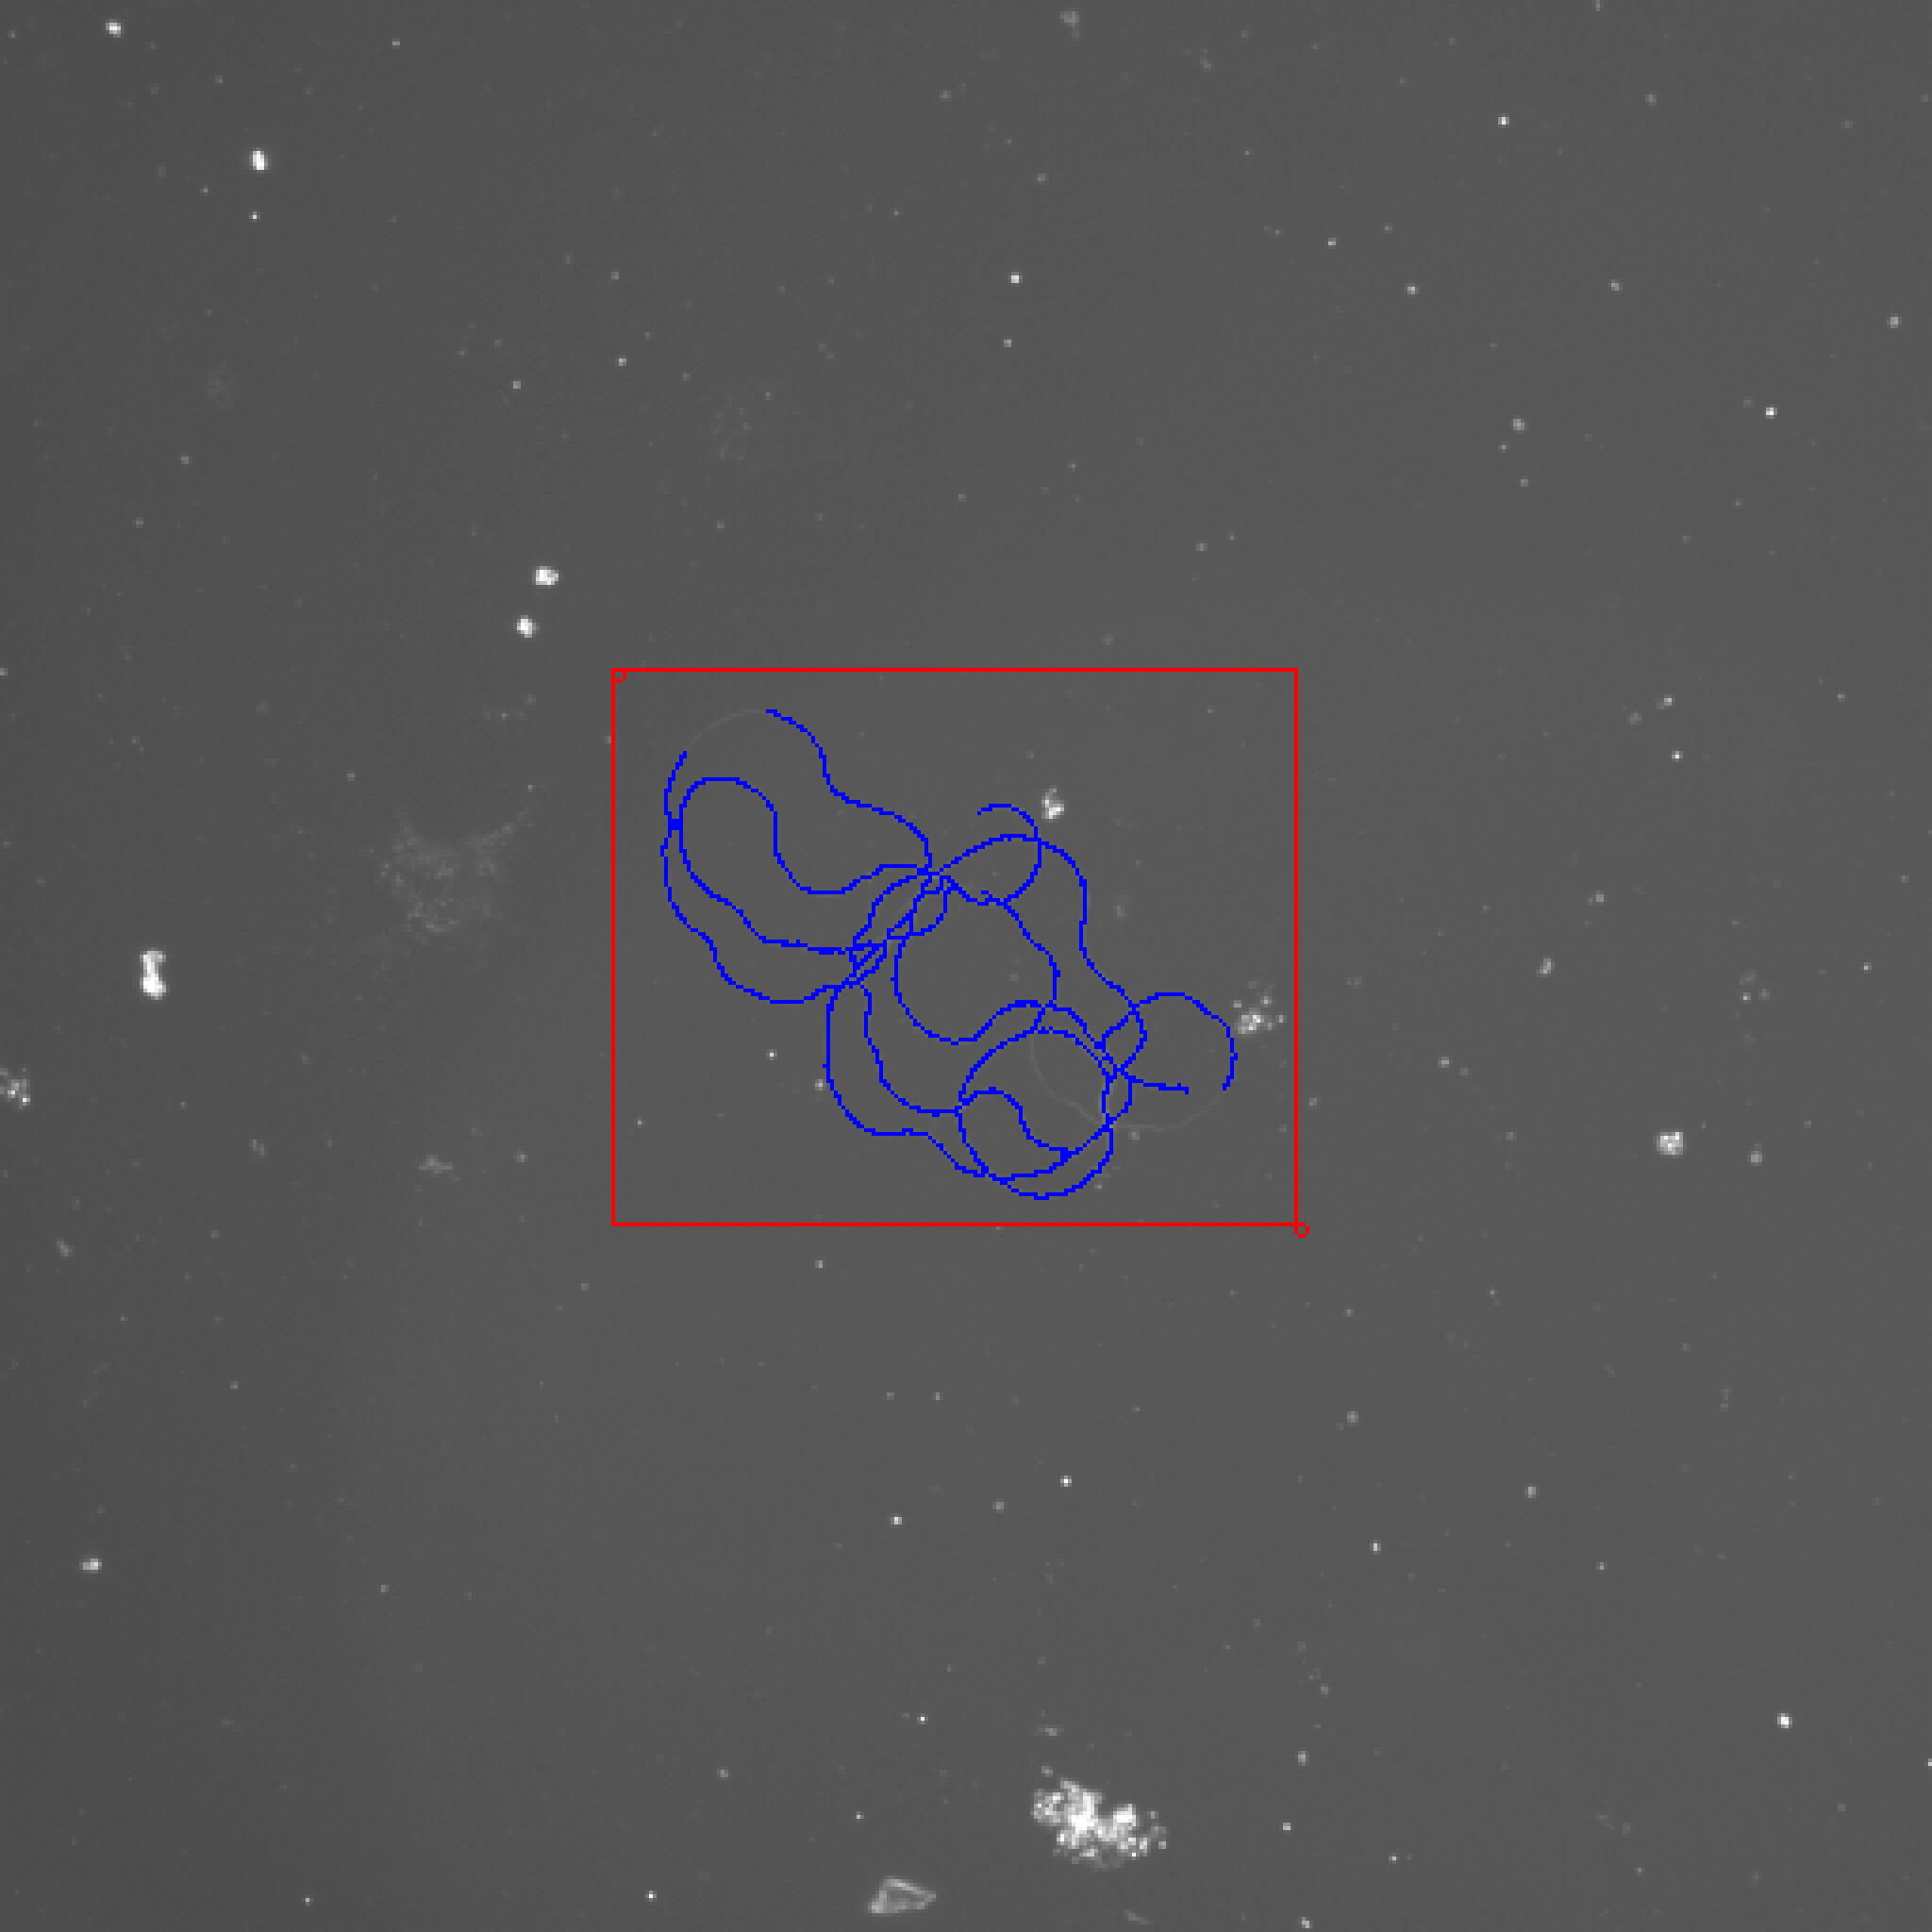
28369.2.6_2.jpg: Draw a rectangle and set k = 1.
My best result is 2000. The ground truth is 1798.116. The deviation is 11.23%.
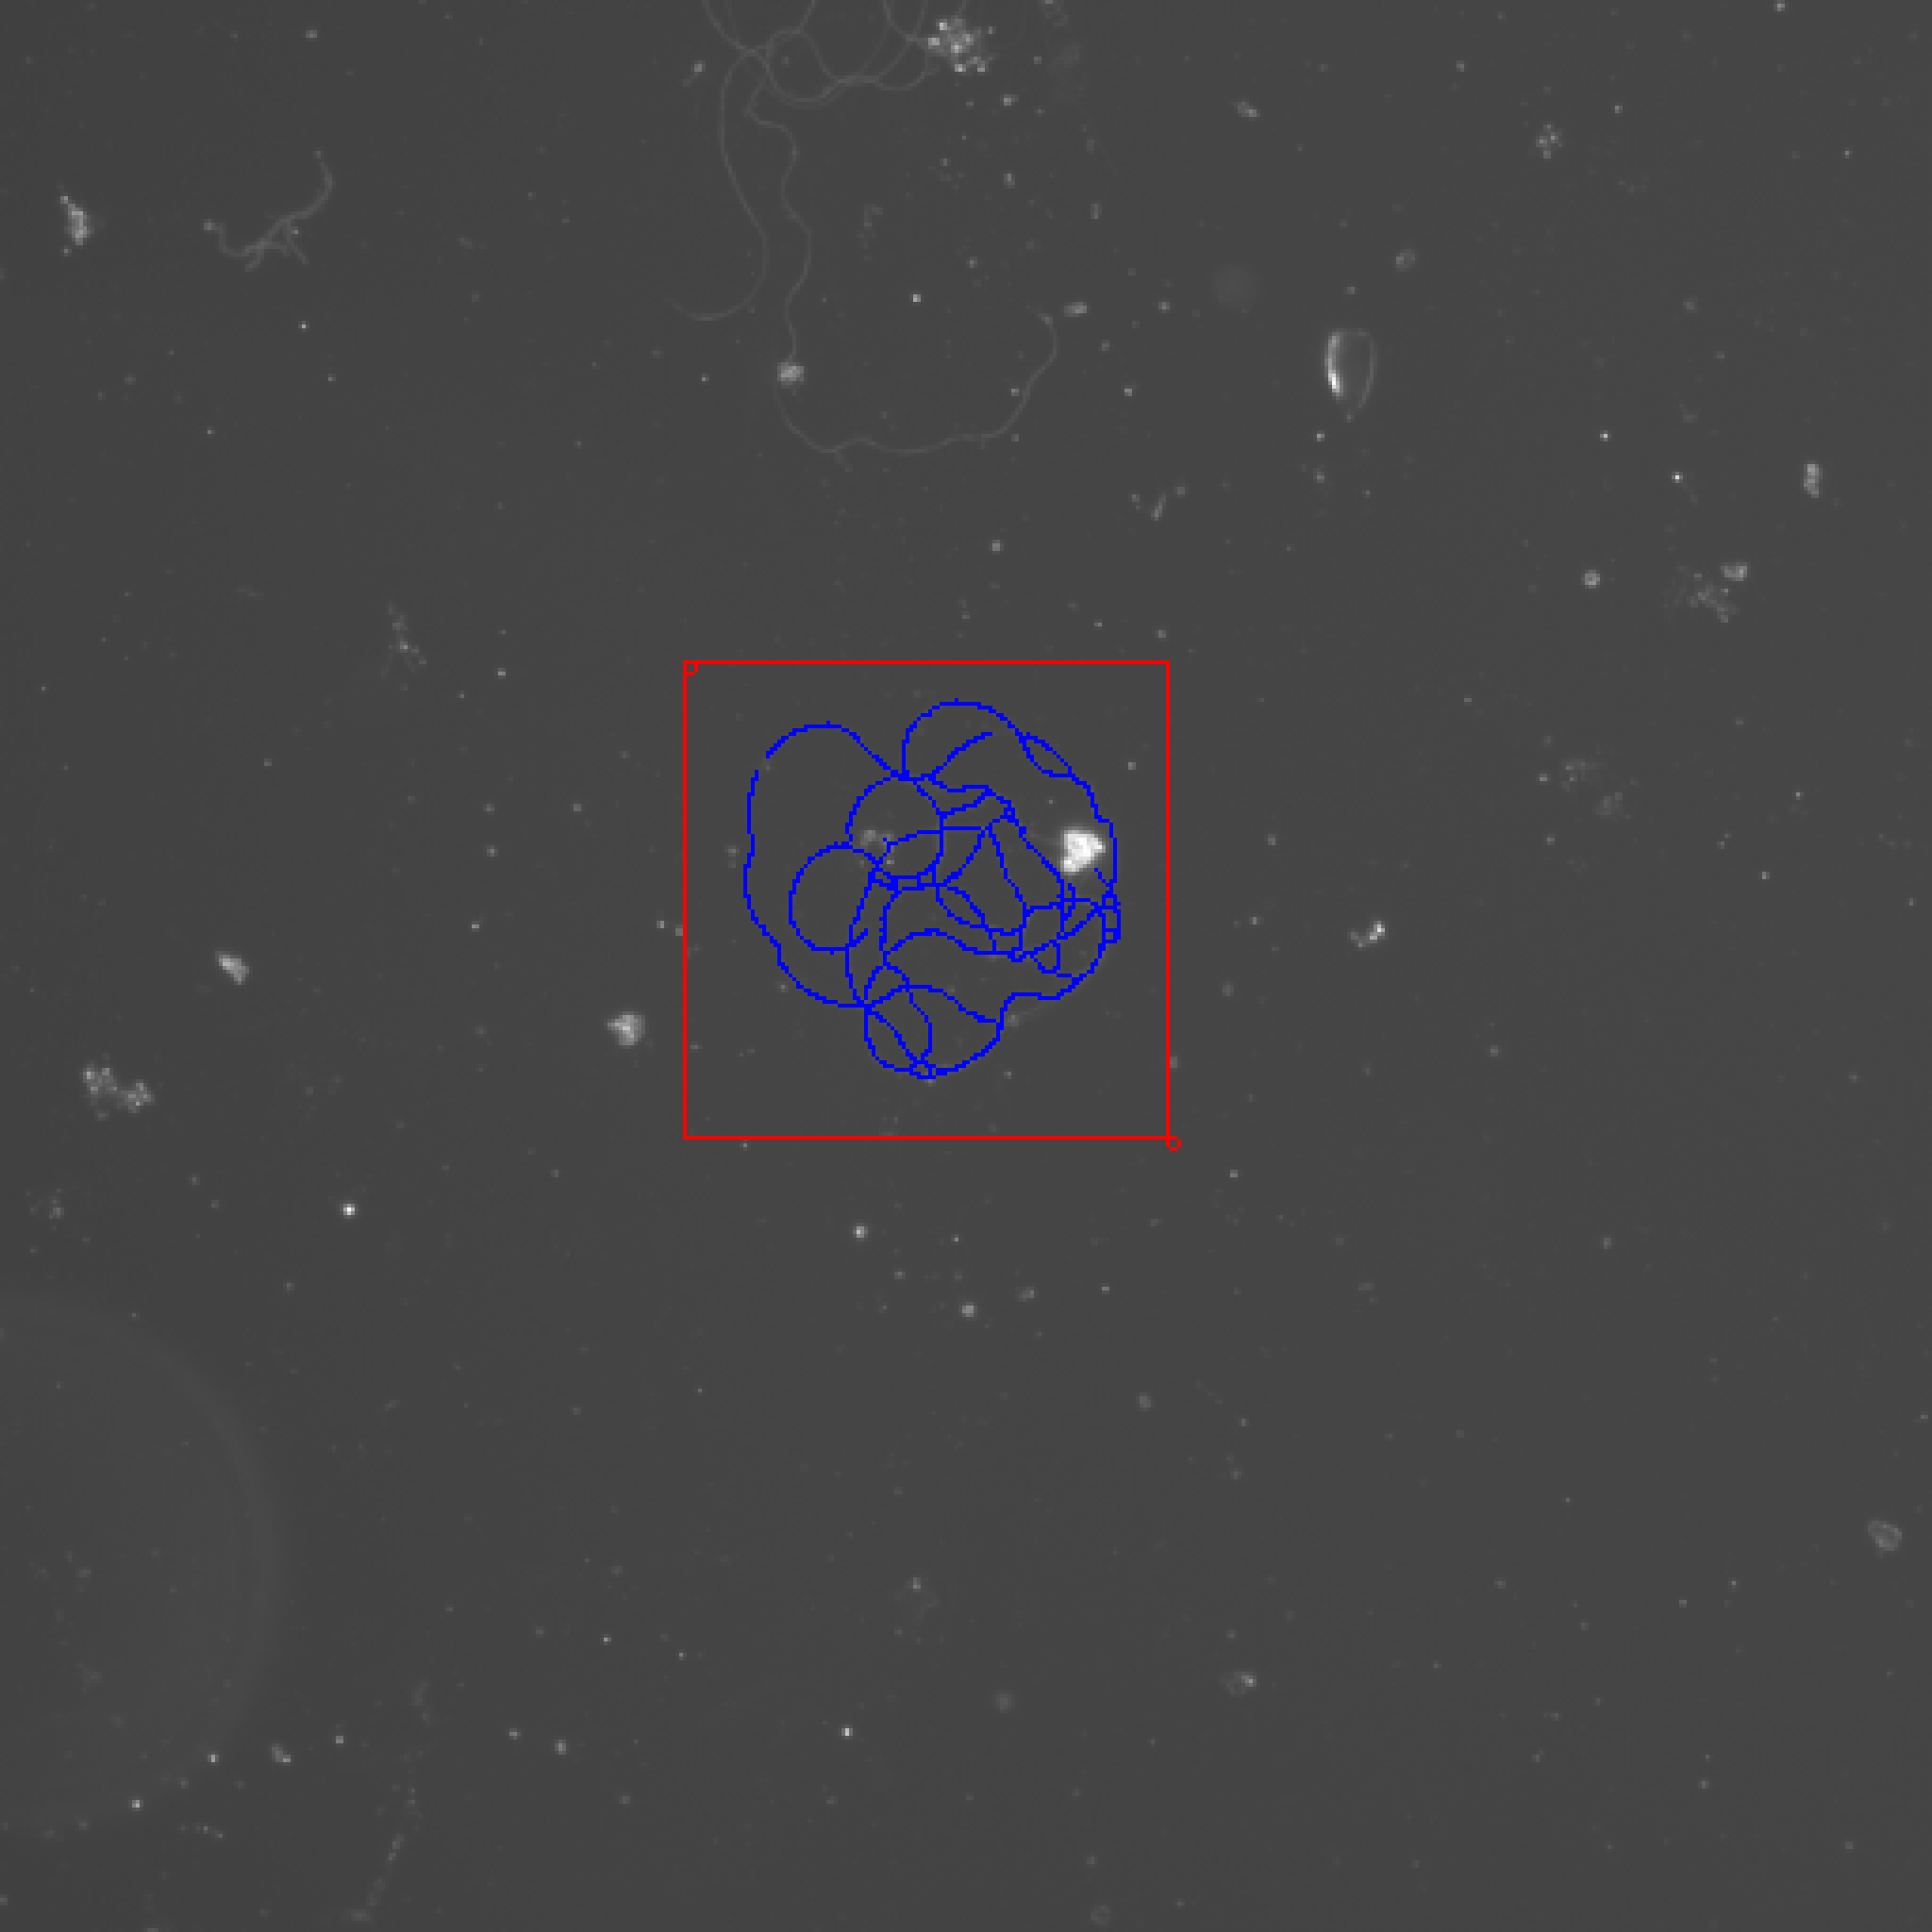
28369.2.6_3.jpg: Draw a rectangle and set k = 1.
My best result is 2070. The ground truth is 1820.409. The deviation is 13.74%.
472.1A.1_5.jpg: Increase contrast 5 times, draw a rectangle and set k = 1.
My best result is 1680. The ground truth is 1827.506. The deviation is 7.94%.
472.1A.1_4.jpg: Draw a rectangle and set k = 1.
My best result is 1541. The ground truth is 1836.393. The deviation is 16.07%.
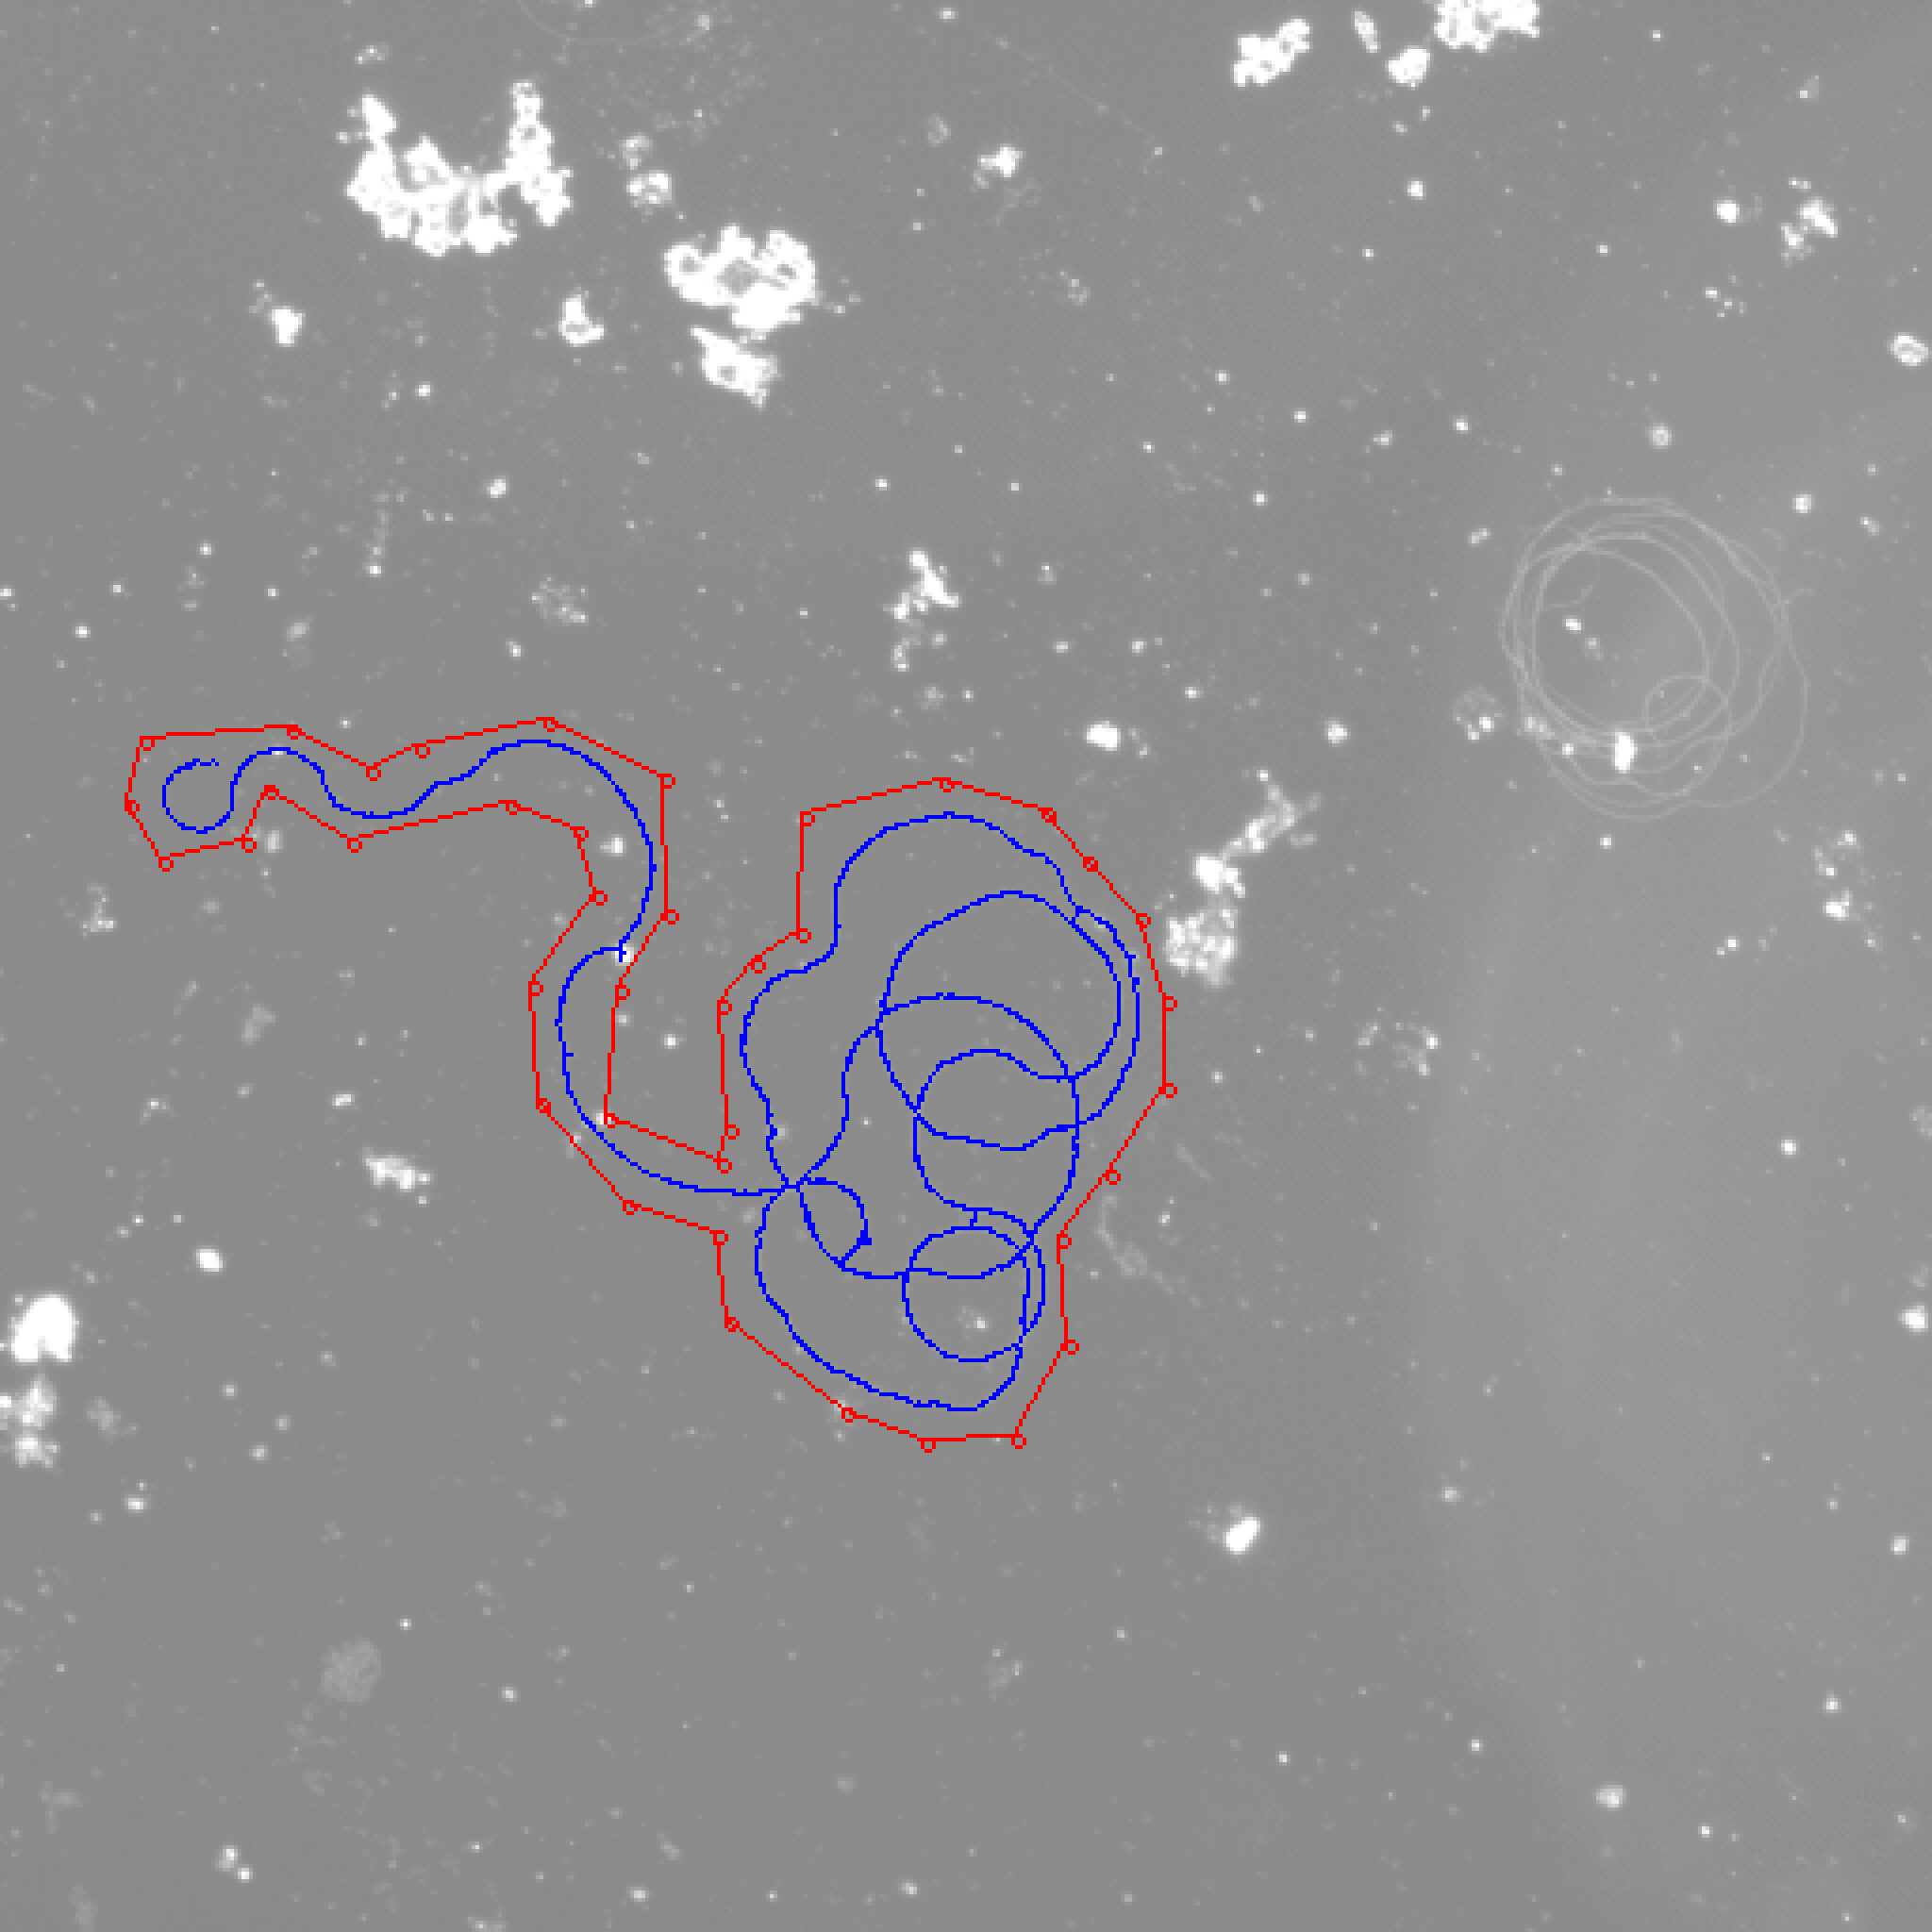
LHM.1B.3_2&3.jpg: Draw a polygon and set k = 6.
My best result is 1733. The ground truth is 1847. The deviation is 6.17%.
LHM.1B.3_7.jpg: Draw a rectangle and set k = 1.
My best result is 1571. The ground truth is 1849.383. The deviation is 15.05%.
472.1B.1_5&6.jpg: Draw a rectangle and set k = 1.
My best result is 2061. The ground truth is 1870.82. The deviation is 10.17%.
53387.1B.2_7&8.jpg: Increase contrast 5 times and draw a polygon and set k = 7.
My best result is 2088. The ground truth is 1873.806. The deviation is 11.43%.
