Paper: MultivariateStatistics_CaseStudy_PCA_FA_CCA.pdf Code: MultivariateStat_PCA_FA_CCA_code.R
Case Study in ranking U.S. cities based on a single linear combination of rating variables. Dimensionality techniques used in the analysis are Principal Component Analysis (PCA), Factor Analysis (FA), Canonical Correlation Analysis (CCA).
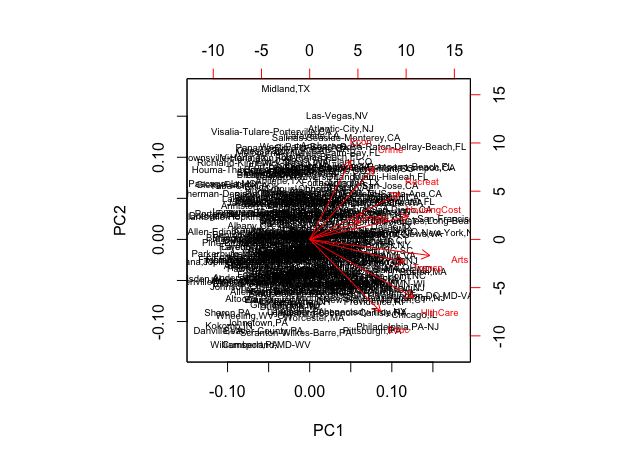
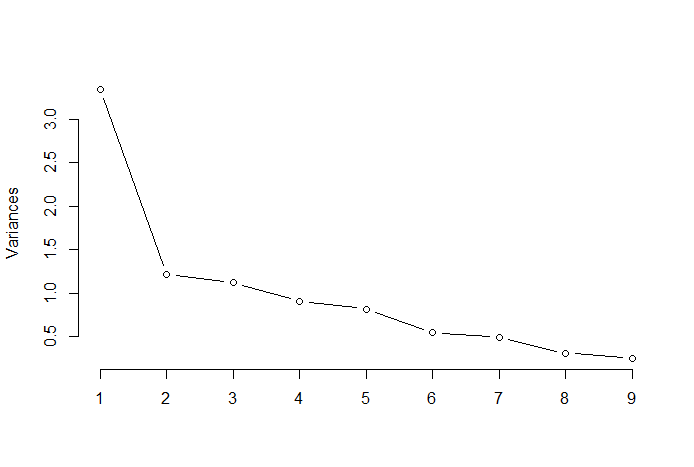
Principal Component Analysis (PCA) Screenshots
Biplot with scaled data where yoou can observe that Crime and Education have the smallest margins and the remaining variables show substantial variations. First three principal components explain 63.10% of the total variation in data. Applying the ”elbow rule” it can be seen that one can optimally retain 3 components.
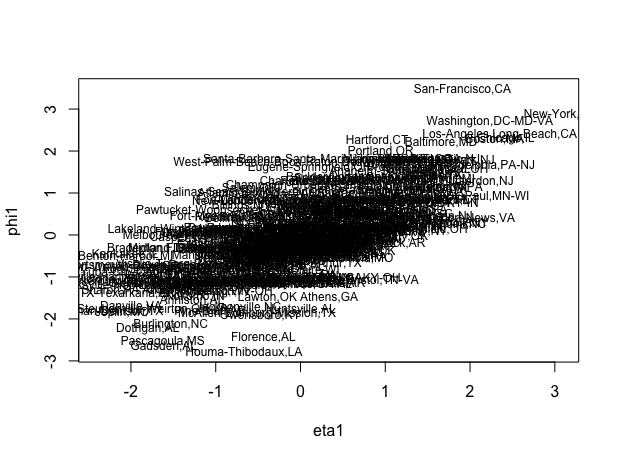
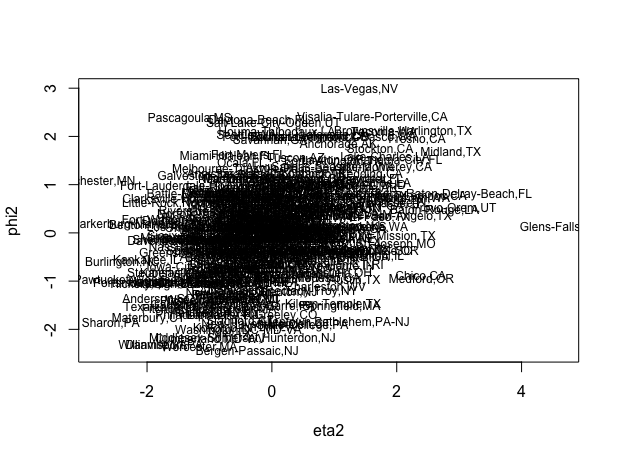
Canonical Correlation Analysis (CCA) Screenshots
Figures showing clear correlation between X and Y scores for the first canonical correlation which is not the case for the second factor, where one can observe some correlation but not significant. This shows that the first canonical correlation is important but second one is not.