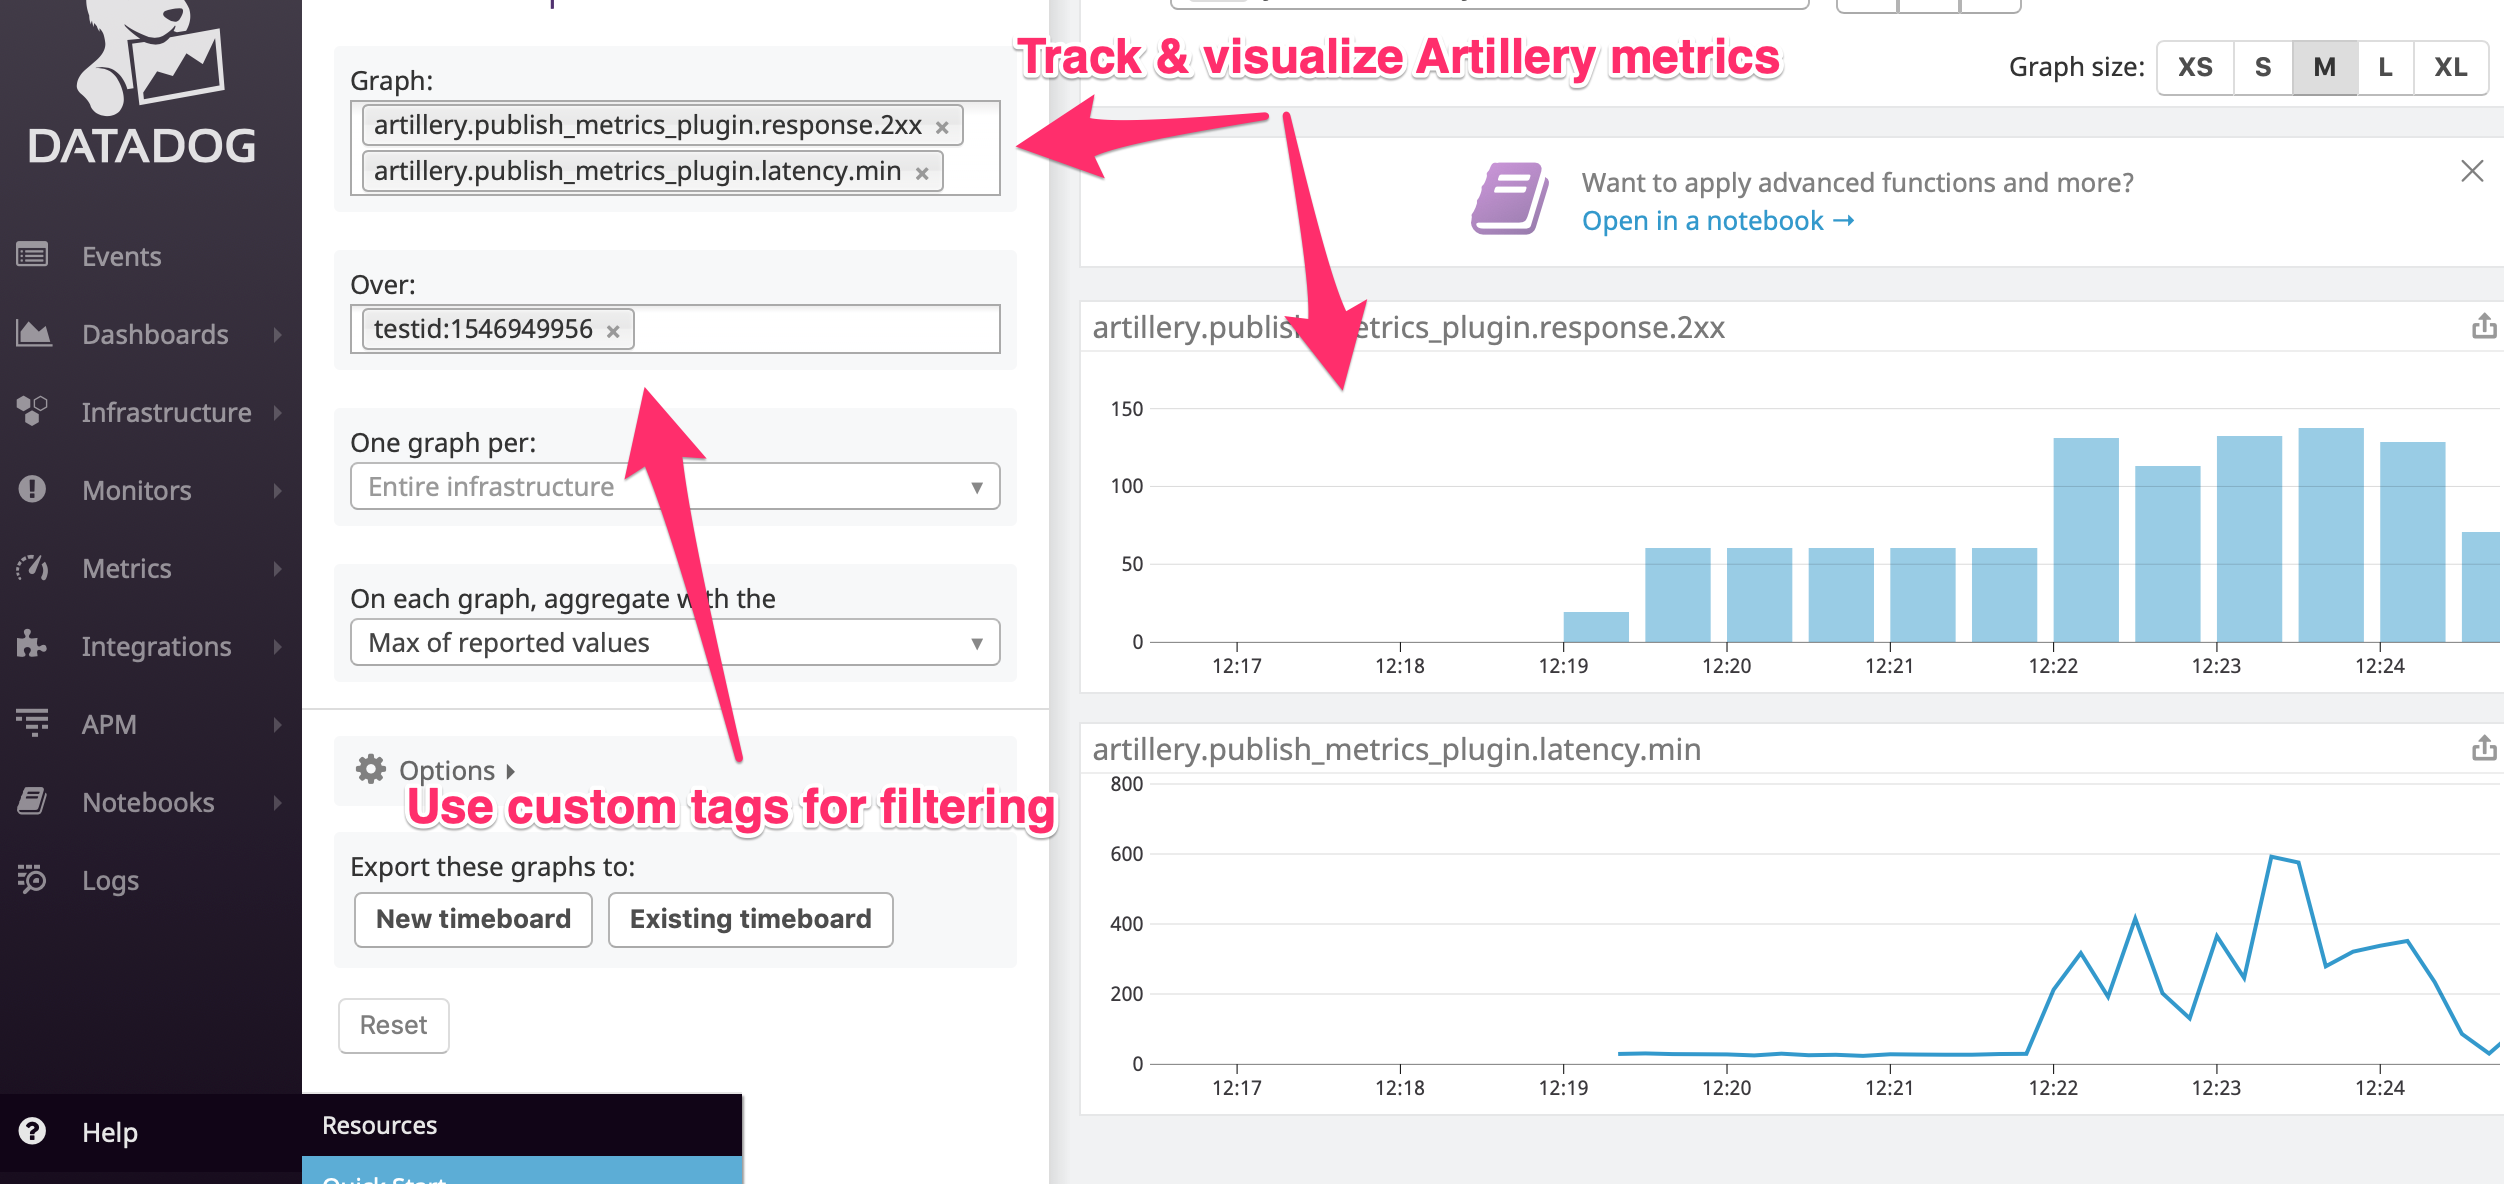
Use this plugin to send metrics tracked by Artillery (e.g. response latency, network errors, HTTP response codes) to an external monitoring/observability system.
Supported targets:
- Datadog 🐶 (via agent or HTTP API)
- Honeycomb 🐝
- InfluxDB with Telegraf + StatsD plugin
- StatsD
The plugin needs to be installed in the same scope (globally or as a project-specific dependency) as Artillery.
If you installed Artillery globally (i.e. with npm install -g artillery) then the plugin needs to be installed globally too:
npm install -g artillery-plugin-publish-metricsIf artillery is installed as a project-specific dependency (i.e. in a directory with package.json in it), install it with:
t
npm install artillery-plugin-publish-metrics |
|---|
| Track, graph and visualize Artillery metrics alongside metrics from your applications and infrastructure |
- Virtual user metrics:
scenarios.created,scenarios.completed- number of sessions created and successfully completed - HTTP-specific metrics:
requests.completed-- number of requests completed successfullylatency.min / max / median / p95 / p99-- response time latency distributioncodes.2xx / 3xx / 4xx / 5xx-- response code countsrps.mean-- mean per/second rate of successful responses
- Errors:
error_count- total number of errors encountered (useful for setting alerts that don't enumerating specific error codes)errors.ETIMEOUT / ENOTFOUND / EMFILE- count of specific error codes
An example configuration to publish metrics to Datadog via its HTTP API:
config:
  plugins:
    publish-metrics:
      - type: datadog
        apiKey: "{{ $processEnvironment.DD_API_KEY }}"
        prefix: artillery.
        tags:
          - team:sre
          - component:eu-payments-backend
          - region:eu-west-1
        event:
          tags:
- team:sreThe plugin supports sending metrics to an already running Datadog agent or directly to Datadog API. If Datadog agents have already been set up on your infrastructure, then publishing via the agent is probably preferable. Publishing via the HTTP API is useful when running in environments which do not have the agent (e.g. when running Artillery on AWS Lambda or AWS Fargate).
- To send metrics to Datadog, set
typetodatadog - Set
apiKeyto an API key to send metrics directly to Datadog via its HTTP API, or: - If
apiKeyis not set, metrics will be sent to a Datadog agent:- Set
hostto the hostname/IP of the agent (defaults to127.0.0.1) - Set
portto the port that the agent is listening on (defaults to8125)
- Set
prefix-- use a prefix for metric names created by Artillery; defaults toartillery.tags-- a list ofname:valuestrings to use as tags for all metrics sent during a testevent-- send a Datadog event when the test starts/finishestitle-- set to customize the event title; defaults toArtillery.io Test+ timestamptext-- set to customize the event textpriority--normalorlow; defaults tolowtags-- a list of event specific tags in thevalue:nameformatalertType--error,warning,infoorsuccess; defaults toinfosend-- set tofalseto turn off the event. By default, if aneventis configured, it will be sent. This option makes it possible to turn event creation on/off on the fly (e.g. via an environment variable)
- To send events to Honeycomb, set
typetohoneycomb - Set
apiKeyto API/write key - Set
datasetto the name of a dataset you want to send events to - Optional: set
enabledtofalseto disable the integration - Optional: set
sampleRateto sample rate (default:1i.e. send all events) (Honeycomb docs)
Honeycomb integration sends an event for every HTTP response (rather than pre-aggregated metrics).
The following properties are set on every event:
url- full URL of the requesthost- hostname + portmethod- HTTP method, e.g.GETstatusCode- status code, e.g.200responseTimeMs- time-to-first-byte of the response in milliseconds
config:
  plugins:
    publish-metrics:
      - type: honeycomb
        apiKey: "{{ $processEnvironment.HONEYCOMB_API_KEY" }}
        dataset: load-testing
- To send events to AWS CloudWatch, set
typetocloudwatch - Set
regionto region you want to use (defaulteu-west-1) - Set
namespaceto set metric's namespace (default:artillery) - Set
nameto set metric's dimentionName(default:loadtest)
config:
  "plugins":
    publish-metrics:
      - type: cloudwatch
        region: "eu-west-1"
        name: "example"
- To send metrics to StatsD, set
typetostatsd - Set
hostandportto hostname/IP and port of the agent (if different from the default127.0.0.1:8125) - Set
prefixto use a custom prefix for metric names created by Artillery; defaults toartillery.
- To send metrics to Telegraf (with Telegraf's statsd Service Plugin), set
typetoinfluxdb-statsd - All other options are the same as for Datadog (other than
apiKeywhich is not relevant).
MPL 2.0
Please create an issue to report a bug or suggest an improvement.
To be implemented:
- InfluxDB (HTTP API)
- Splunk
- Prometheus
- ELK
- CloudWatch
(Want to help add your favorite monitoring system? Drop us a line.)