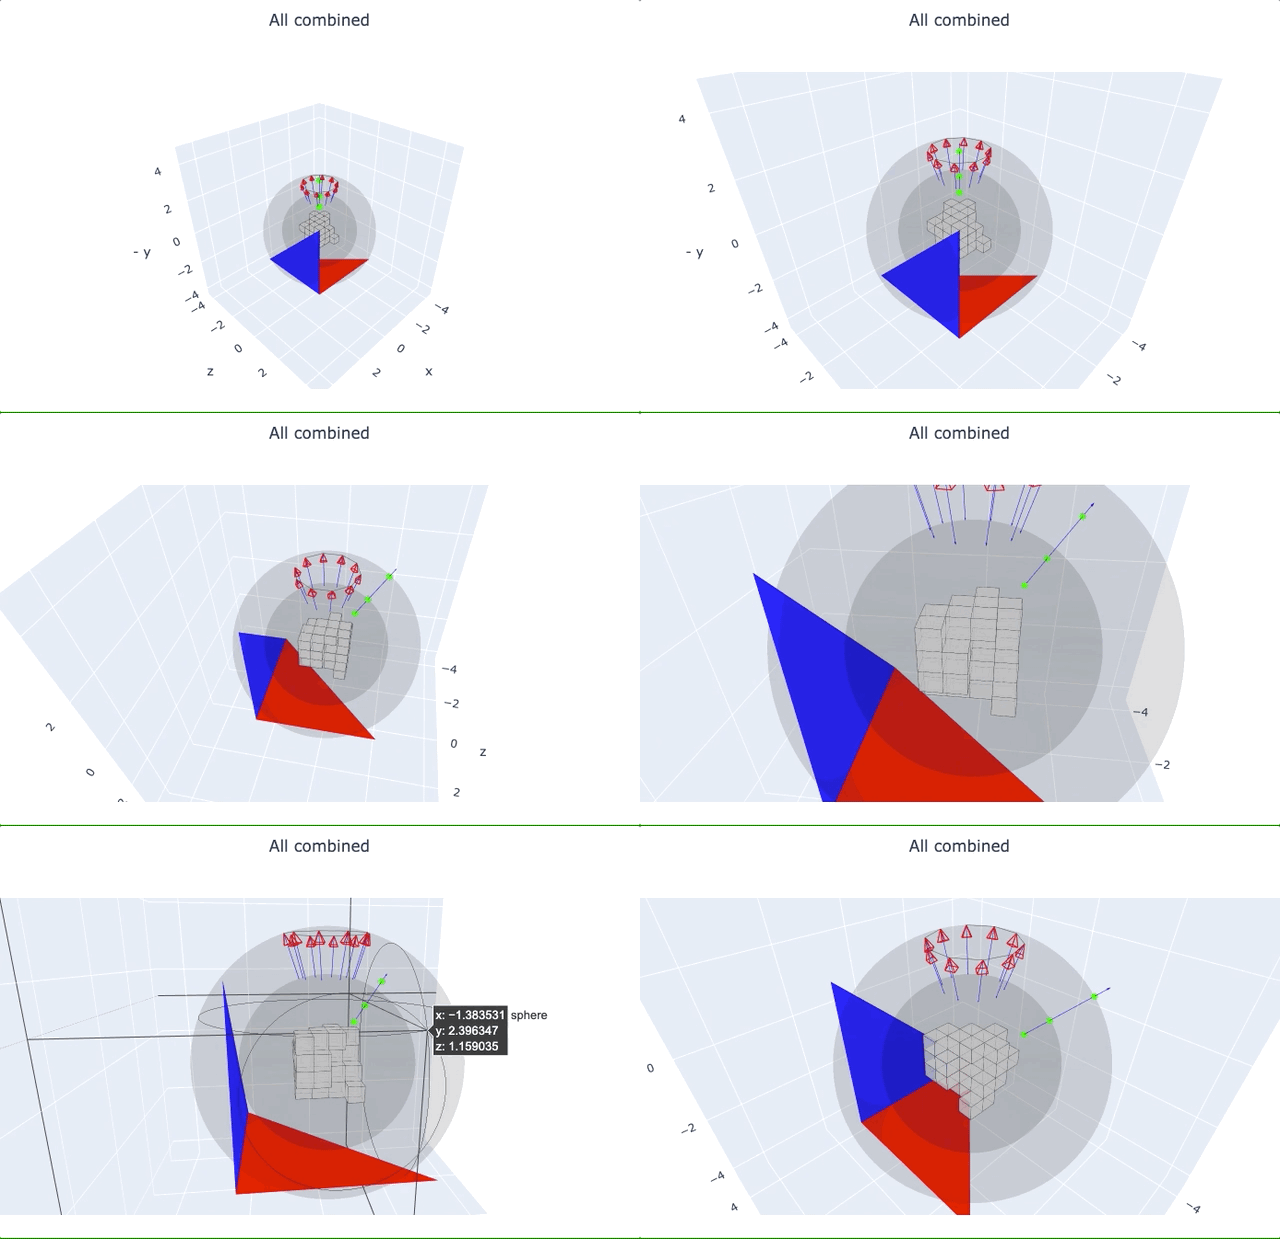
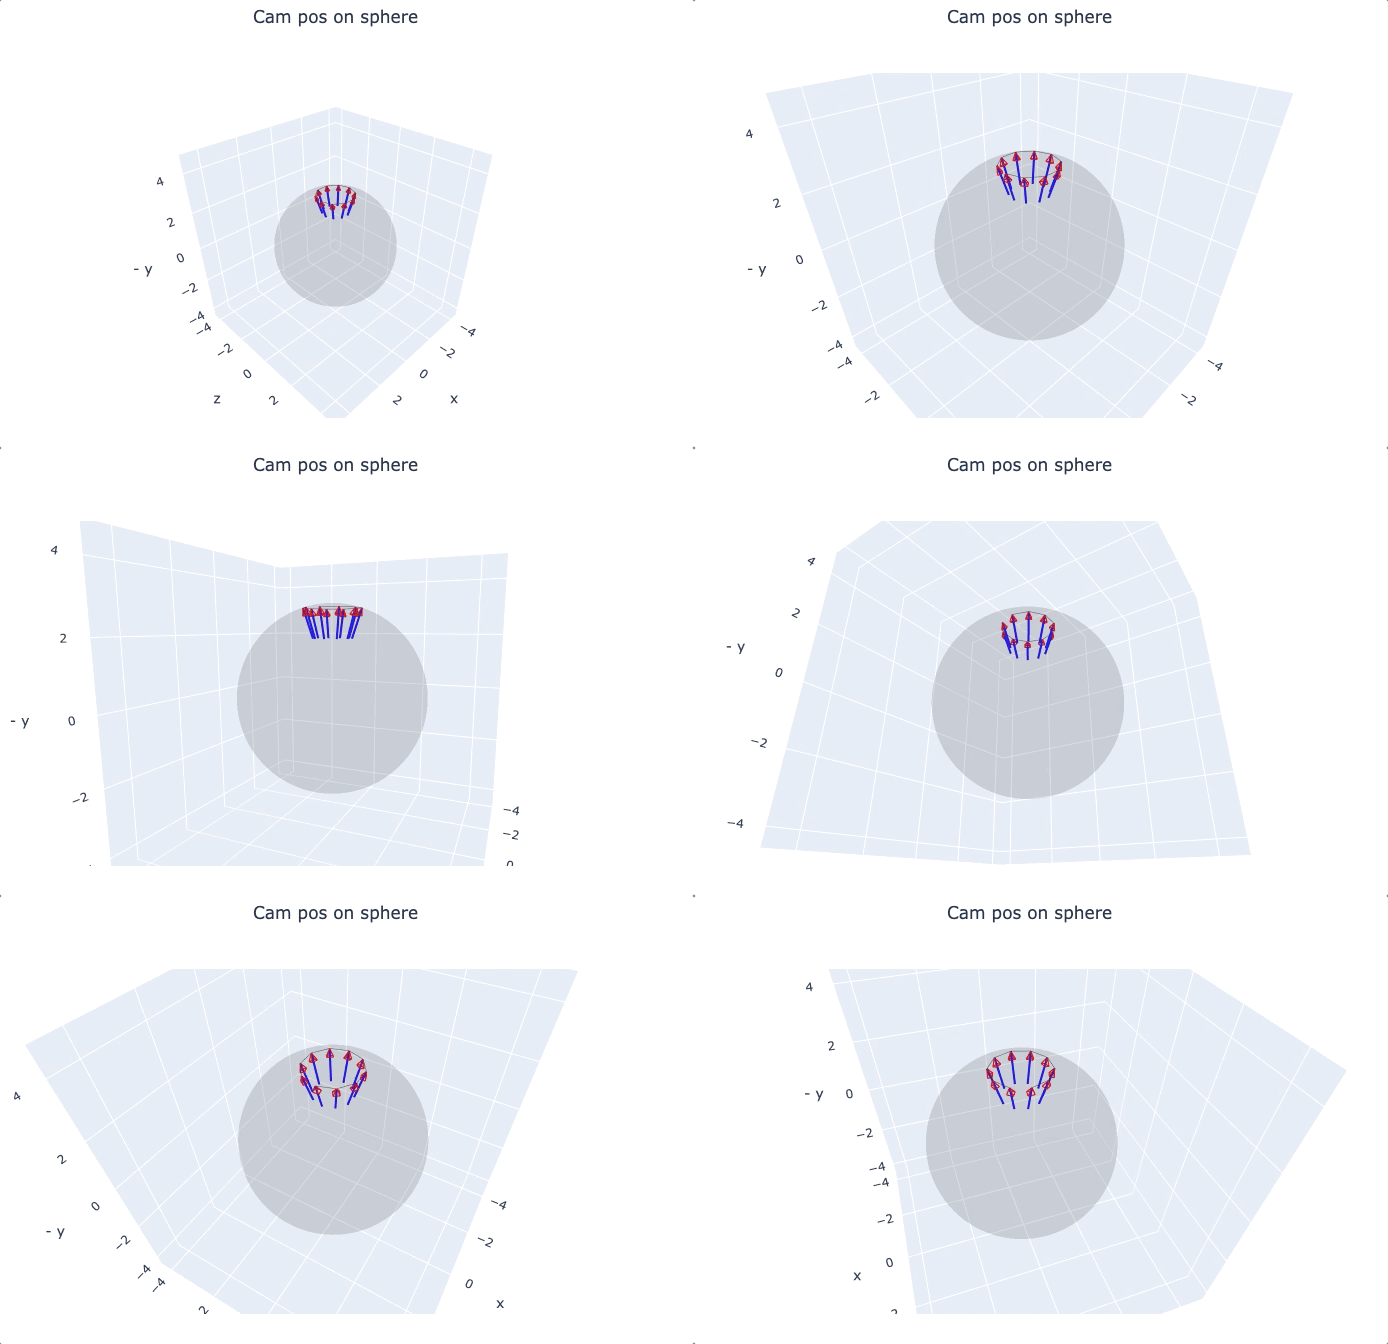
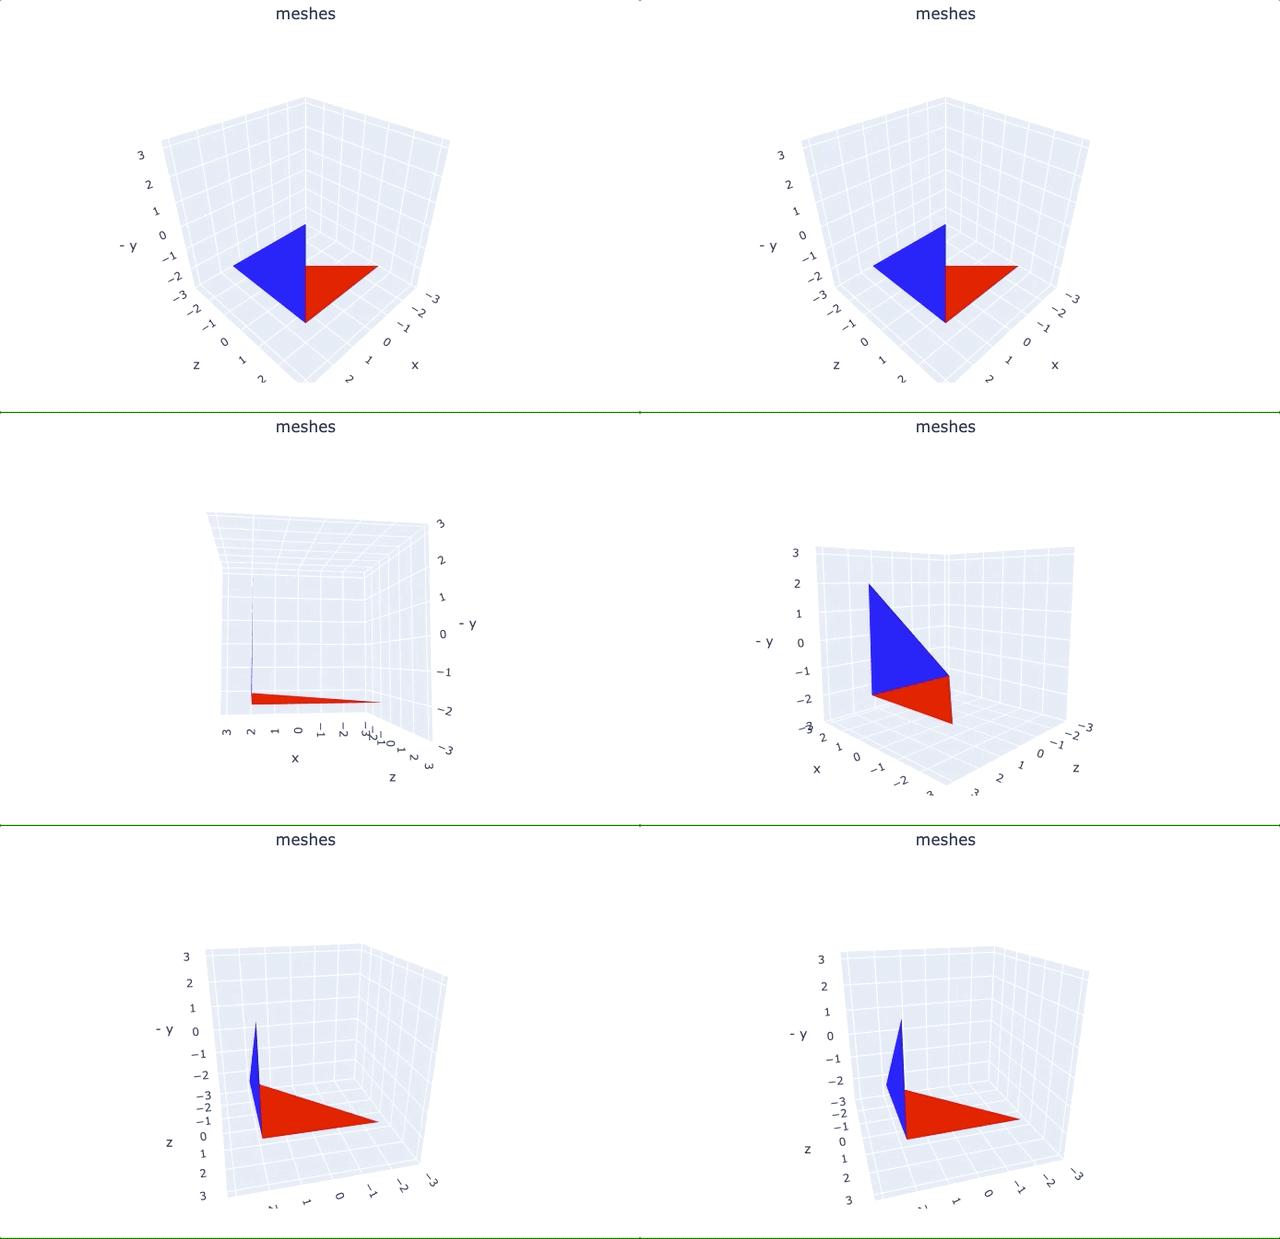
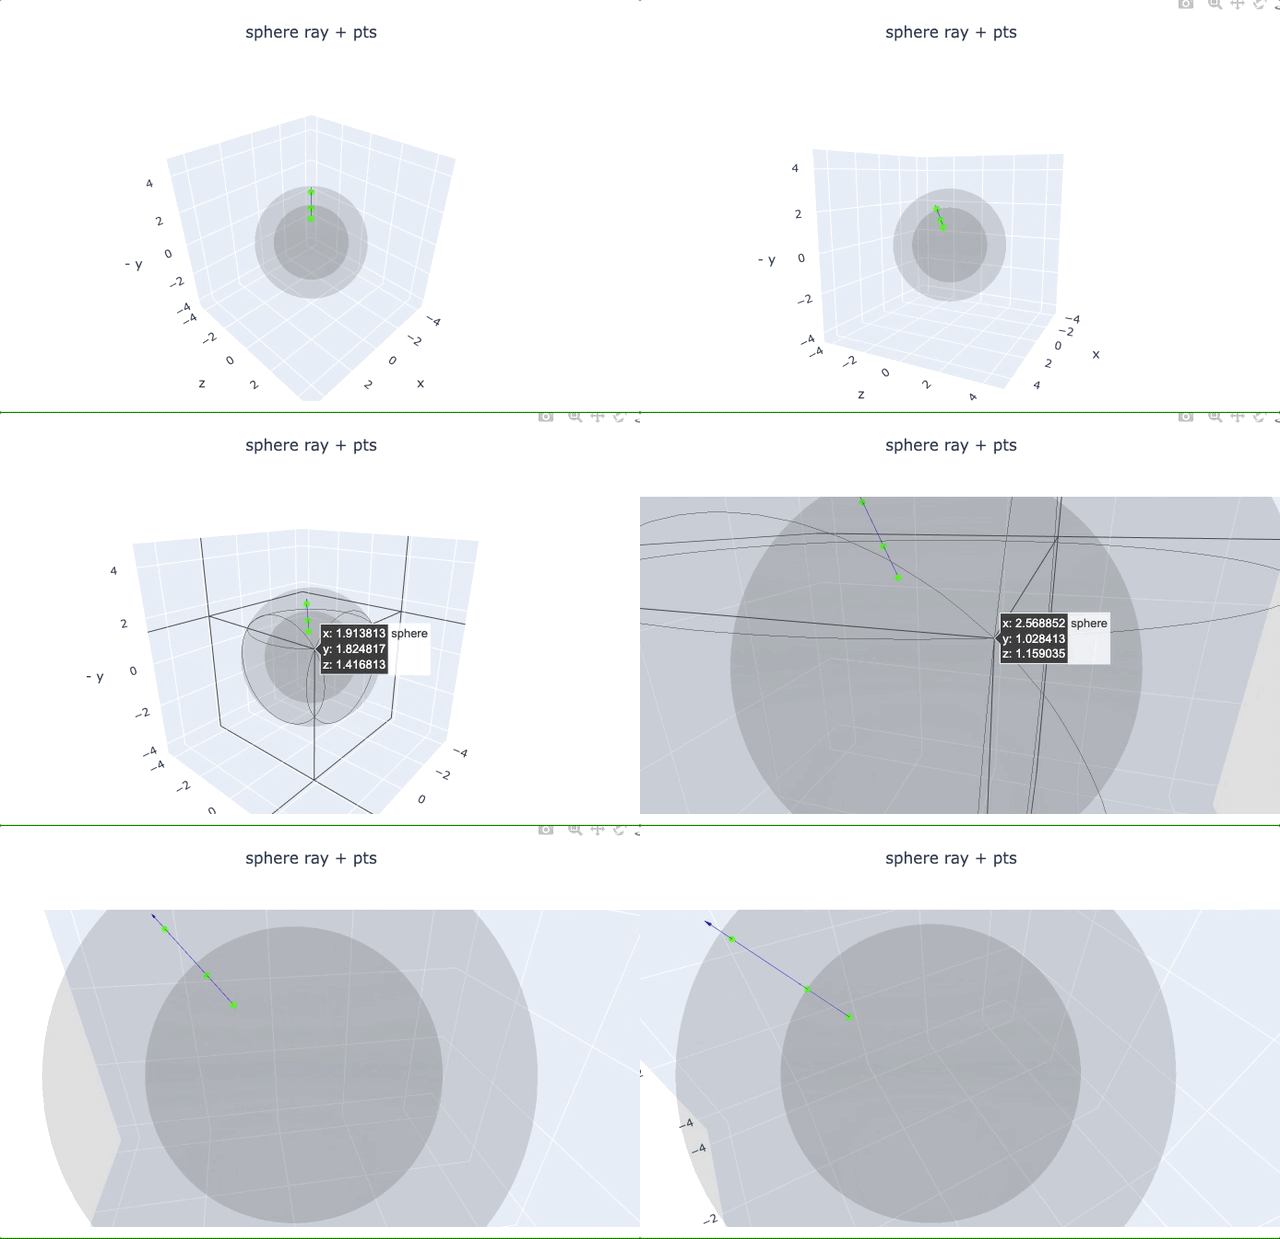
This is a visualization library for 3d/2d plot. It is helpful for developing geometric algorithms and check their correctness.
We use numpy array for 3d/2d data structure, and many of the geometric function are in torch.
We provide some basic geometric implementation and visual samples. For more example usage, please visit our repo ArcNerf. There will be more useful examples using this vis lib.
We provide a draw_3d_components that is helpful to plot camera/points/rays/lines/sphere/meshes/volume
with customized color in all.
For all point, it should be in world space, or transformed to world space. Then change to plt space. The visual space is (x-right, y-down, z-forward). But we show the y values as -y inorder to make y goes downward.
We provide matplotlib and plotly for visualization. By default it use plt.
Plotly is good for interactive visualization
and is able to zoom-in/out, move. We can add plotly=True in draw_3d_components.
- c2w pose: in
(N_cam, 4, 4). Local camera models will be created and transformed into world space - cam_colors: in
(N_cam, 3)or(3,)can be used to color each or all cams - intrinsic: in
(3, 3)is used to adjust local cam model for actual ray direction.
- point: in
(N_p, 3)in world space - point_size: is single value used to set each point size
- point_color: in
(N_p, 3)or(3,)can be used to color each or all points
- lines: a list of lines in
(N_pts_in_line, 3)in world space, totalN_line, each line printsN_pt_in_line-1line seg - line_width: is single value or list of value used to set each line width.
- line_colors: in
(N_line, 3)or(3,)can be used to color each or all lines
- meshes: a list of mesh of
(N_tri, 3, 3)in world space, len isN_m - mesh_colors: color in
(N_m, 3)or (3,), applied for each or all mesh - face_colors: color in
(N_tri, 3), len isN_m, for each mesh if set.
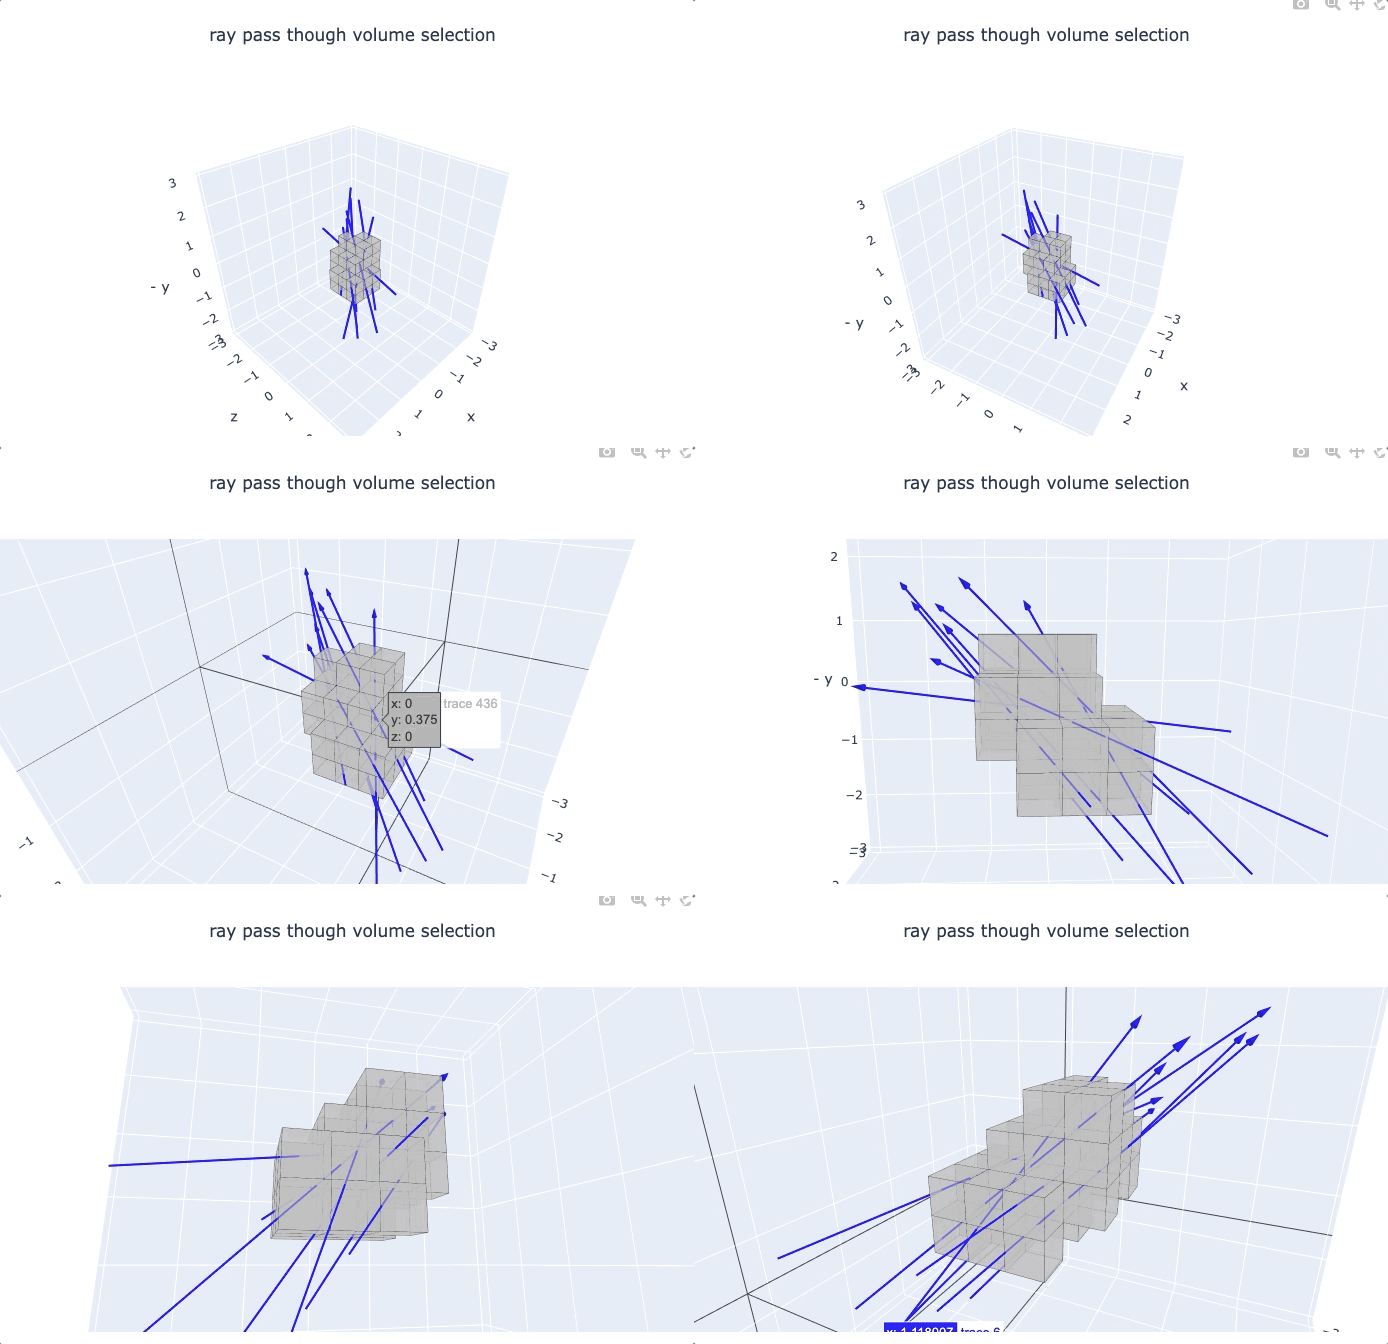
- rays: a tuple
(rays_o, rays_d), each in(N_r, 3), in world coord.rays_dis with actual len, if you want longer arrow, you need to extendrays_d - ray_colors: color in
(N_r, 3)or(3,), applied for each or all rays - ray_linewidth: width of ray line, by default is 1
- sphere_radius: draw a sphere with such
radiusif not None - sphere_origin: the origin of sphere, by default is
(0, 0, 0)
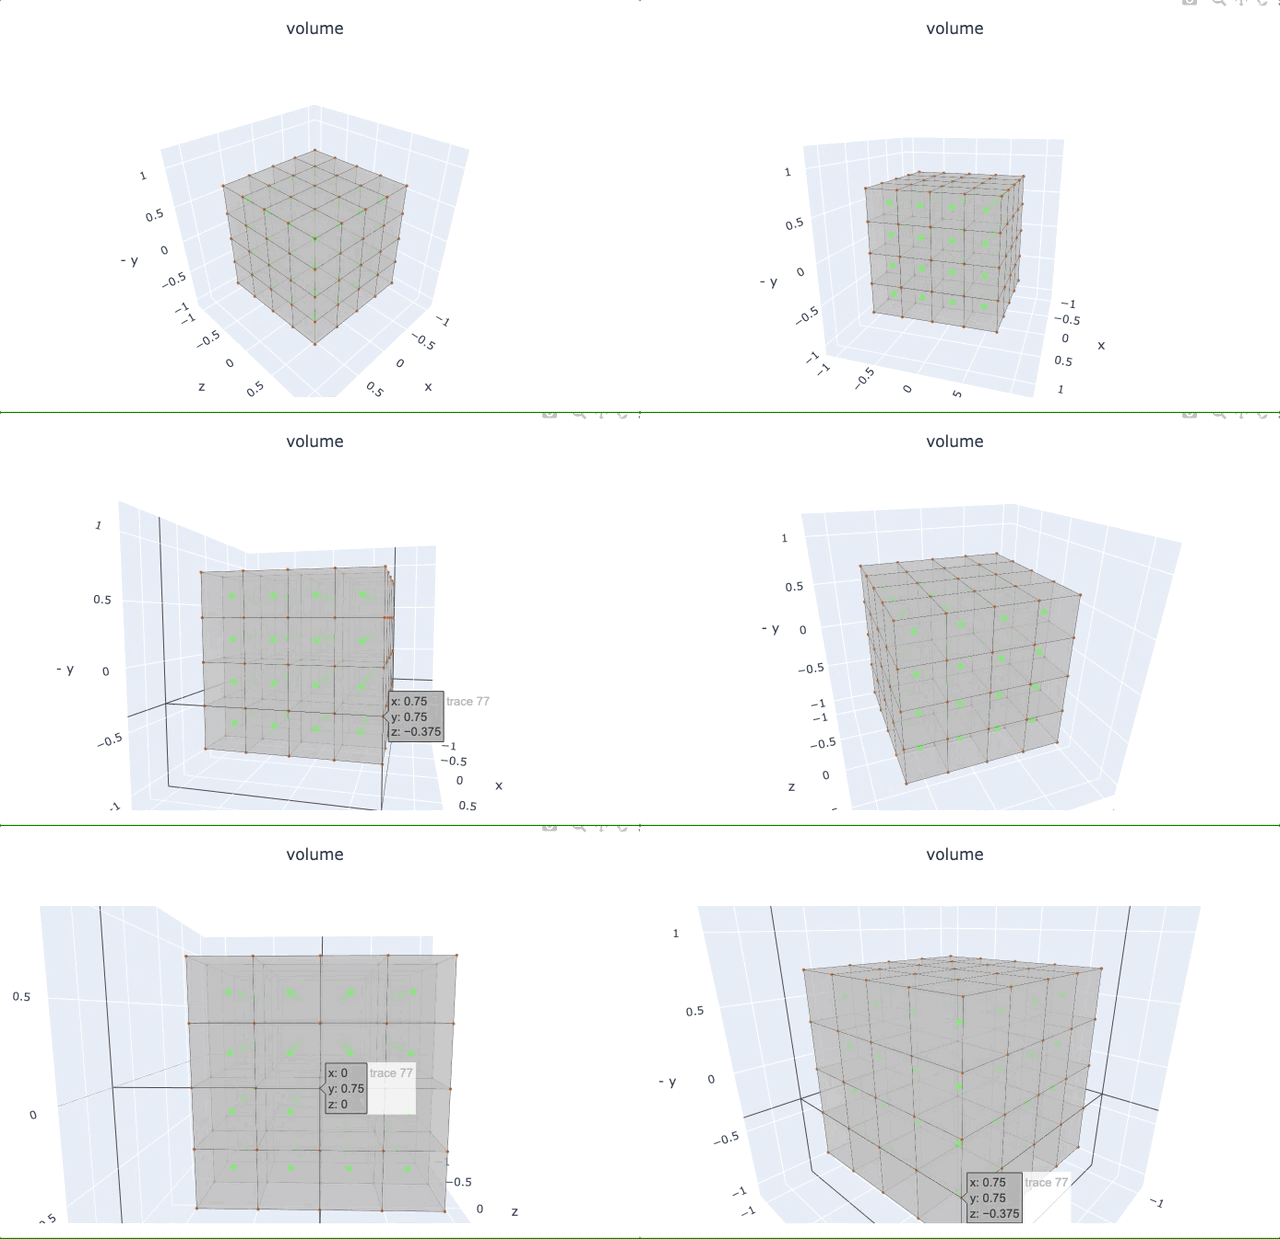
A complete volume implementation is in geometry.volume. You only input points/lines/faces for visual results.
- 'grid_pts': grid point, ((n+1)^3, 3). If use corner only, (8,3)
- grid_pts_colors: pts_colors in str. If not exist, use
chocolate. - 'grid_pts_size': pts_size. If not exist, set 20.
- grid_pts_colors: pts_colors in str. If not exist, use
- 'volume_pts': volume point, (n^3, 3)
- 'volume_pts_colors: pts_colors in str. If not exist, use
green. - 'volume_pts_size': pts_size. If not exist, set 20.
- 'volume_pts_colors: pts_colors in str. If not exist, use
- 'lines': lines of bounding lines or dense lines. list of lines in (2, 3)
- 'faces': faces of bounding faces or dense faces, np in ((n+1)n^2, 4, 3).
regroup each face to 2 triangles for visual
- face_colors: face_colors in str. If not exist, use
silver.
- face_colors: face_colors in str. If not exist, use
- title: title of the fig
- save_path: if
None, will show the fig, otherwise save it - axis range: update by the component with max values (xyz), show in a cube with same lengths.
- return_fig: If set to True and save_path is None, will return the fig(plt) or numpy array(plotly) for further usage.
- show_axis: If False, do not show axis but only the fig. By default True.
In plot_2d.py, we provide a draw_2d_components that is
helpful to plot points/lines in defined colors with legends. We use matplotlib as backend.
- We provide the python notebook in
draw_3d_examples.ipynbto use the 3d render anddraw_2d_examples.ipynbto use the 2d drawer.
