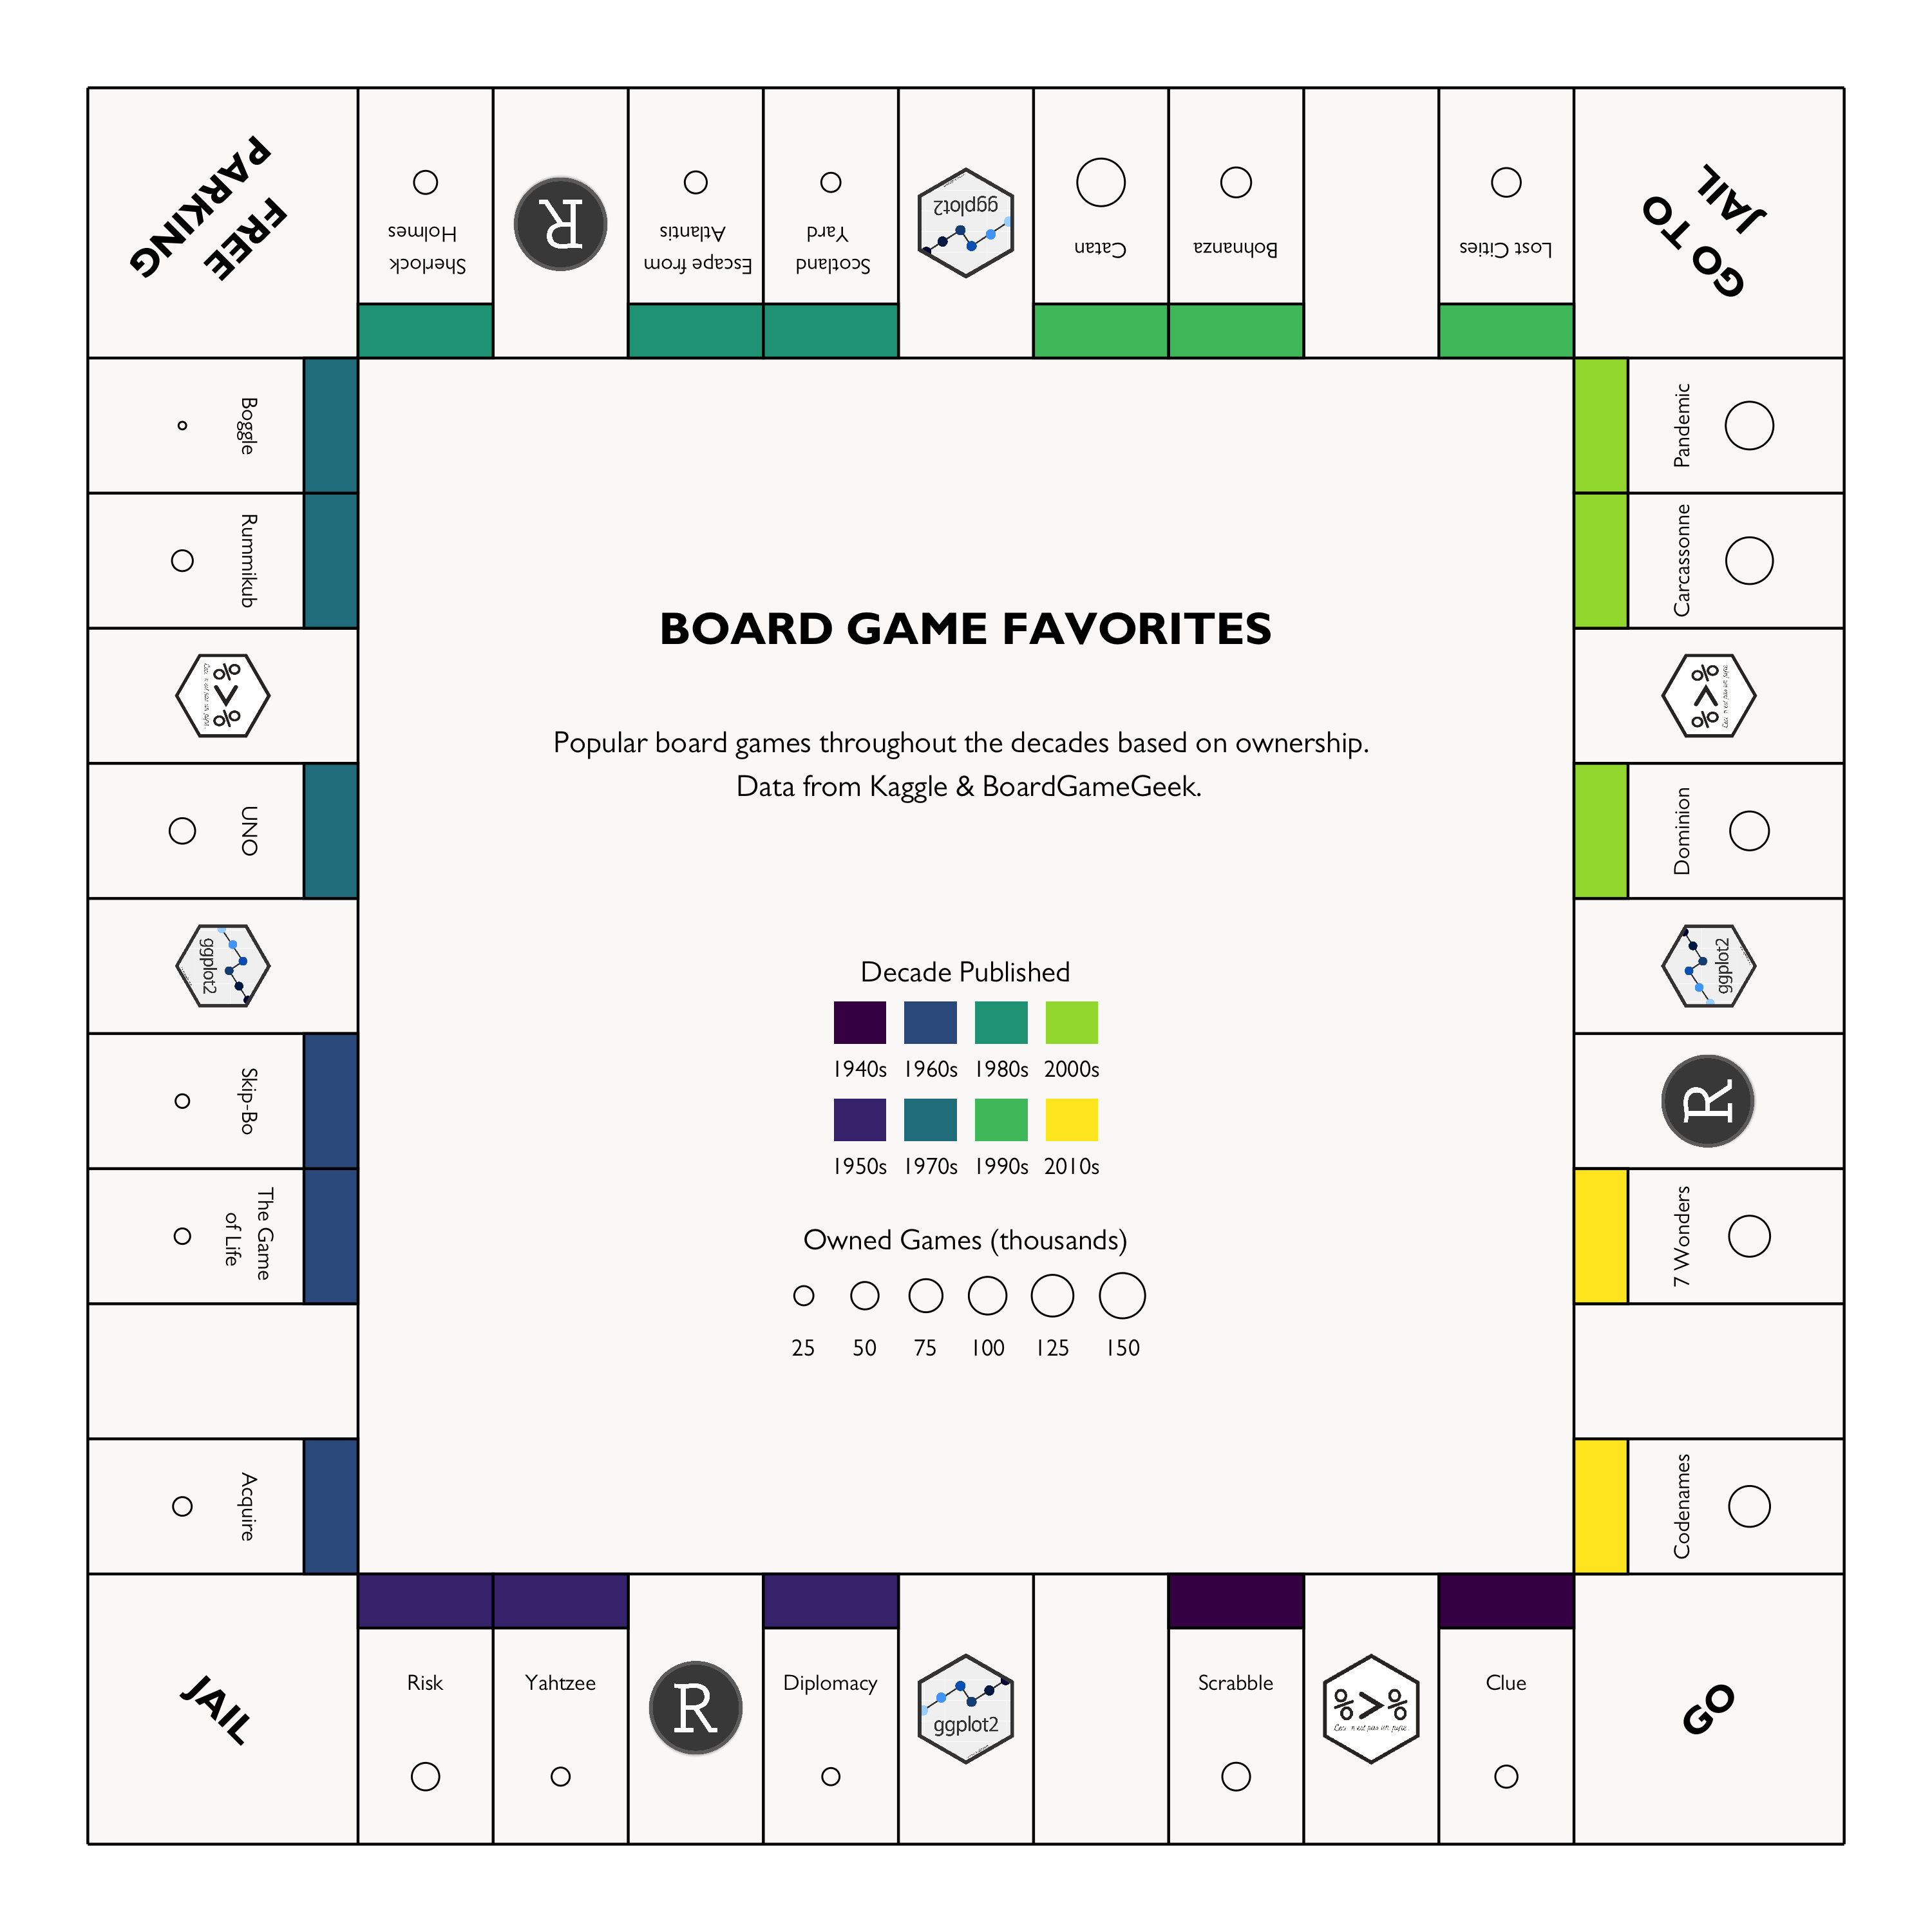
Popular board games throughout the ages based on ownership. Data from BoardGameGeek.

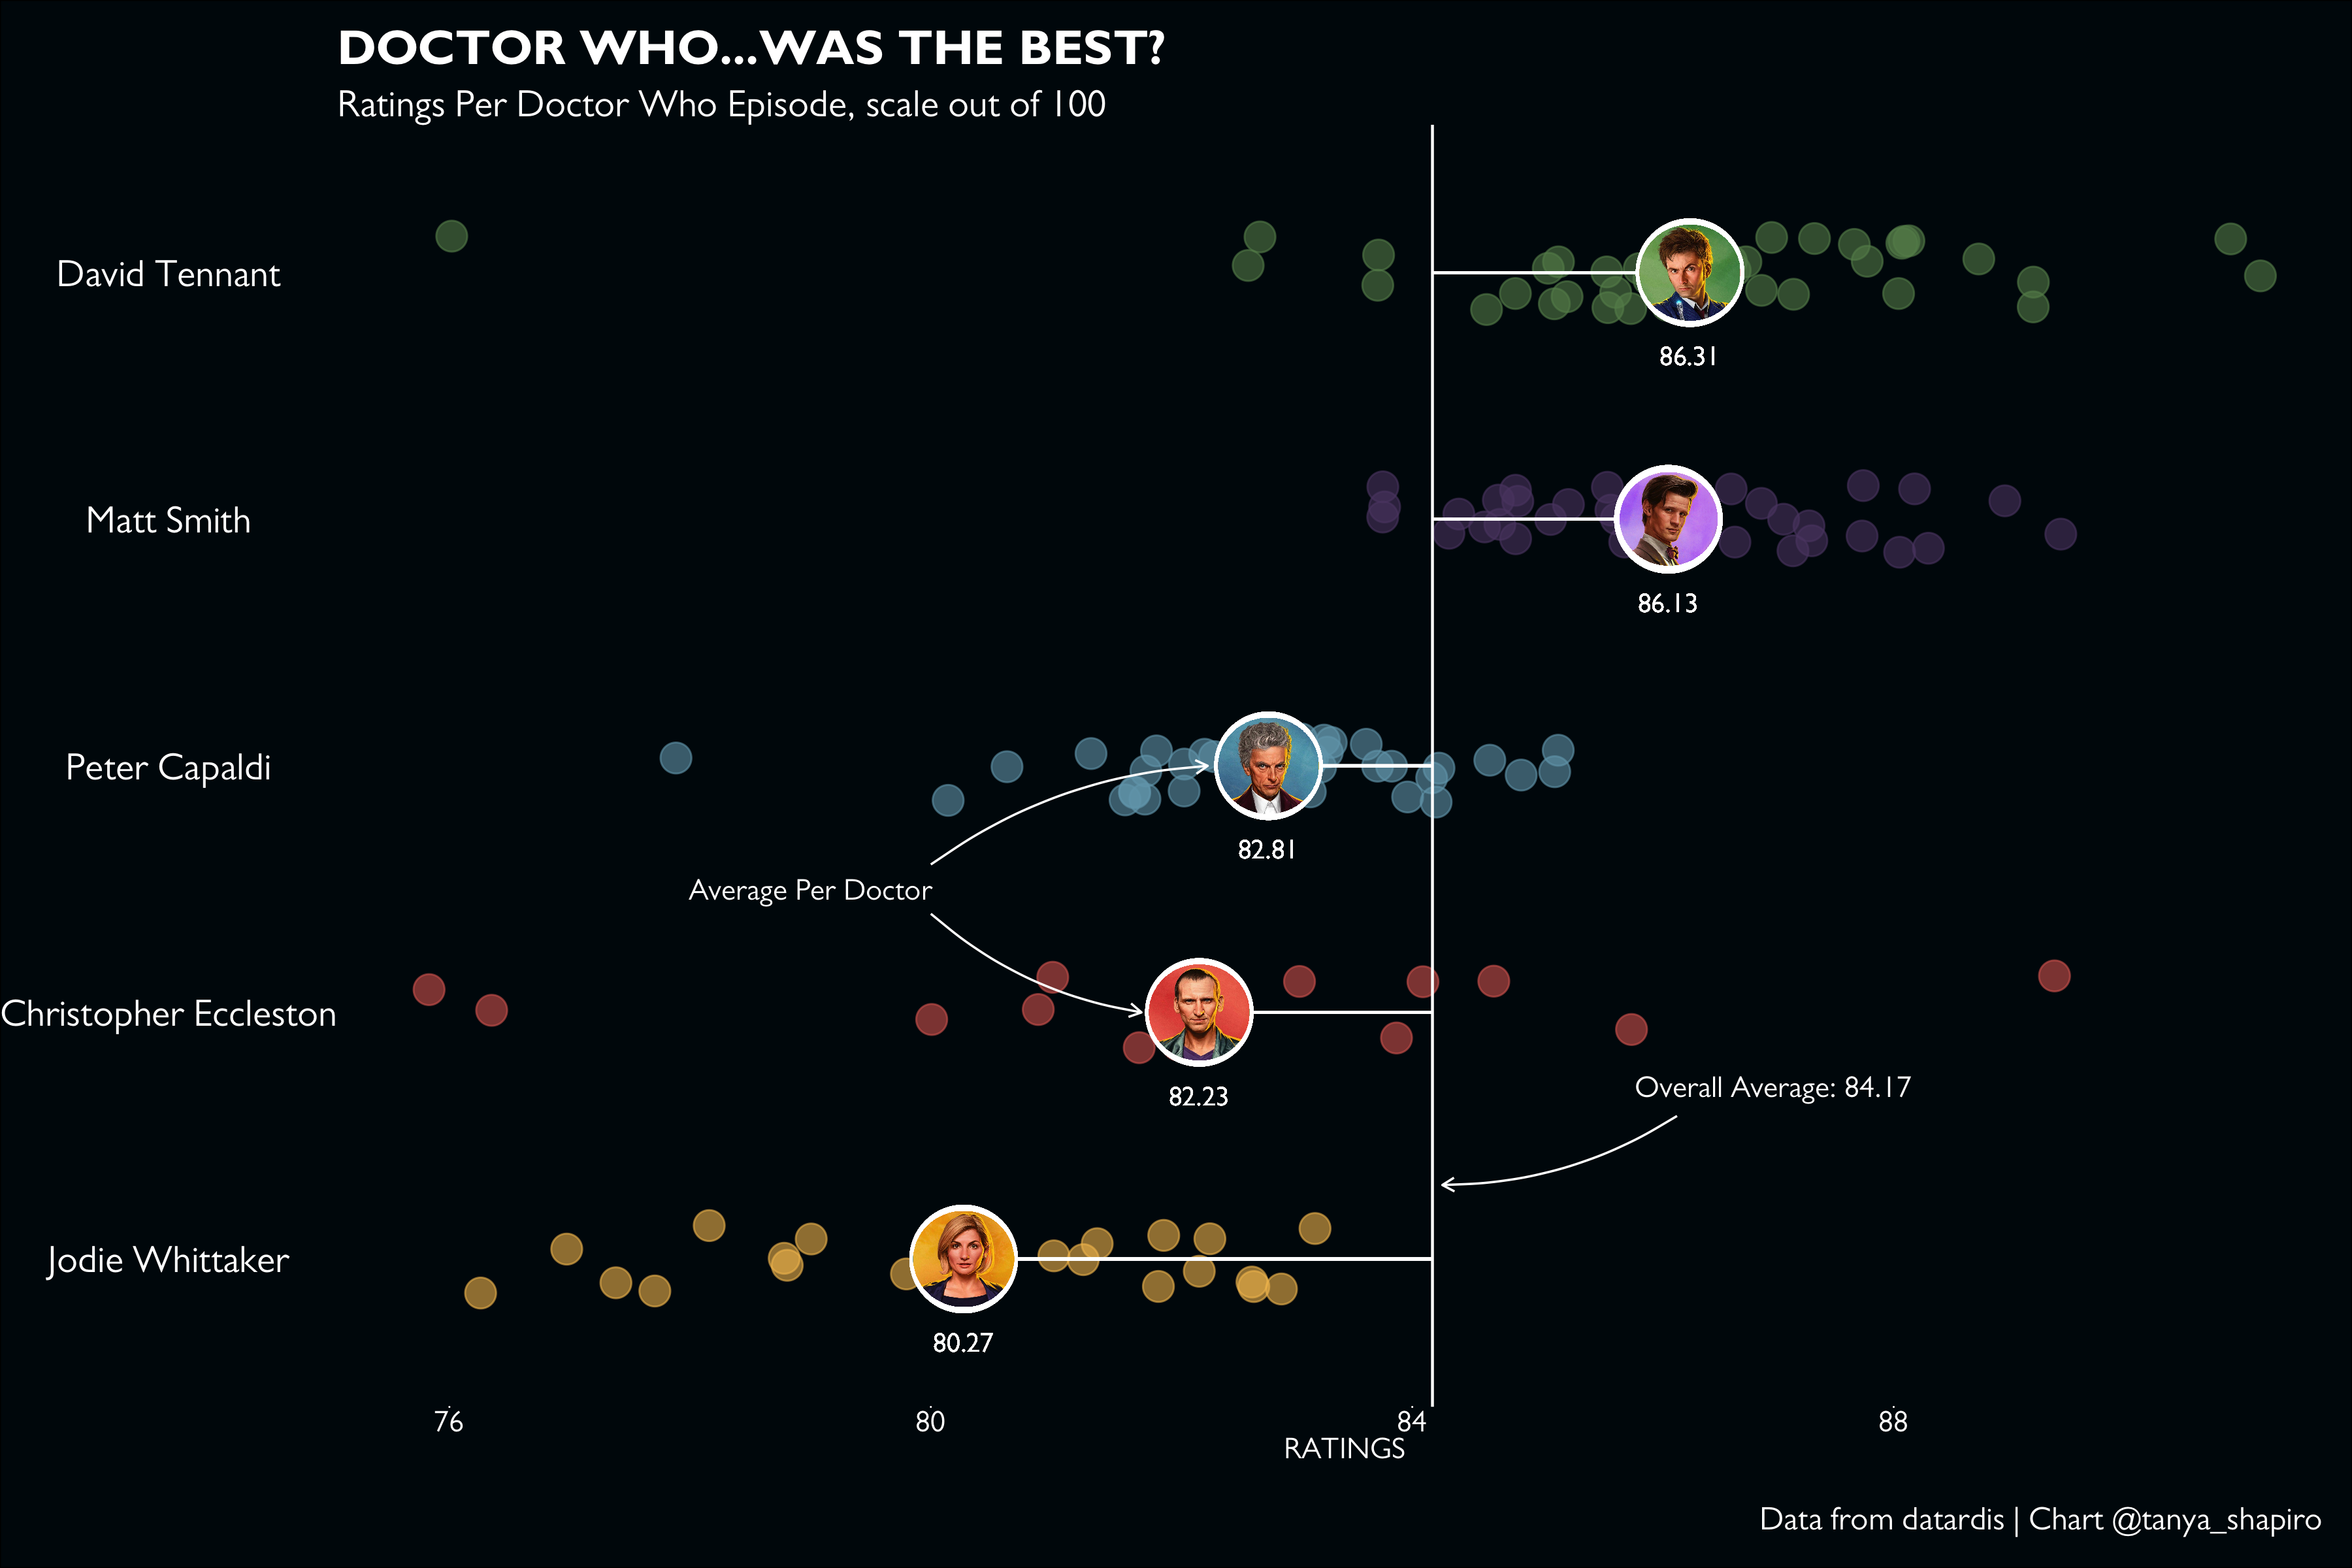
Exploring average ratings per episode by Doctor from various Doctor Who seasons. Data visualization inspired by Cédirc Scherer.

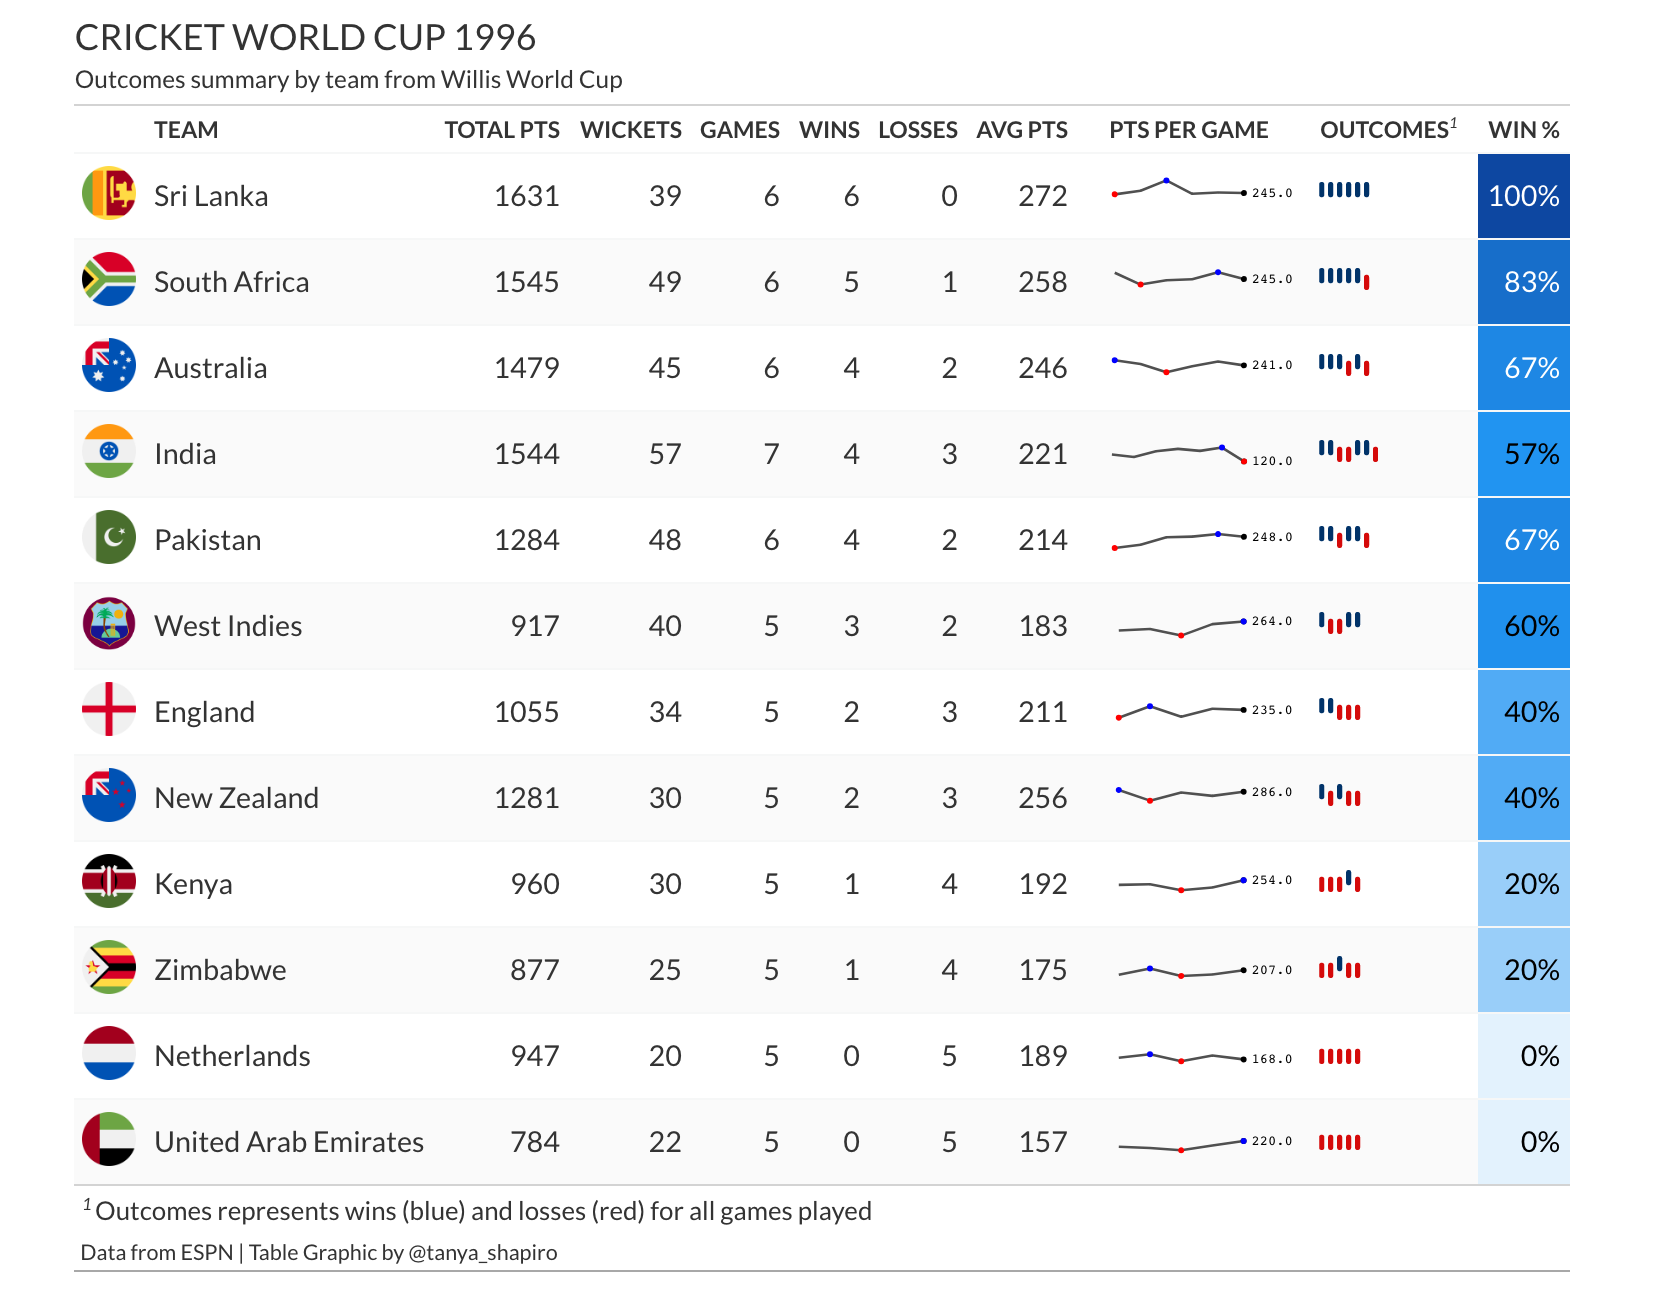
Table graphic summarizing outcomes and scores from World Cricket 1996 (data from ESPN).

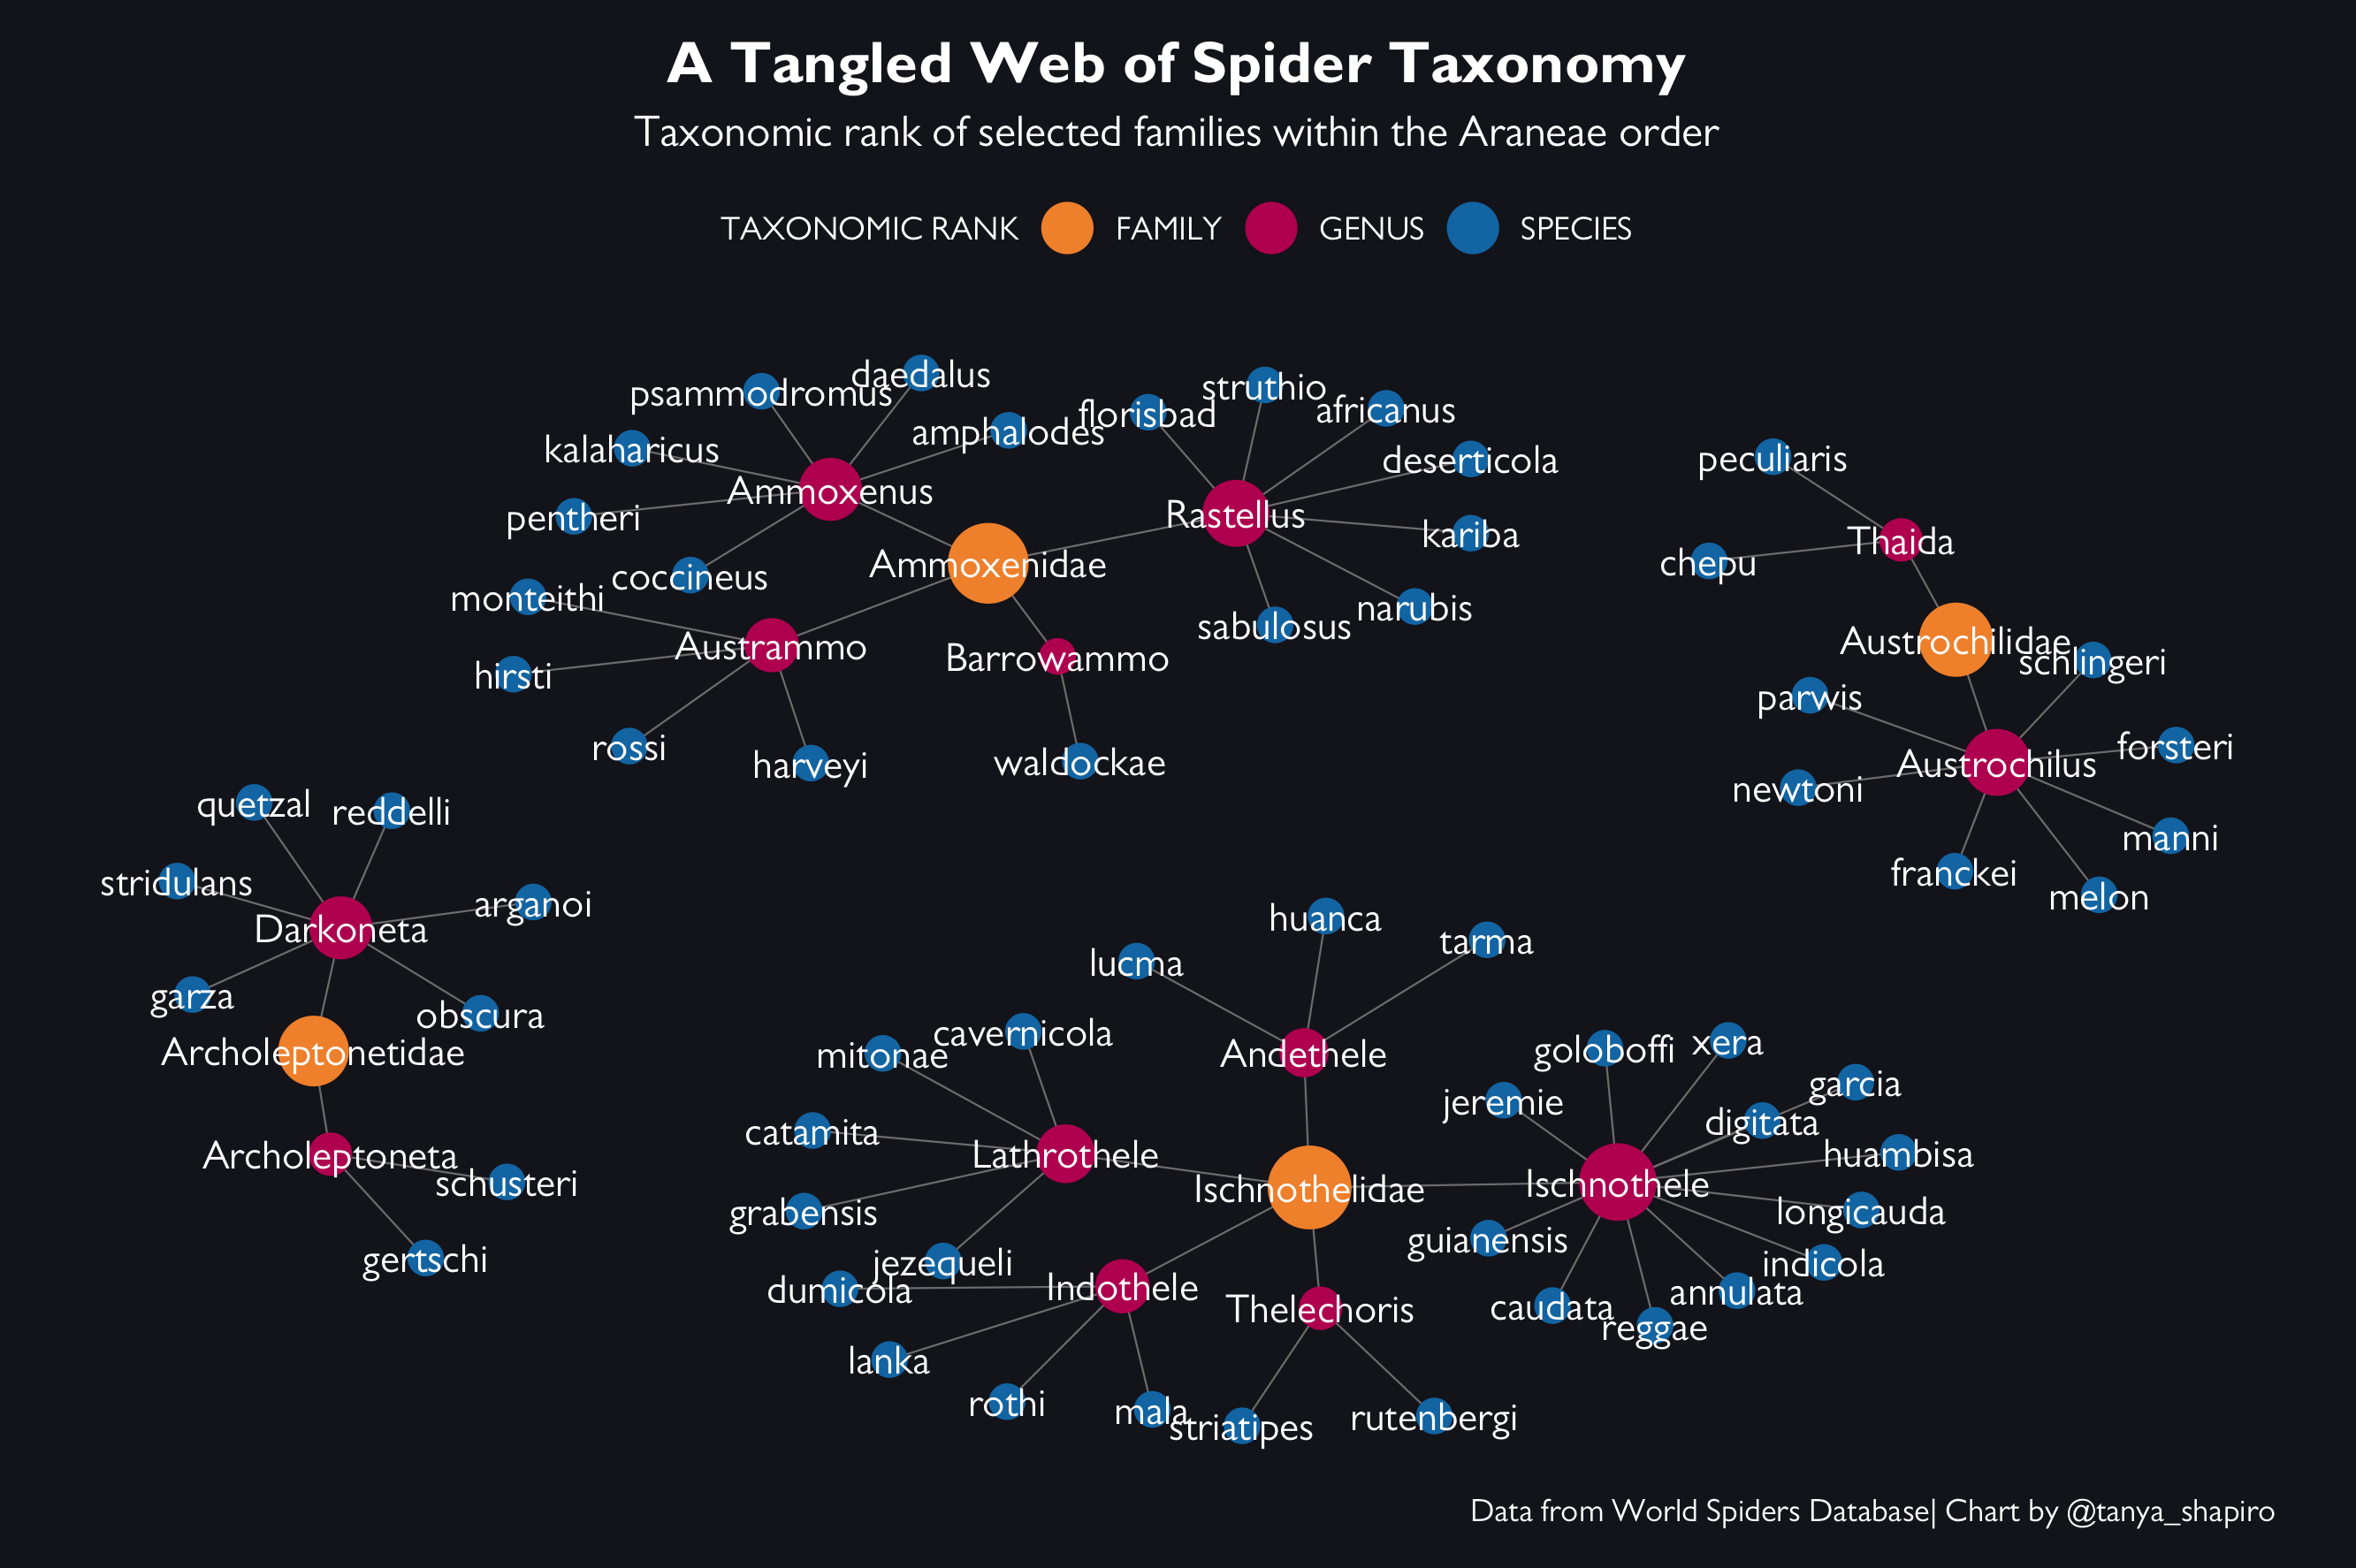
Network visualization representing the taxonomc classification of a few different spider families. Data from World Spiders Database.
