This uses NetData, and specifically it uses the most recent git version.
Here's the official wiki page on creating custom dashboards.
I'm on Arch Linux, so this is easy to install
┬─[william@fillory:~]
╰─>$ pacaur -S netdata-git
┬─[william@fillory:~]
╰─>$ sudo systemctl enable netdata.service
┬─[william@fillory:~]
╰─>$ sudo systemctl start netdata.service
You can install my version by cloning this repository, and assuming you have
installed via Arch Linux (or at least put the right things in the right spot)
running the install.sh script.
┬─[william@fillory:~]─[11:46:38 PM]
╰─>$ ./install.sh
Under the hood, this is just copying things in the right spot and restarting NetData. (I know it's not the best install script, but ehh, whatever.)
sudo cp ./custom.html /usr/share/netdata/web/custom.html
sudo chown netdata /usr/share/netdata/web/custom.html
sudo chgrp netdata /usr/share/netdata/web/custom.html
sudo cp ./netdata.conf /etc/netdata/netdata.conf
sudo cp ./apps_groups.conf /etc/netdata/apps_groups.conf
sudo systemctl restart netdata.service
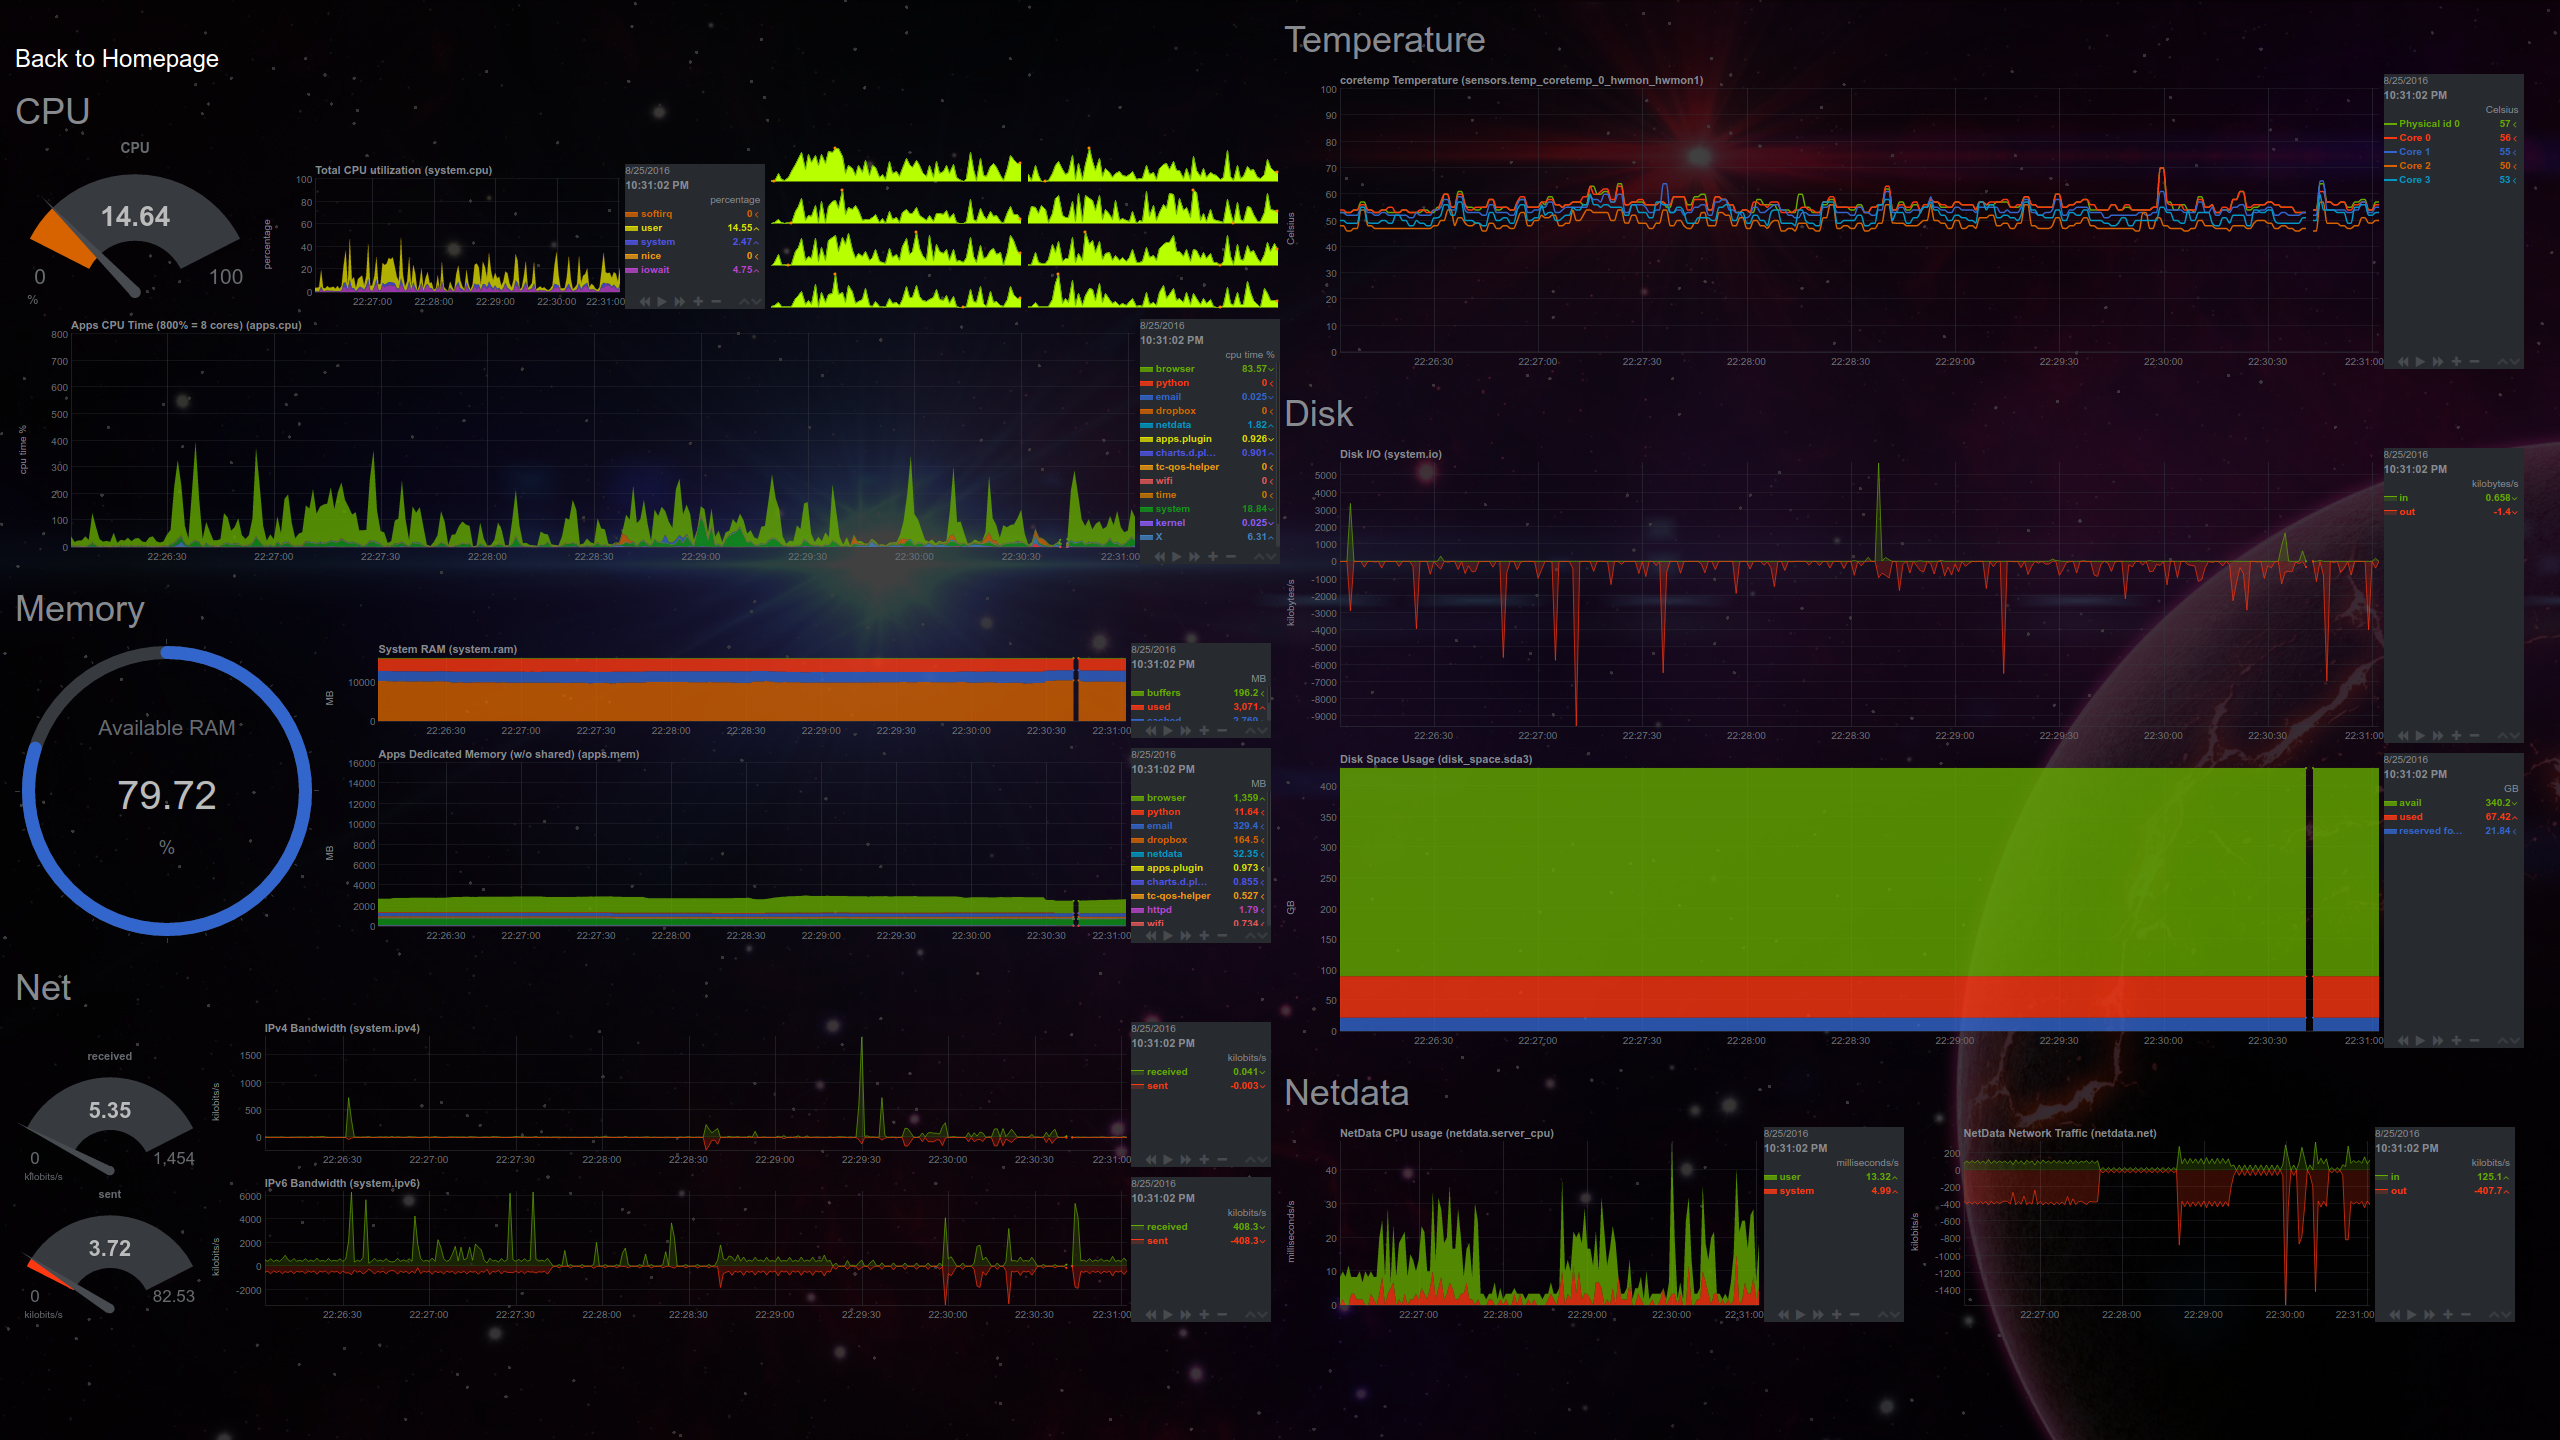
Here's what my version looks like for personal use.
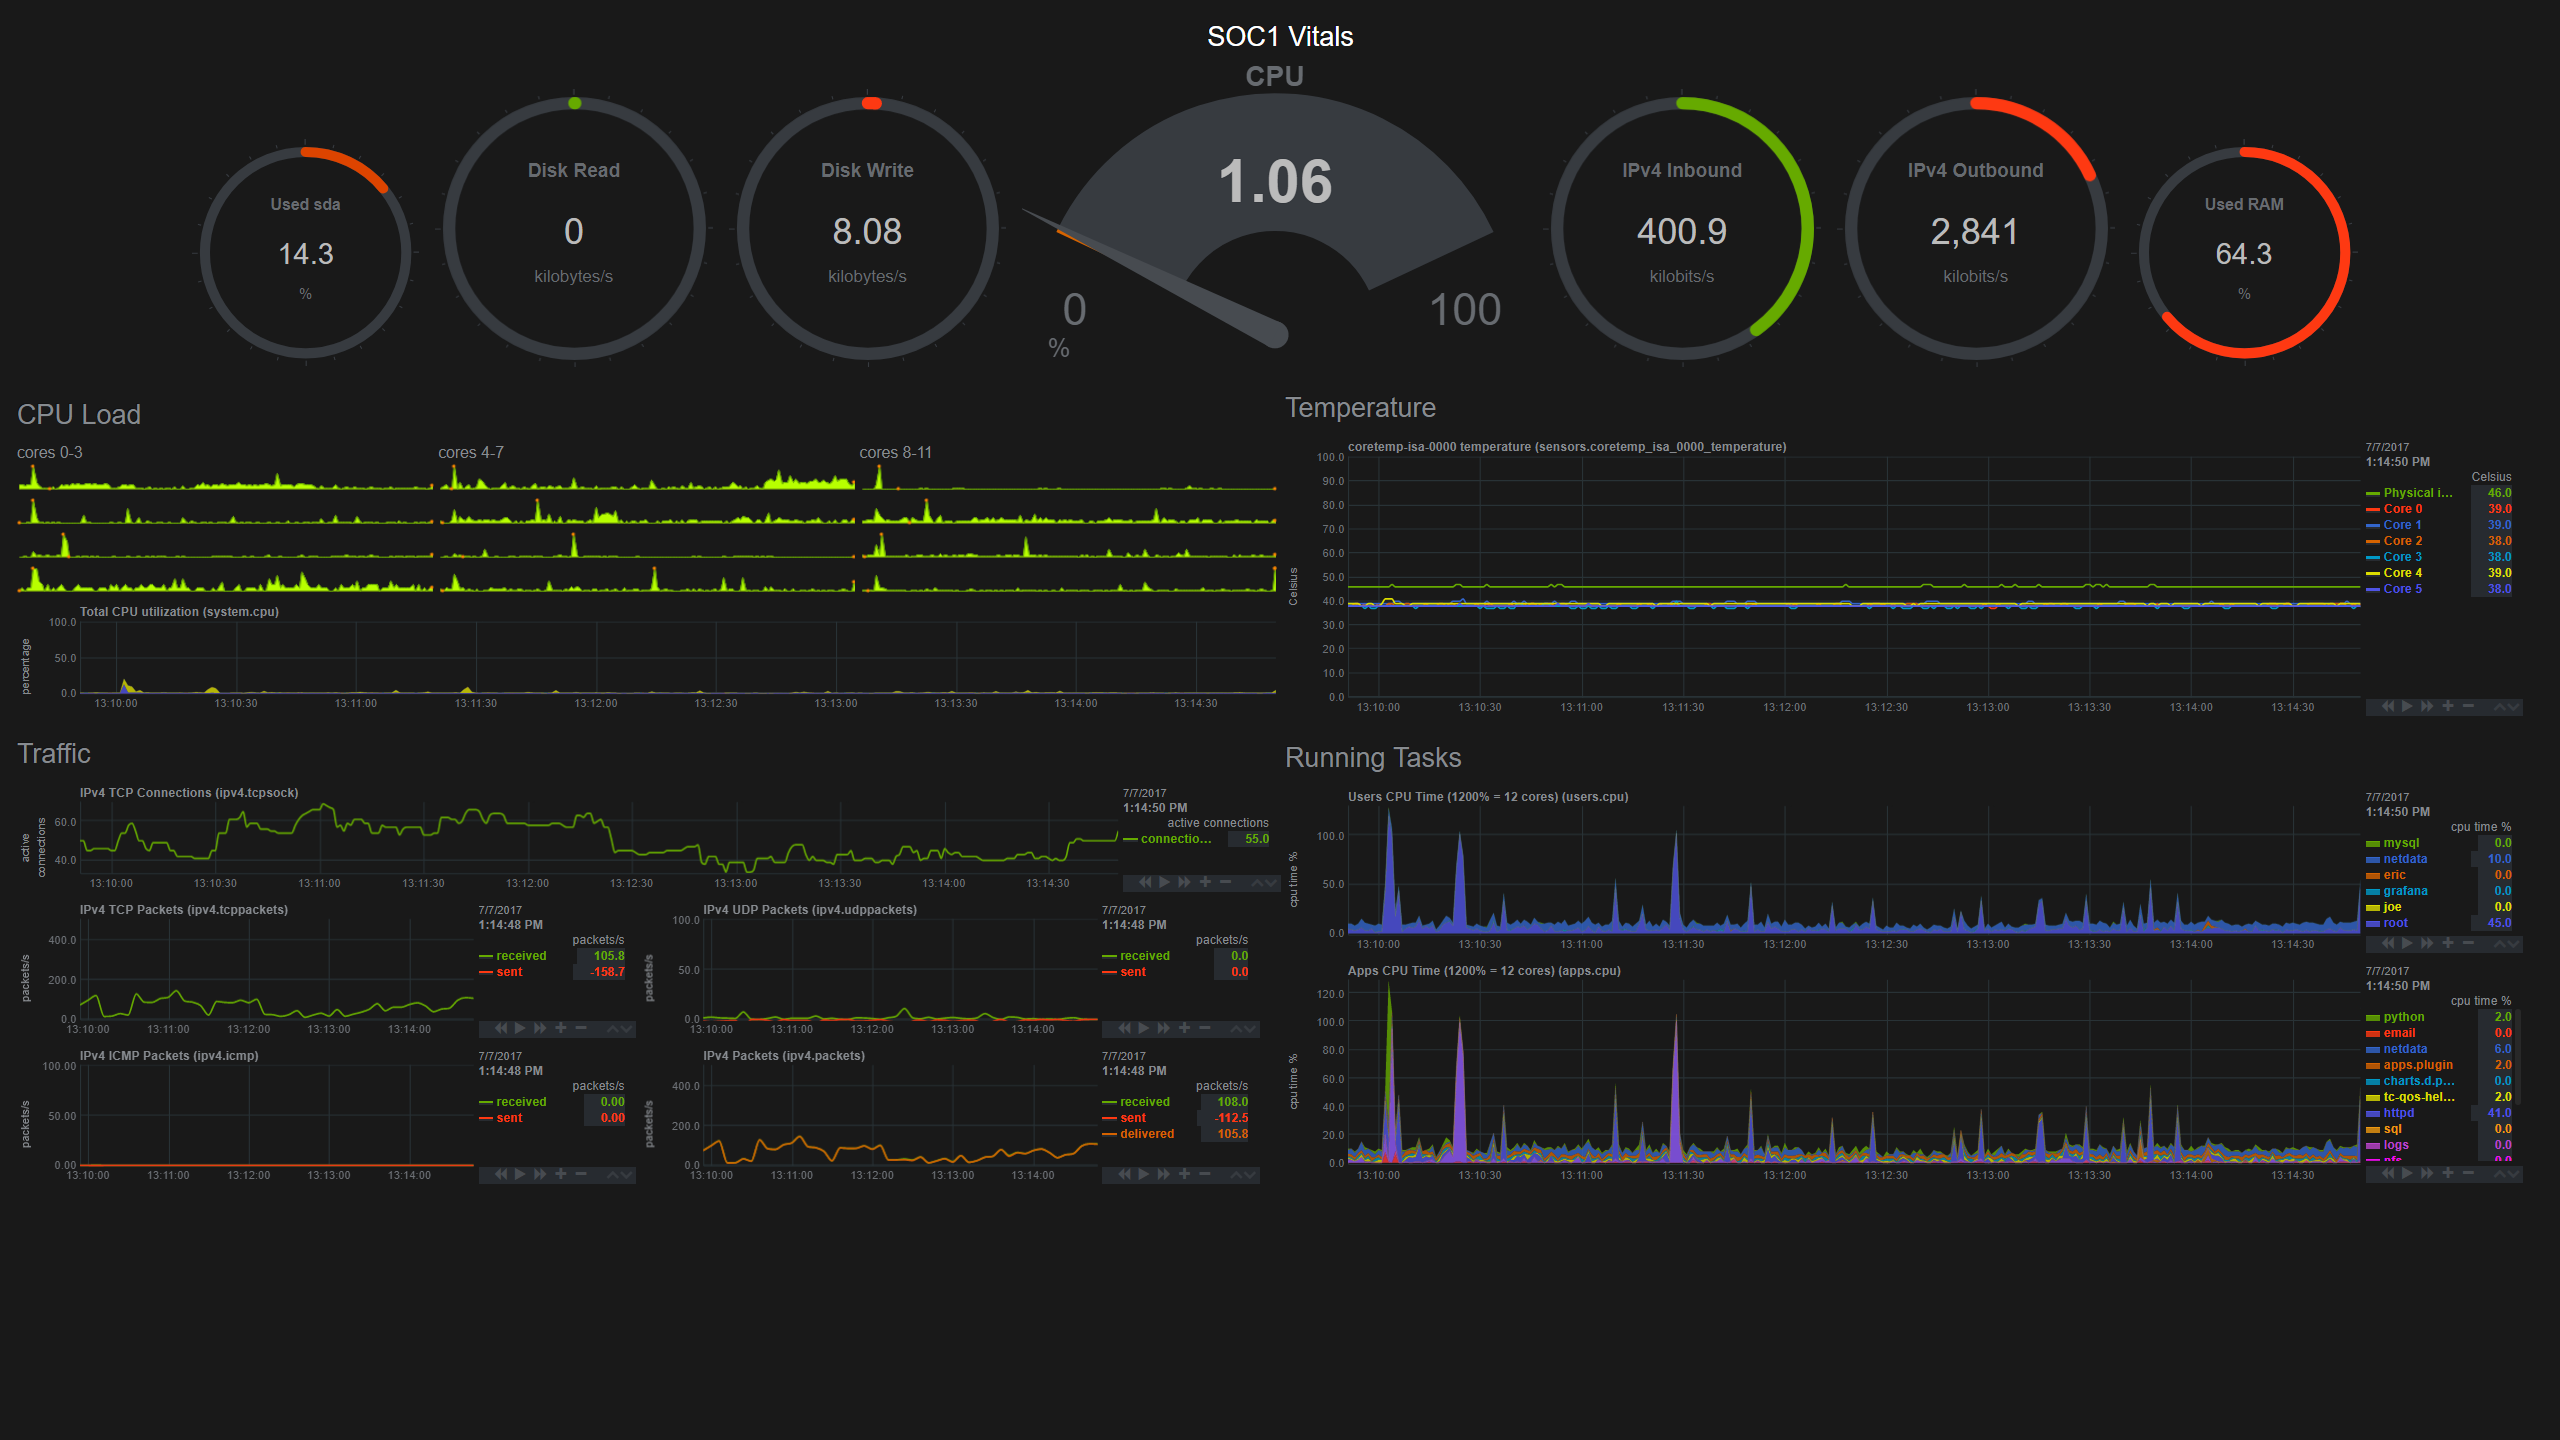
This is another dashboard that works well on server instances.
- Added new applications to be logged.
browser: firefox* *chrome*
python: python*
email: thunderbird
dropbox: dropbox*
- Setup new dashboard layout.
netdata.confis currently default, but this may change in the future.
- Main CPU graph - remove labels (they're useless)
- GPU
- Battery
- Active when not focused
- Health Checks
- Disk Writes
- Temp
- Battery

