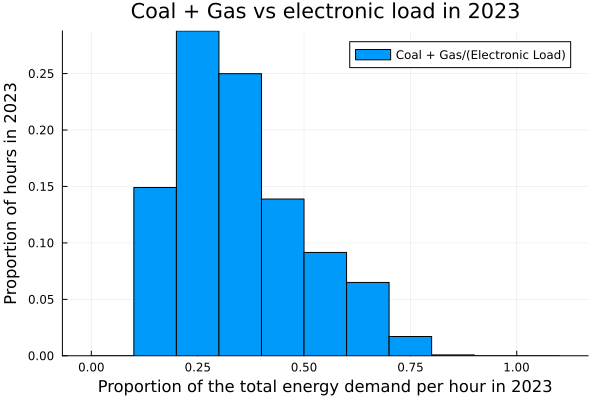
The source of the data is
https://www.energy-charts.info/charts/power/data/de/month_2023_07.json
which is used for the website by the frauenhofer institute
https://www.energy-charts.info/
or more precisely
https://www.energy-charts.info/charts/power/chart.htm?l=de&c=DE&source=public&year=2023&interval=year&stacking=stacked_percent_area×lider=0
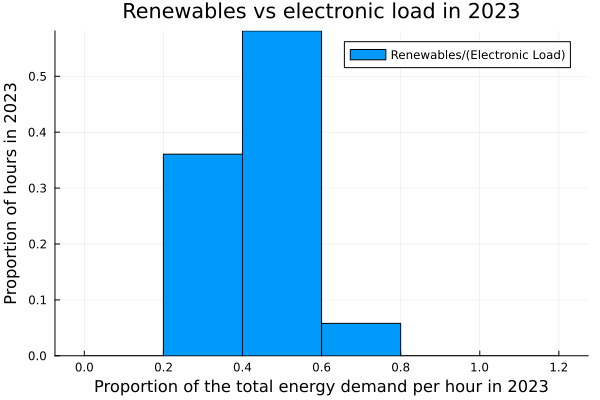
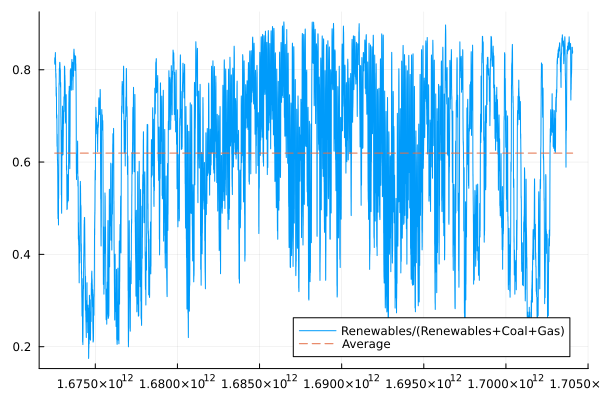
A histogram depicting the fraction of the power of renewable energies (Wind offshore, Wind onshore, Solar, Biomass, Hydro Run-of-River, Geothermal, Hydro water reservoir, Hydro pumped storage) (in MW) on the Eletronic load in Germany in 2023
same histogram only includeing wind and solar
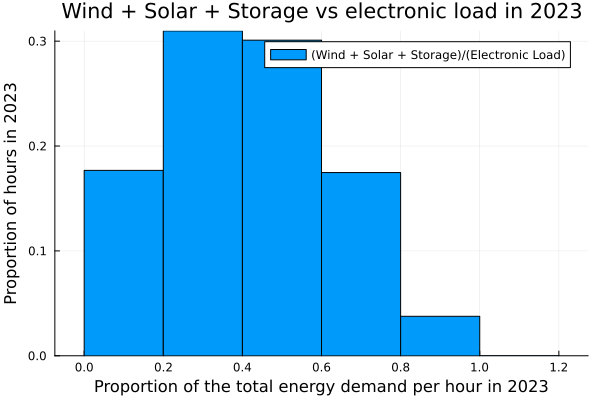
histogram combining wind, solar and storage (the power of Hydro pumped storage consumption is actually negative as it should be)
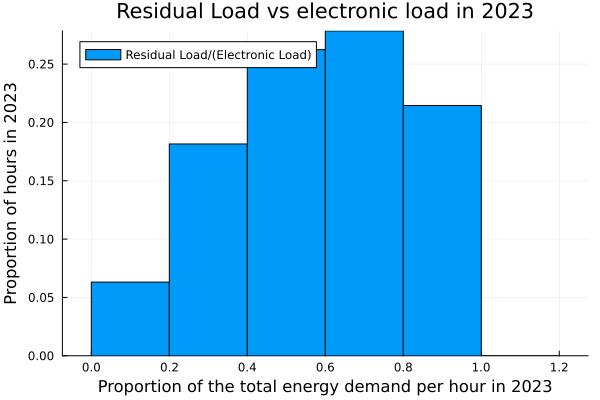
reiduallast ist die last, die durch nicht fluktuierende erzeuger gedeckt werden muss
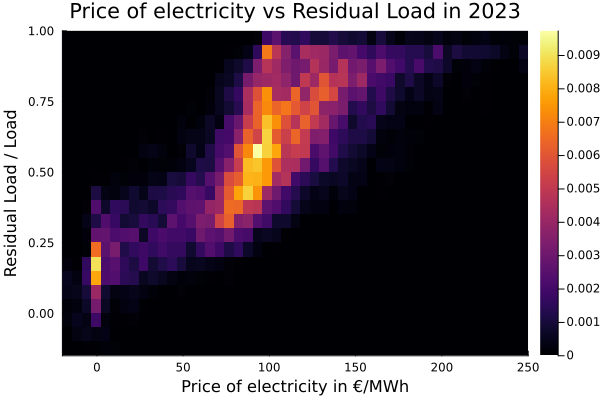
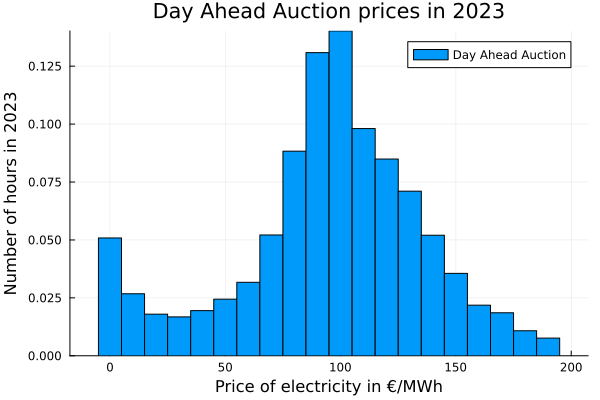
The prices are also very interresting, we can see that the chance that you can get 1MWh of electricity for -5€ to 5€ is the same propabilty of getting it for 65 to 75 or 135 to 145 €
Higher residual load leads to higher prices of electricits (WOW, who would have thought XD)
Below a threshold of lower than 0.25% the energy prices dropped significantly.
