A new take on debuggers for quantum transpilers. This repository presents a debugger for the qiskit transpiler in the form of a lightweight jupyter widget. Built as a project for the Qiskit Advocate Mentorship Program, Fall 2021.
- To install the debugger using pip (a Python package manager), use -
pip install qiskit-trebuggerPIP will handle the dependencies required for the package automatically and would install the latest version.
- To directly install via github follow the steps below after using
git clone:
git clone https://github.com/TheGupta2012/qiskit-timeline-debugger.git- Make sure
python3andpipare installed in your system. It is recommended to use a Python virtual environment to install and develop the debugger cdinto theqiskit-timeline-debuggerdirectory- Use
pip install -r requirements.txtto install the project dependencies - Next, execute
pip install .command to install the debugger
- After installing the package, import the
Debuggerinstance fromqiskit_trebuggerpackage. - To run the debugger, simply replace the call to
transpile()method of the qiskit module withdebug()method of your debugger instance. - The debugger provides two types of views namely jupyter and cli
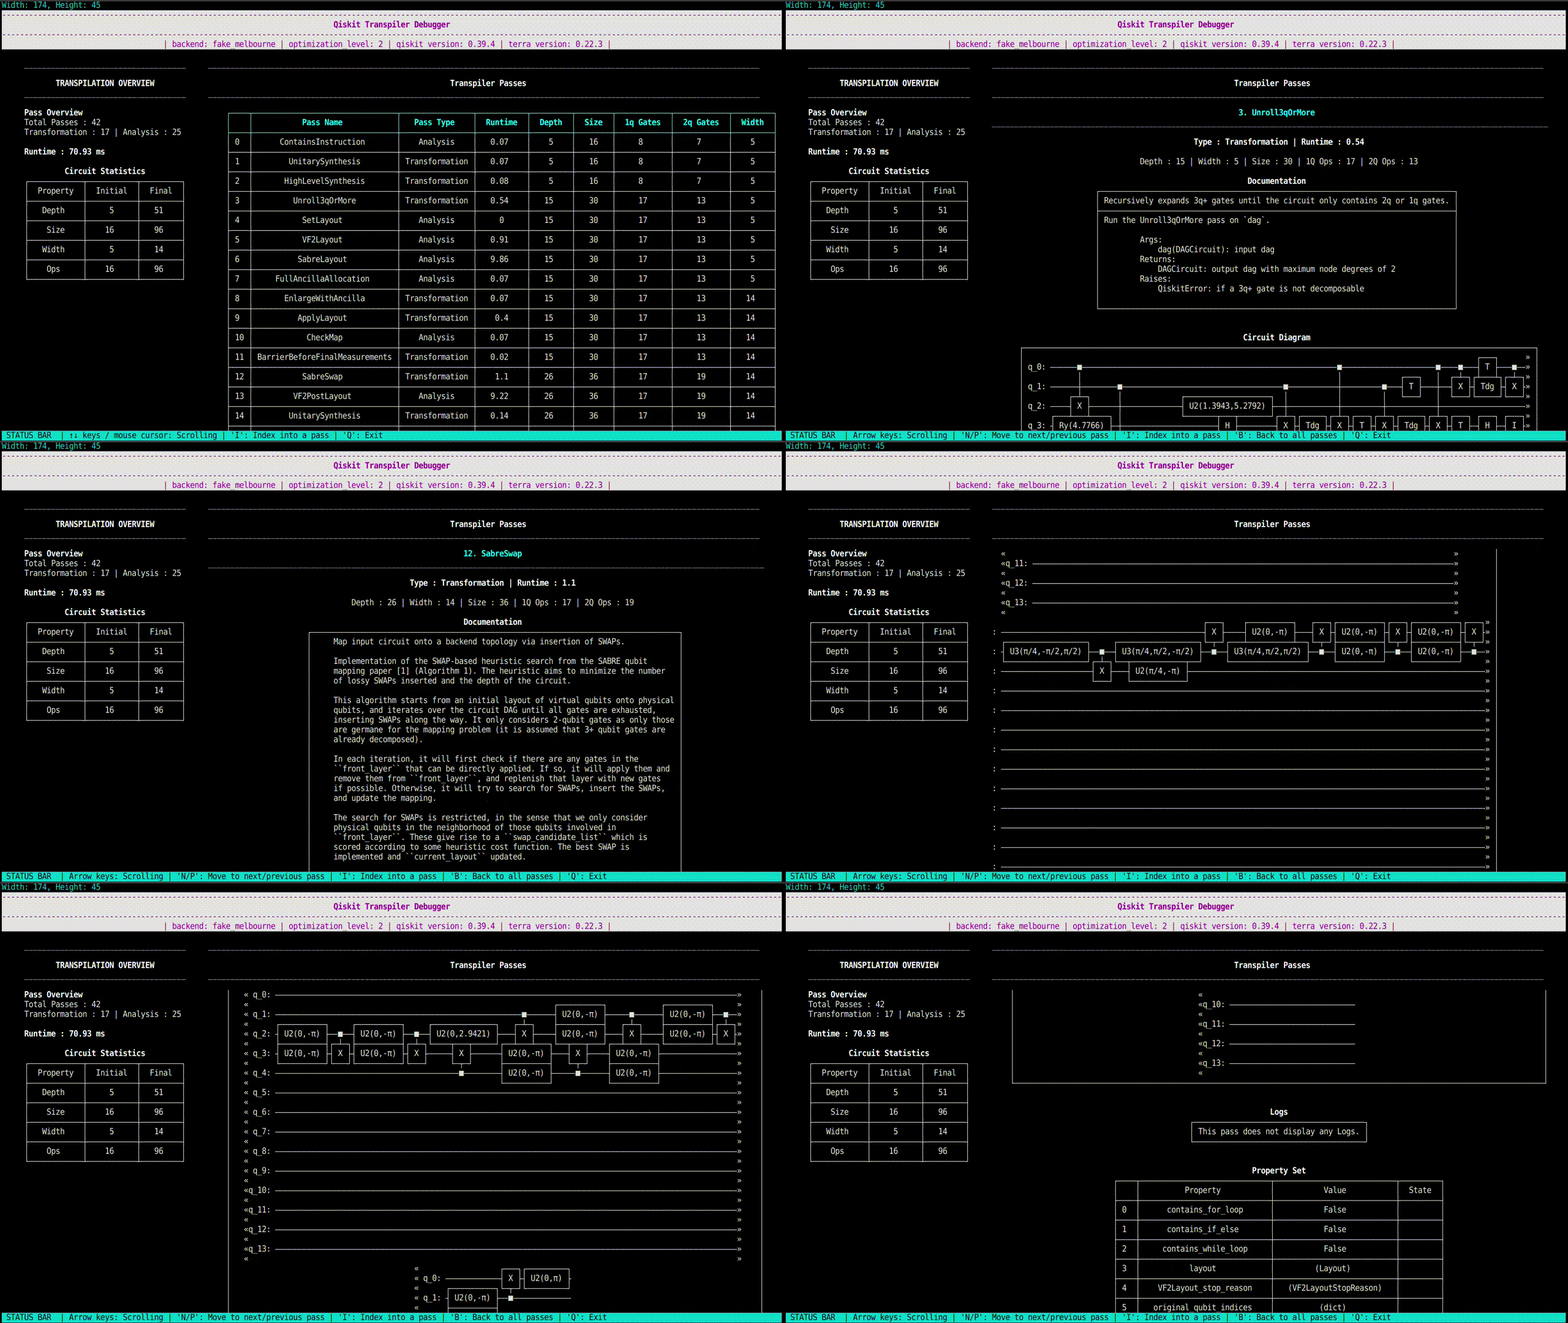
- The cli view is the default view and recommender for users who want to use the debugger in a terminal environment
- The jupyter view is recommended for usage in a jupyter notebook and provides a more interactive and detailed view of the transpilation process.
- For example -
from qiskit_ibm_runtime.fake_provider import FakeCasablanca
from qiskit.circuit.random import random_circuit
from qiskit_trebugger import Debugger
import warnings

warnings.simplefilter('ignore')
debugger = Debugger()
backend = FakeCasablanca()
circuit = random_circuit(num_qubits = 3, depth = 2 , seed = 42)
# replace transpile call
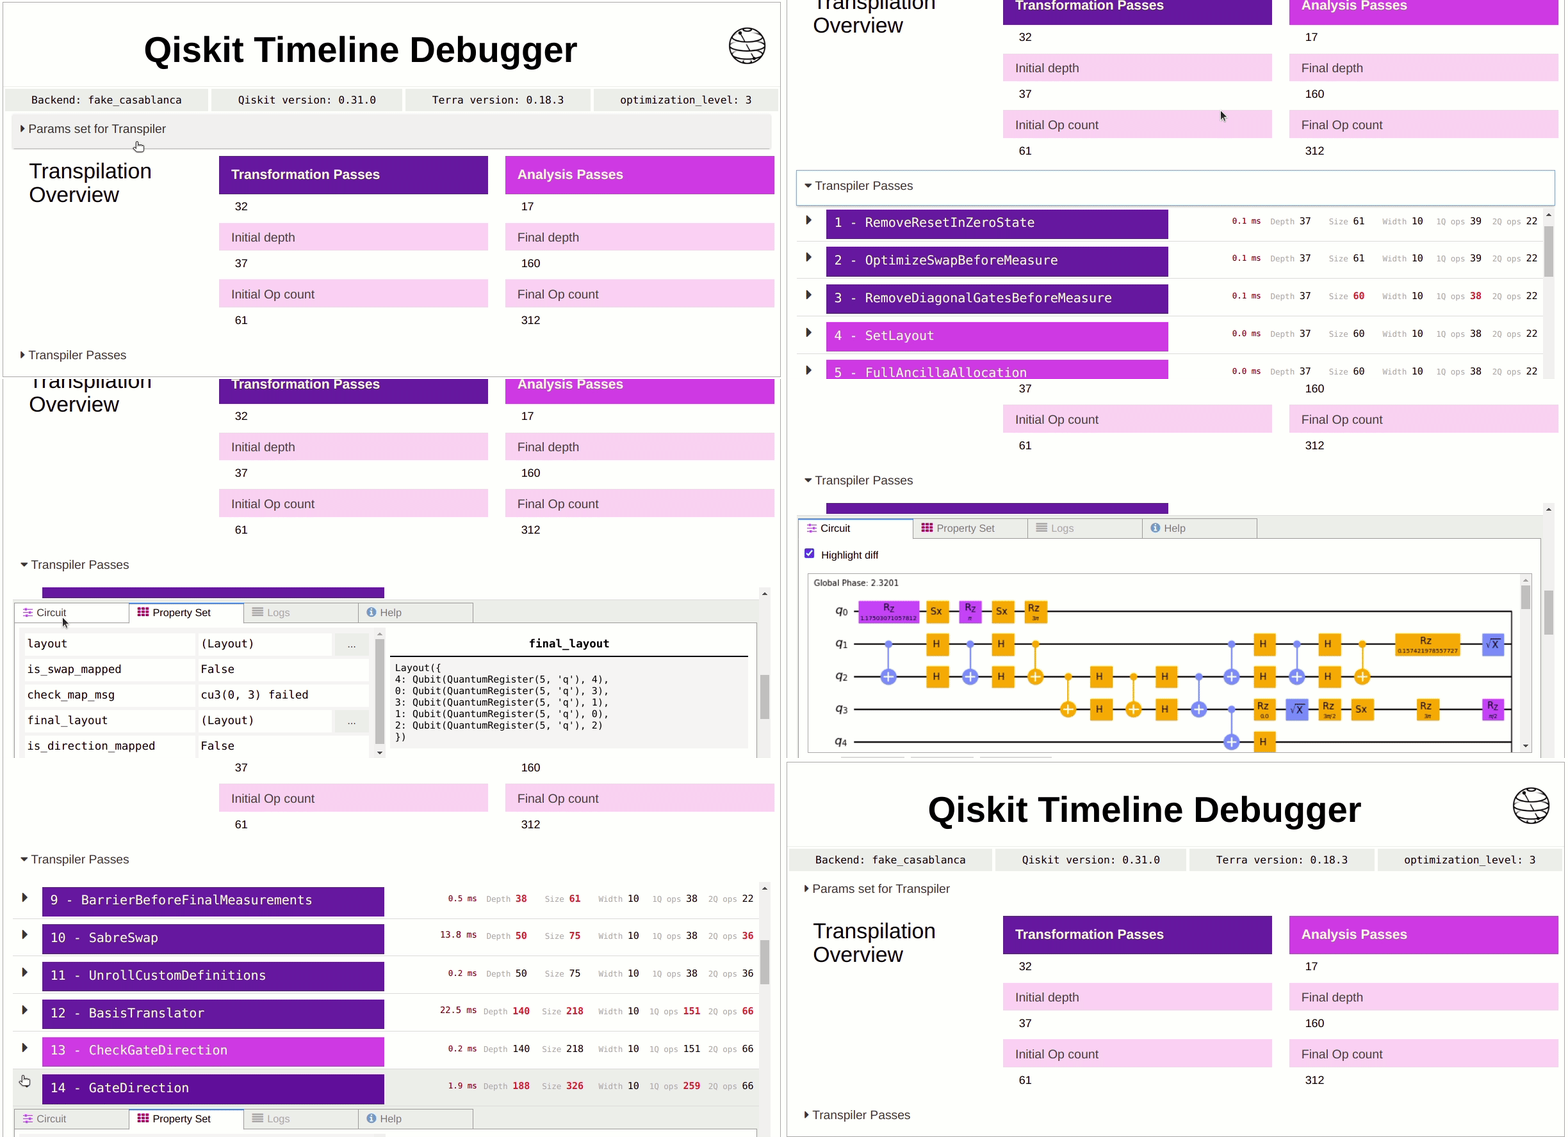
debugger.debug(circuit, view_type="jupyter", optimization_level = 2, backend = backend, initial_layout = list(range(4)))- On calling the debug method, a new jupyter widget is displayed providing a complete summary and details of the transpilation process for circuits of < 2000 depth
- With an easy-to-use and responsive interface, users can quickly see which transpiler passes ran when, how they changed the quantum circuit, and what exactly changed.
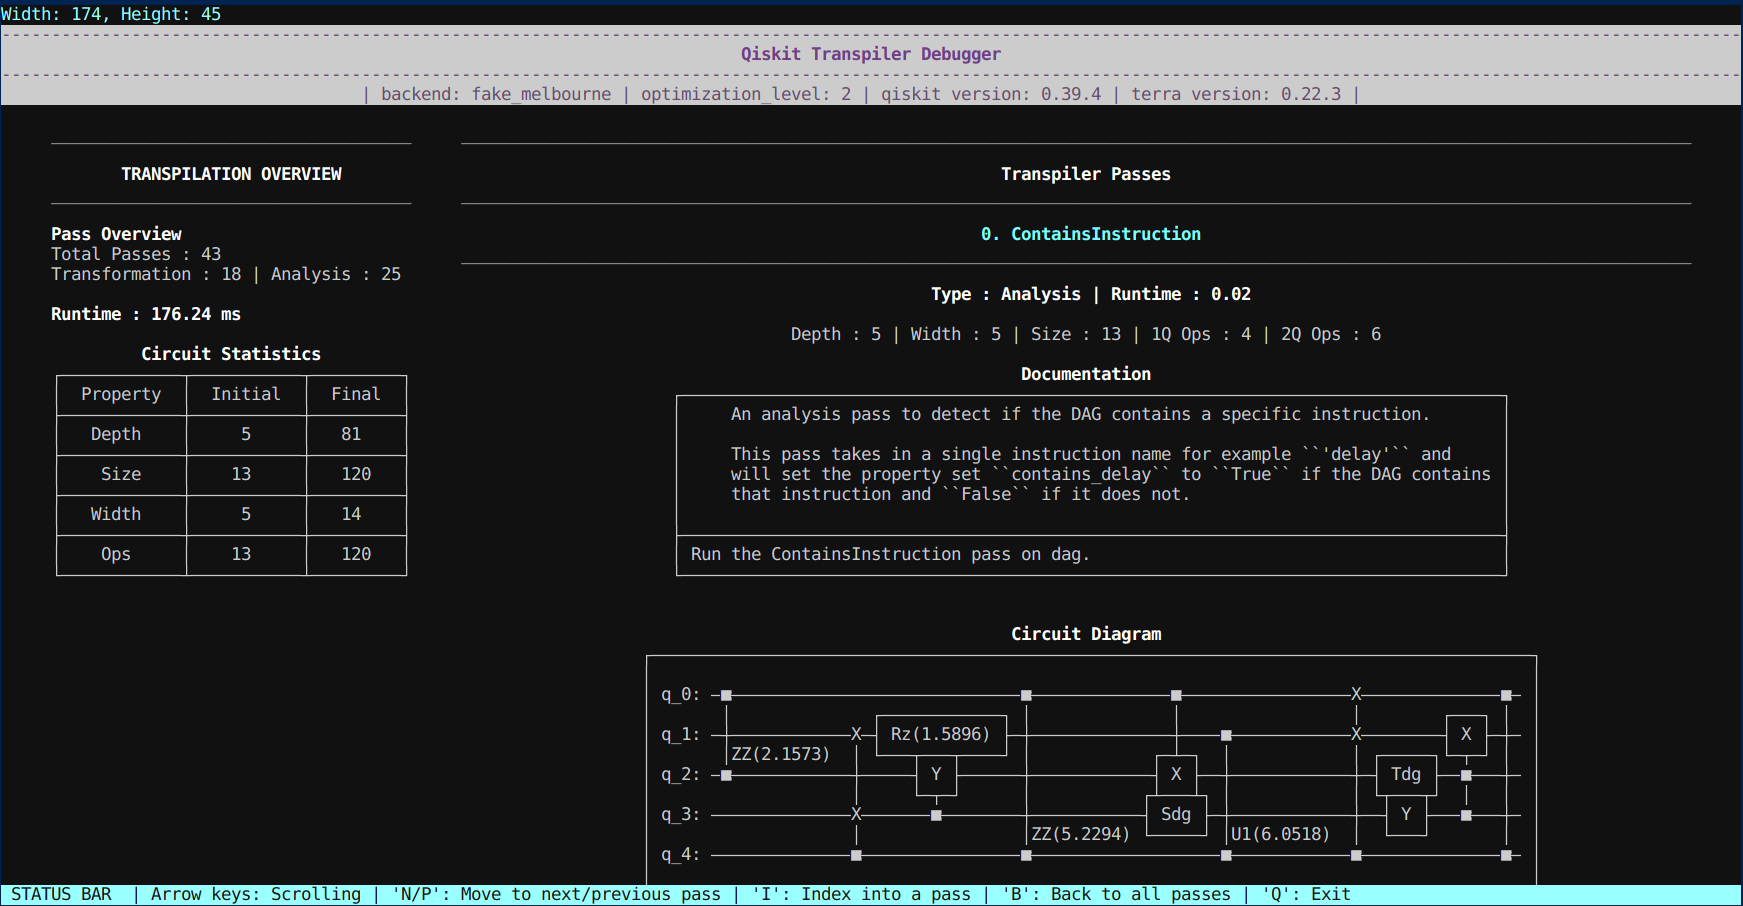
- See your circuit changing while going through the transpilation process for a target quantum processor.
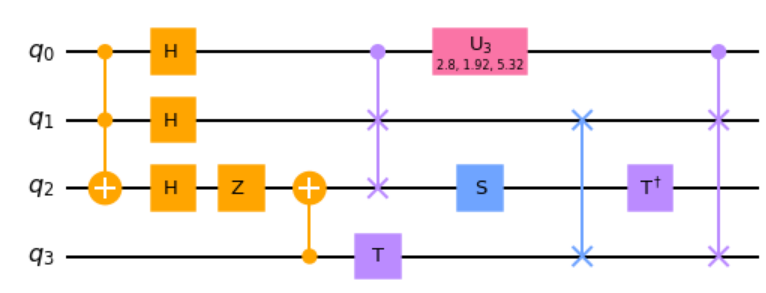
- A new custom feature enabling visual diffs for quantum circuits, allows you to see what exactly changed in your circuit using the matplotlib drawer of the qiskit module.
Example
- Circuit 1
- Circuit 2
- Allows users to quickly scan through how the major properties of a circuit transform during each transpilation pass.
- Helps to quickly isolate the passes which were responsible for the major changes in the resultant circuit.
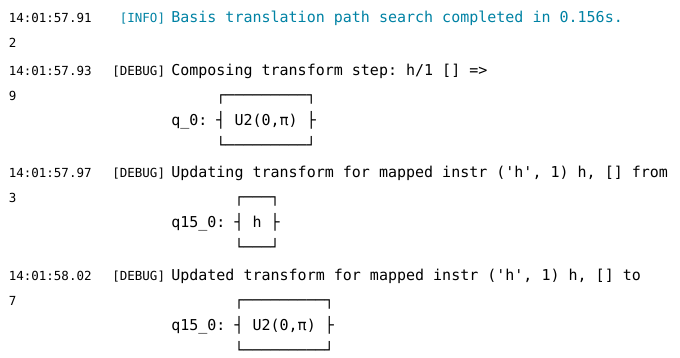
- Easily parse actions of the transpiler with logs emitted by each of its constituent passes and changes to the property set during transpilation
- Every log record is color coded according to the level of severity i.e.
DEBUG,INFO,WARNINGandCRITICAL.
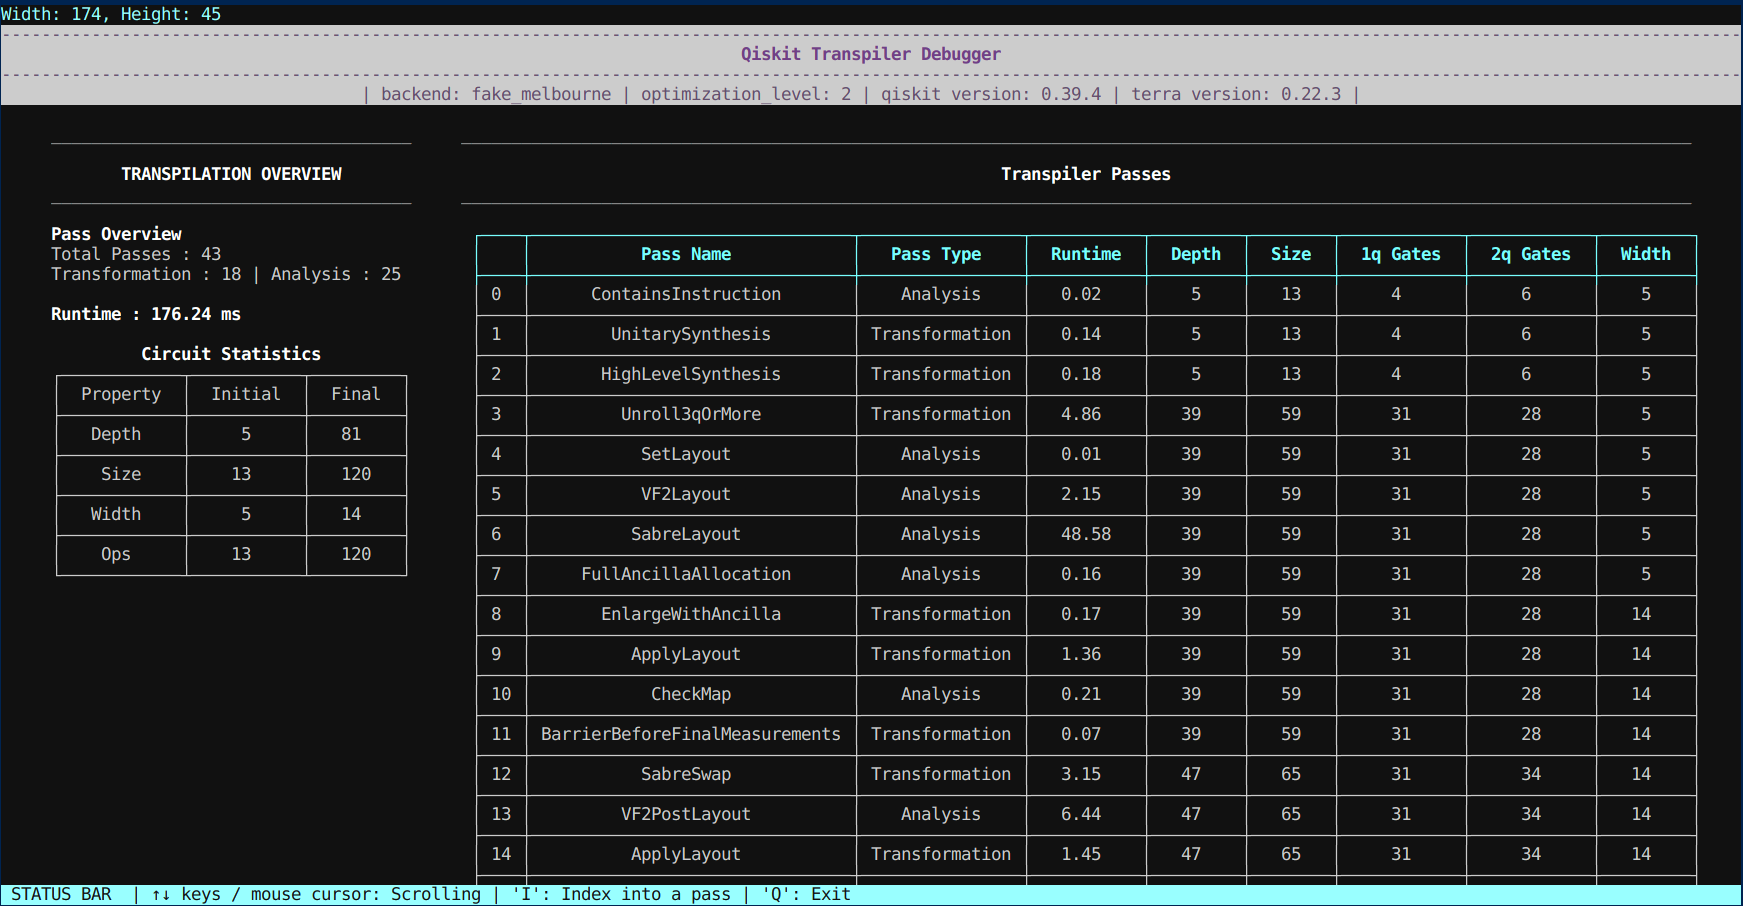
- A quick summary of the transpilation process for a given circuit.
- Faster access to information in the CLI view.
- The CLI view provides keyboard shortcuts for easy navigation and access to transpiler information.
- An interactive status bar at the bottom of the screen provides information about the current state of the debugger.
- Emits transpiler logs associated with each of the transpiler passes.
- Highlights addition to the property set and its changes during the transpilation process.
We use the pydoc module to generate project documentation
- Here is a demonstration of TreBugger as a part of the final showcase for the Qiskit Advocate Mentorship Program, Fall 2021.
- You can also read some more details of our project in the Qiskit medium blog


