A quantitative measure of coupling and cohesion between TypeScript modules/files.
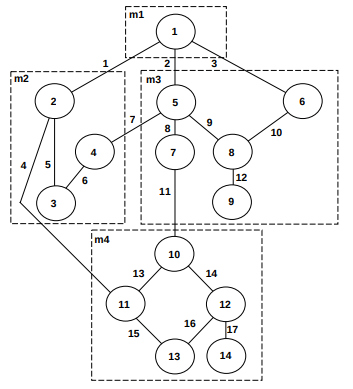
As I see things, there are two main structures to consider here:
- the dependencies between modules/files (a directed graph)
- the file/directory structure (a tree)
Some things I think are good:
- the dependency graph being acyclic
- the dependency graph being tree-like
- the dependency graph closely mirroring the file/directory structure
- dependencies being close together (in terms of how far you need to traverse the directory tree to resolve a dependency)
I am not sure how best to quantify any of these measures.
This approach is described here.
Pros:
- gives quantitative measures for:
- intermodule coupling
- intramodule coupling
- cohesion
Cons:
- I'm not familiar enough with the maths to quickly understand or apply it
- assumes all modules are equal, does not consider submodules
- e.g. if a file is a node, and a directory is a grouping of nodes (a module), how do we handle subdirectories?
- MS - Modular system, represented as a graph
- S - a subgraph with n+1 nodes, including 1 for the environment (disconnected)
- ns - number of distinct labels (each node is labelled with the set of connected edges)
- pl - proportions of distinct labels
- pL(i) - proportion of a node i's distinct label set (relative to total number of nodes)
- Entropy - average information per node
- Minimum description length - the total amount of information in the structure of the graph
- I(S) - minimum description length
- Intermodule coupling - minimum description length of the relationships in S where S is a subgraph with intermodule edges only
- Intramodule coupling - minimum description length of the relationships in S' where S' is a subgraph with intramodule edges only
- Cohesion - intramodule coupling / maximum intramodule coupling (all nodes connected)
H(S) = Σ(-pl log pl)
from l=1 to ns
H(S) = Σ((-log pL(i))/(n + 1))
from i=0 to n
I(S) = (n + 1) H(S)
I(S) = Σ(-log pL(i))
from i=0 to n
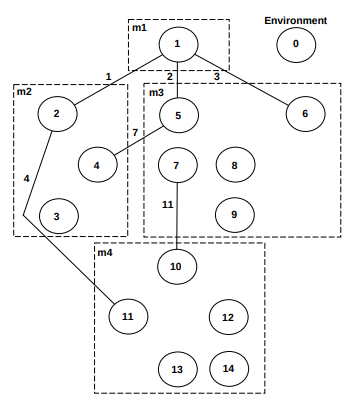
All diagrams from [1].
This is an example of intermodule coupling. All intramodule edges have been removed.
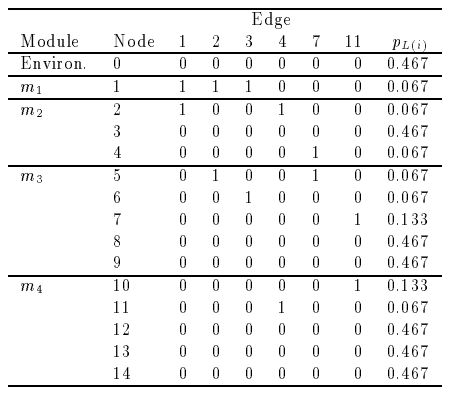
Node 3 has pL(i) of 0.467 because there are 7 nodes with the same distinct label set, and 15 nodes total: 7/15 = 0.467.
| Node | 1 | 2 | 3 | 4 | 7 | 11 | pL(i) |
|---|---|---|---|---|---|---|---|
| 0 | 0 | 0 | 0 | 0 | 0 | 0 | 0.467 |
| 1 | 1 | 1 | 1 | 0 | 0 | 0 | 0.067 |
| 2 | 1 | 0 | 0 | 1 | 0 | 0 | 0.067 |
| 3 | 0 | 0 | 0 | 0 | 0 | 0 | 0.467 |
| 4 | 0 | 0 | 0 | 0 | 1 | 0 | 0.067 |
| 5 | 0 | 1 | 0 | 0 | 1 | 0 | 0.067 |
| 6 | 0 | 0 | 1 | 0 | 0 | 0 | 0.067 |
| 7 | 0 | 0 | 0 | 0 | 0 | 1 | 0.133 |
| 8 | 0 | 0 | 0 | 0 | 0 | 0 | 0.467 |
| 9 | 0 | 0 | 0 | 0 | 0 | 0 | 0.467 |
| 10 | 0 | 0 | 0 | 0 | 0 | 1 | 0.133 |
| 11 | 0 | 0 | 0 | 1 | 0 | 0 | 0.067 |
| 12 | 0 | 0 | 0 | 0 | 0 | 0 | 0.467 |
| 13 | 0 | 0 | 0 | 0 | 0 | 0 | 0.467 |
| 14 | 0 | 0 | 0 | 0 | 0 | 0 | 0.467 |
Using the equation for entropy:
H(S) = 7*0.0732 + 6*0.26 + 2*0.194 = 2.46 bits per node
And minimum description length:
I(S) = 15 * 2.46 = 36.9 bits


