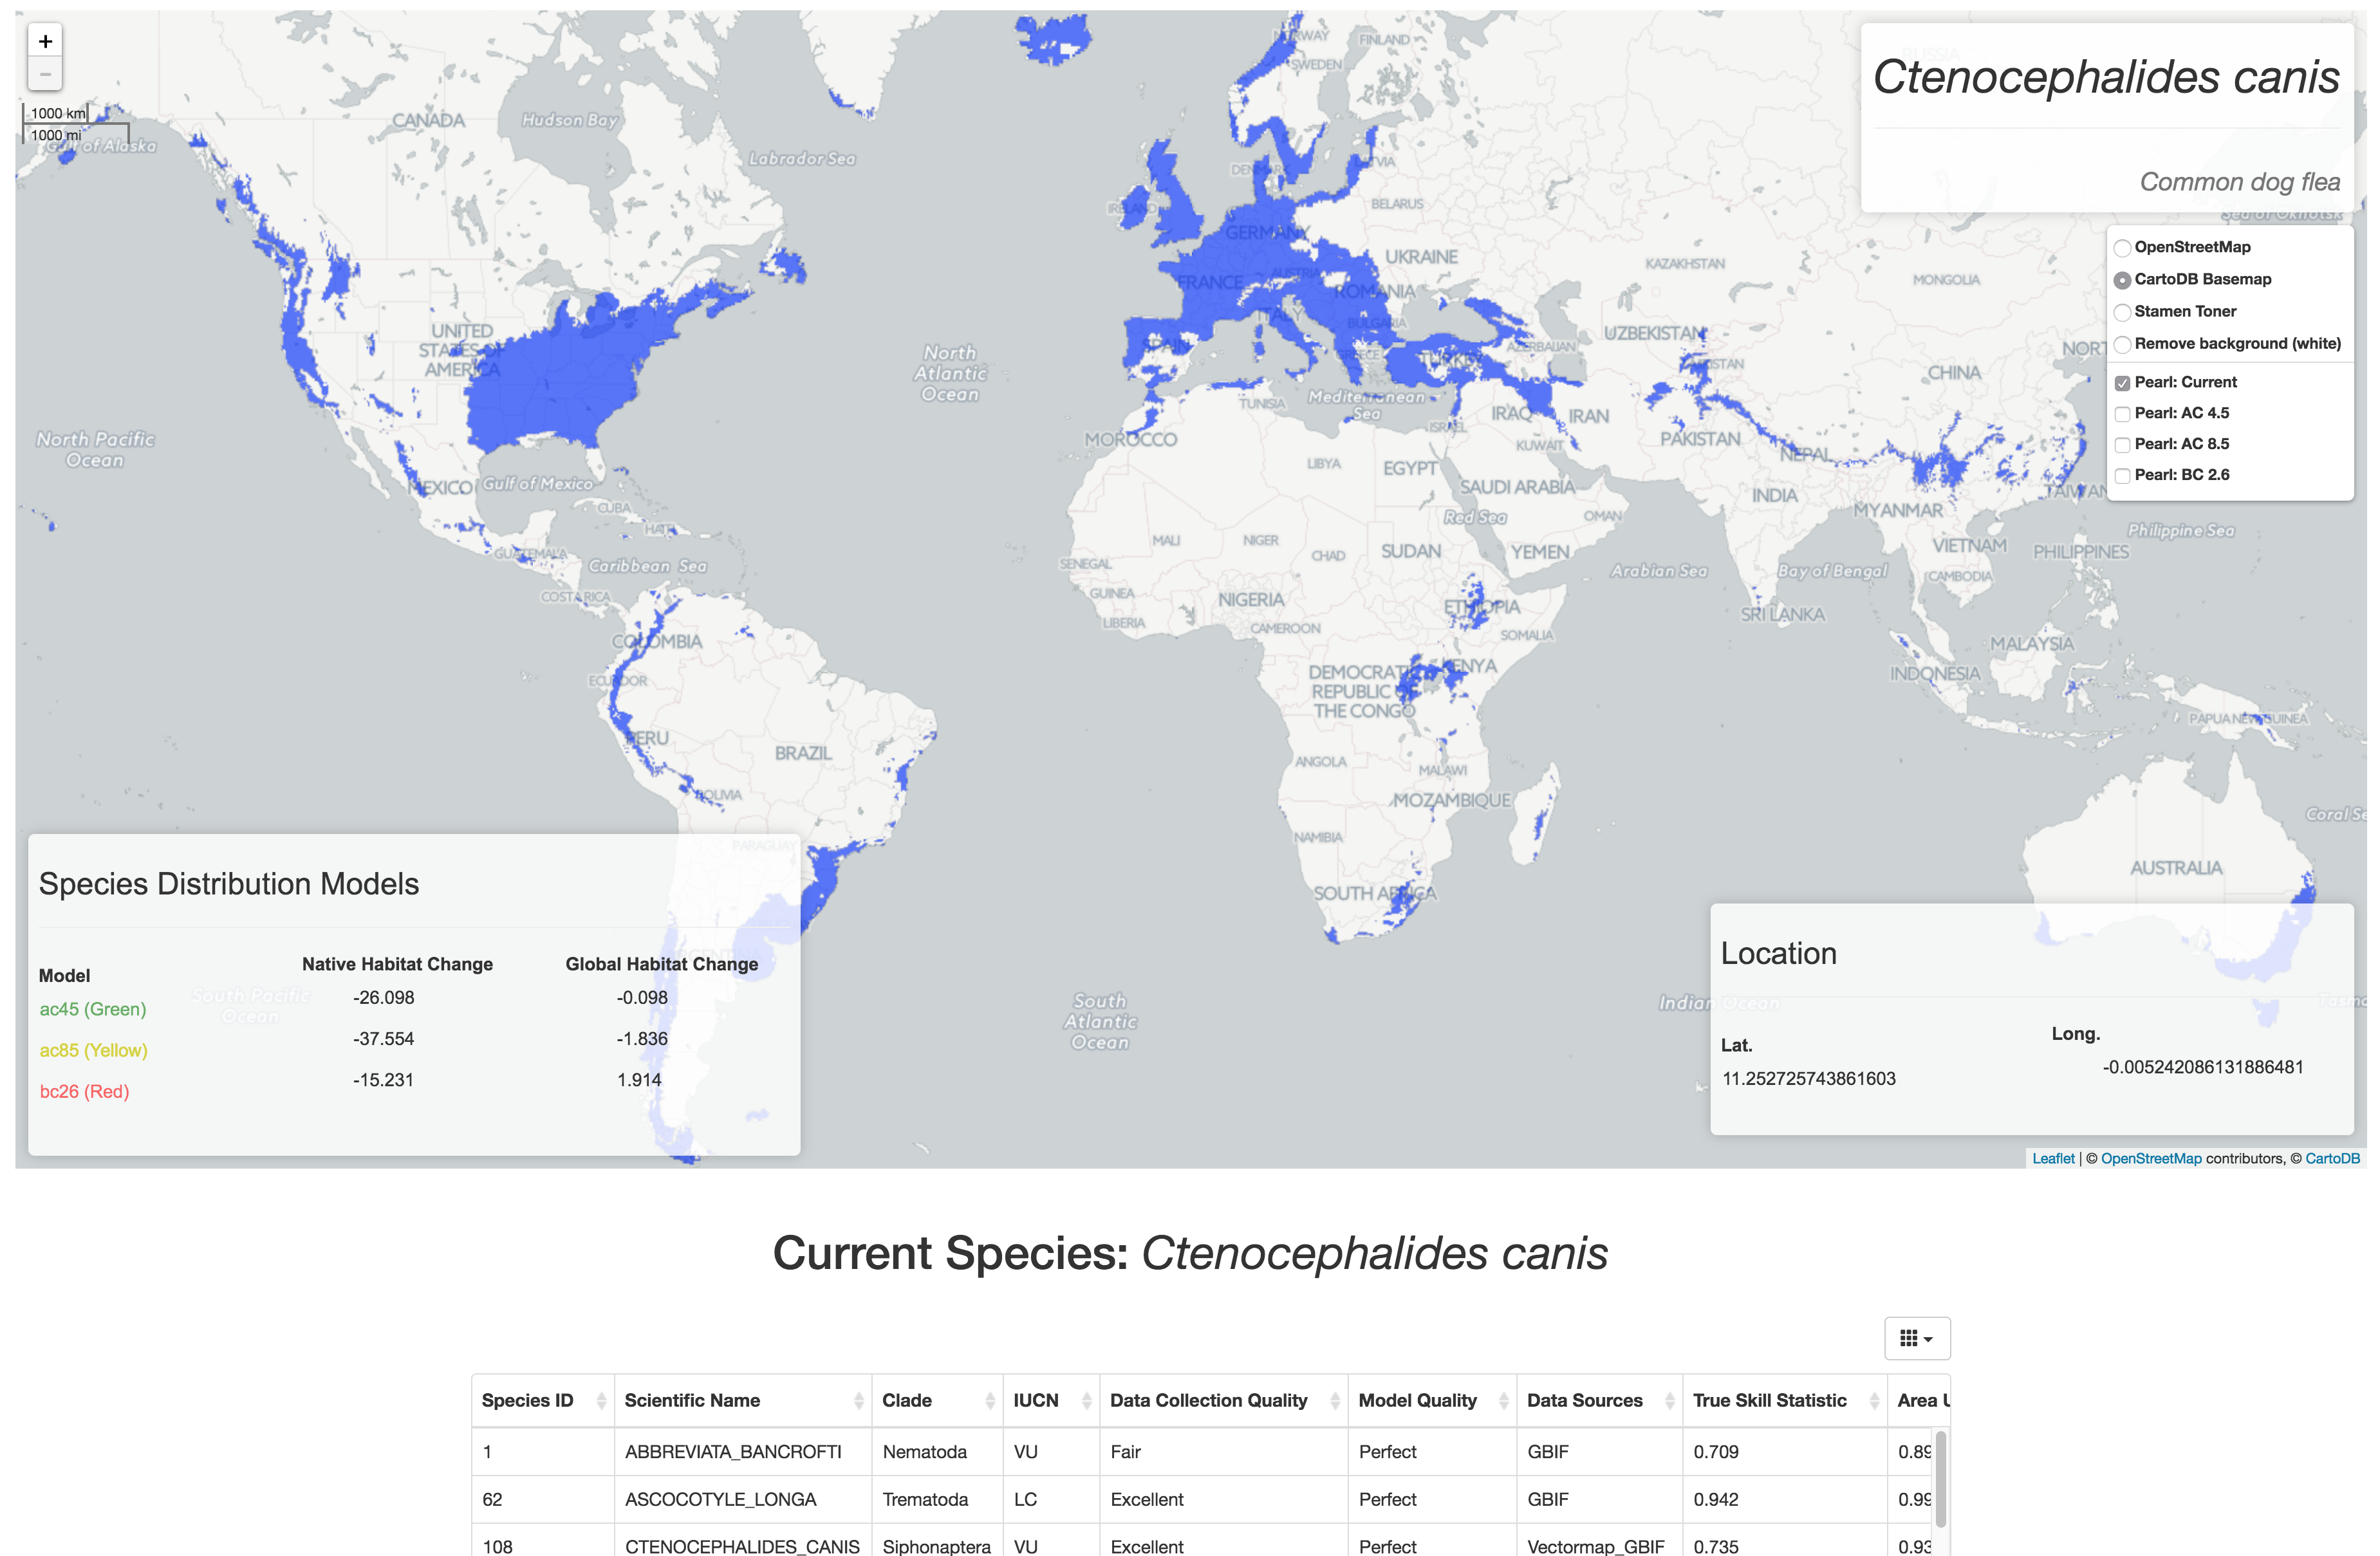
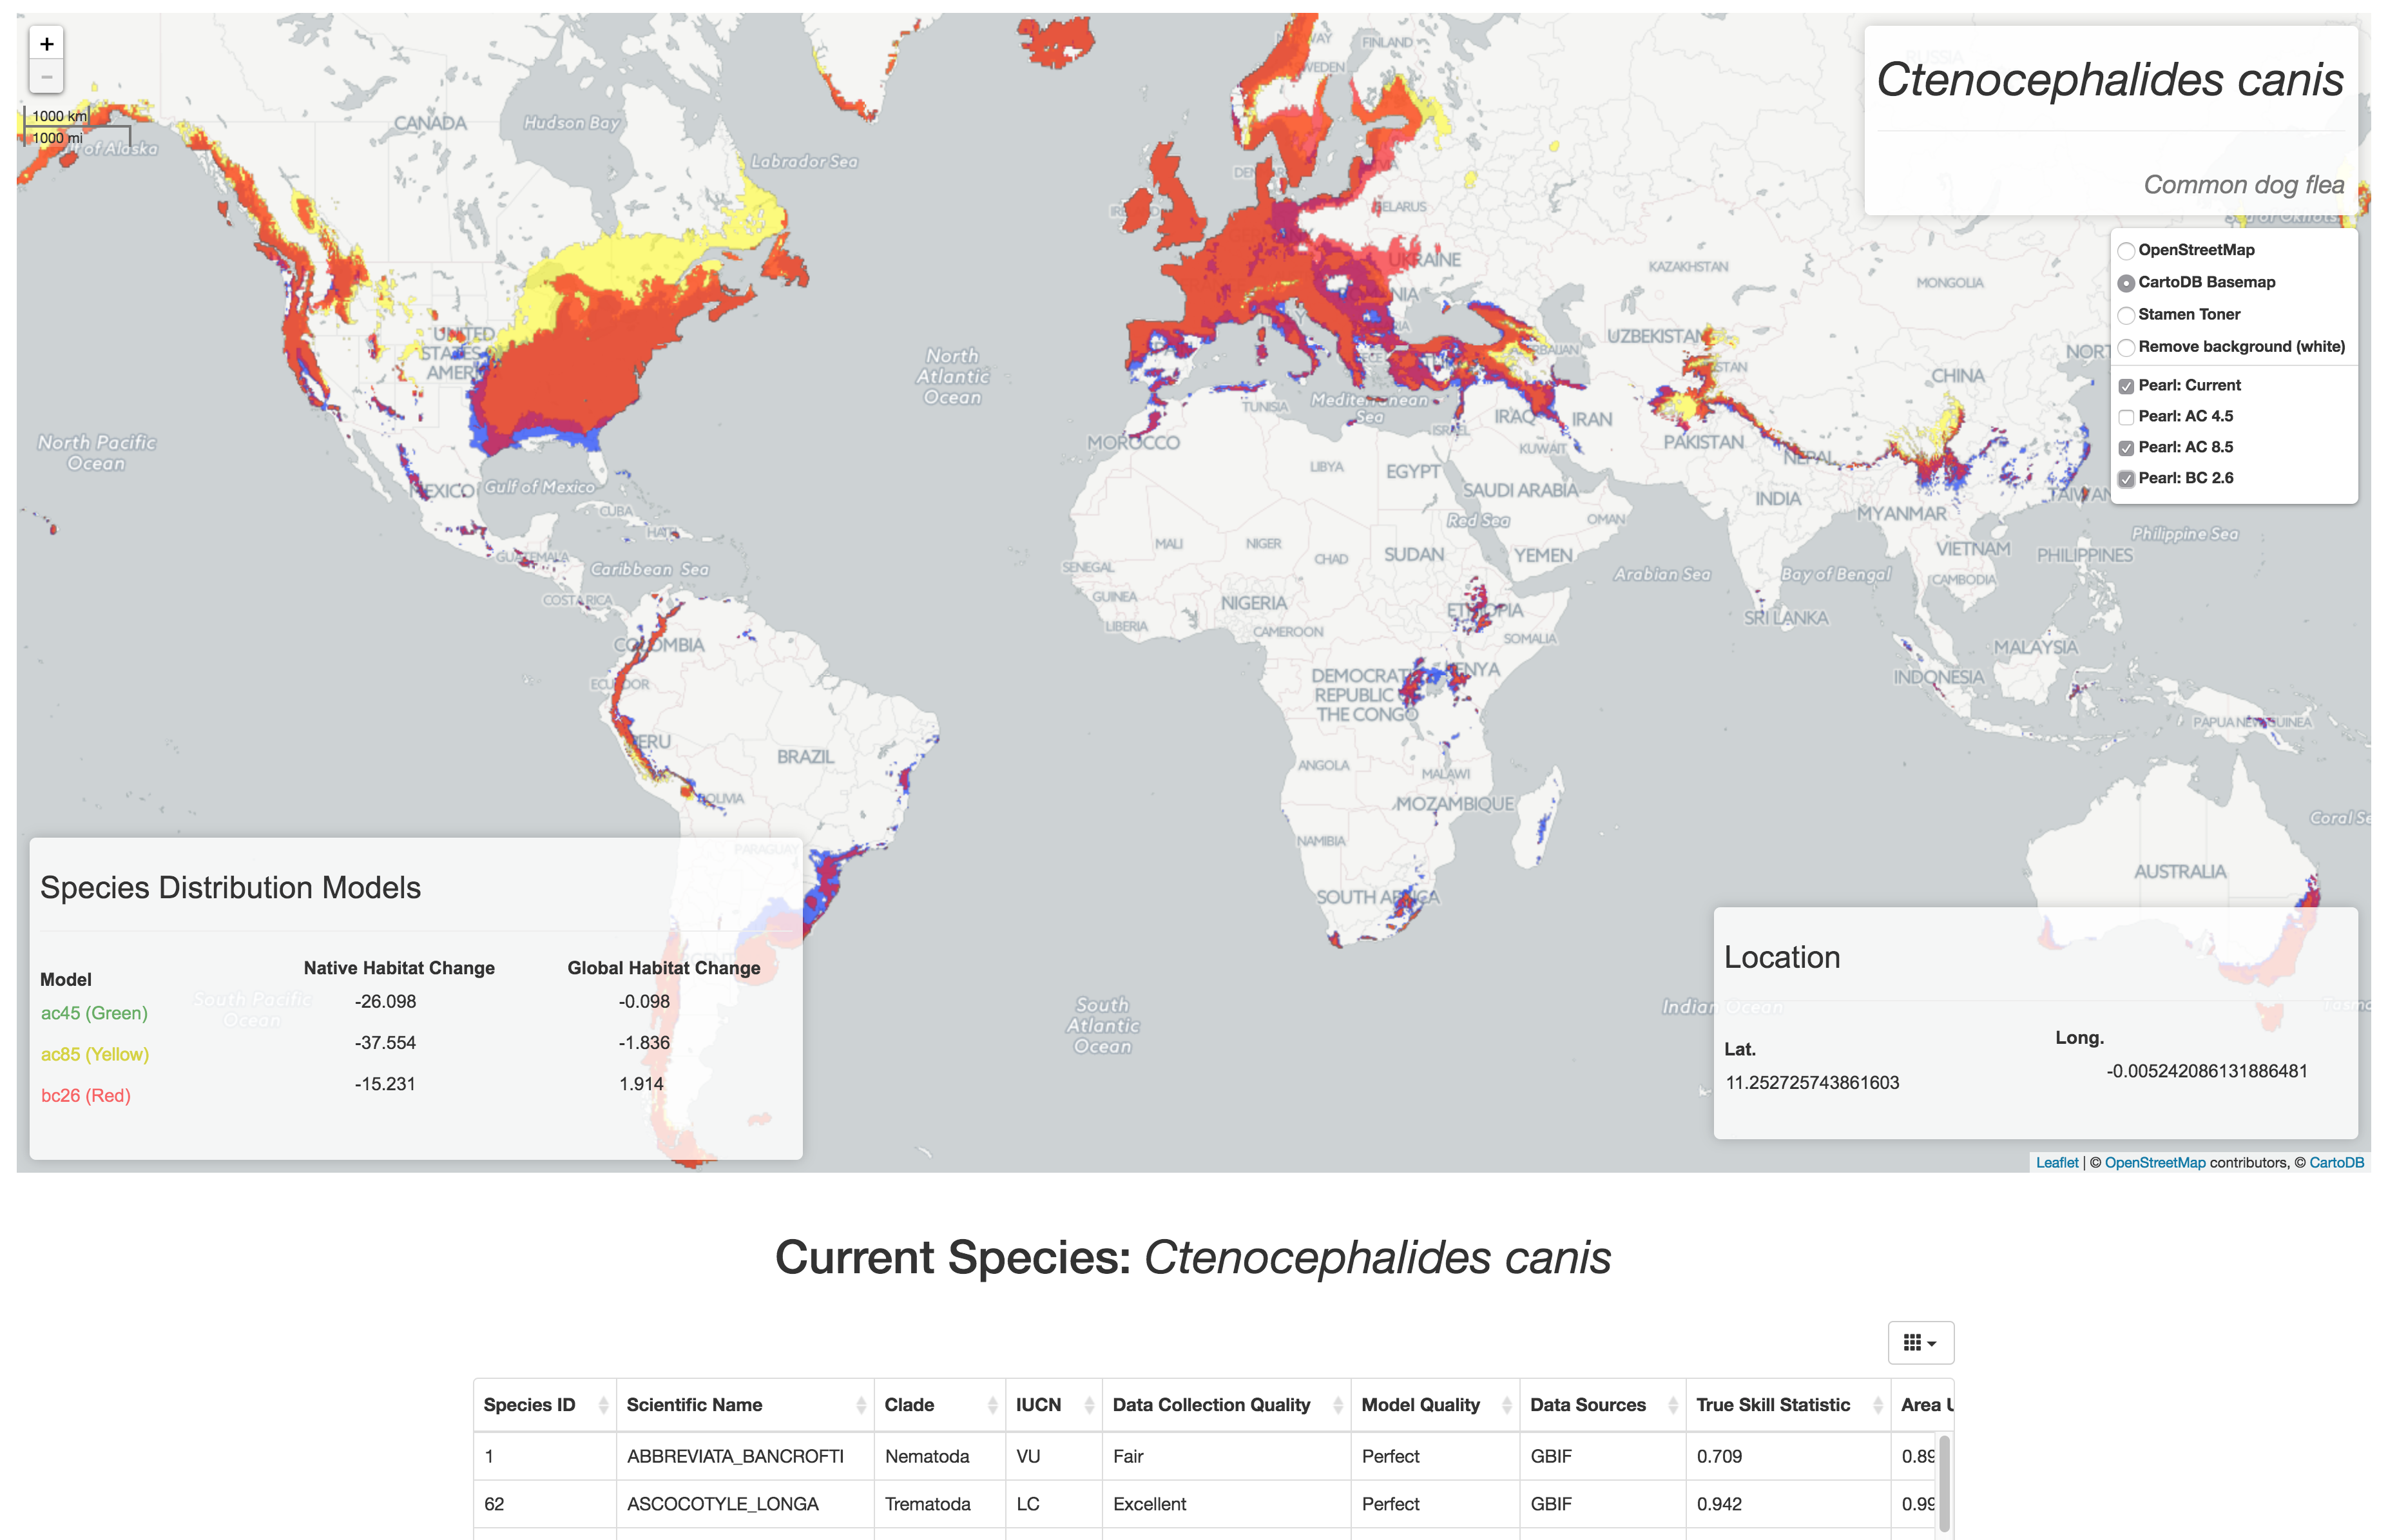
Mapping global projections of current and future distributions of 450+ species of parasites.
PEARL1.0 makes use of EWAIM, a mapping framework developed by Oliver Muellerklein and Zhongqi Miao of the Wayne Getz lab at UC Berkeley for interactive web mapping. EWAIM is also used for interactive web mapping of big data / high traffic data systems - see our project on visualizing movement of migratory birds in Israel.
If needed, install local version of Python3:
    cd Python-3.X.X
    mkdir ~/.localpython
    ./configure --prefix=/home/USERNAME/.localpython
    make altinstall
    /home/USERNAME/.localpython/bin/python3
Dependencies of web app:
    pip3 install --upgrade pip
pip3 install flask flask_bootstrapEWAIM-webapp is a web mapping app that uses Leaflet x D3 (Javascript) on the frontend and Flask x PostGreSQL on the backend. In addition, we include a directory titled EWAIM that contains a Python package for some simple data analysis and utility functionality - used in the backend. The EWAIM package has continuous testing through Travis-CL. Users of this app (for now) need to run the setup.py file to make the EWAIM module (EWAIM is imported and used in the main Flask app.py file). Our future development includes building further data processing and analysis functions as well as Species Distribution Model functions in the EWAIM package focused on spatial, movement, and time series data.
Species: Abbreviata bancrofti
Showing predicted changes in native and global habitat due to climate trends using three different distribution models (green, yellow, and red). Current distribution shown in blue.
EWAIM (the webapp as well as the package) will be extended for direct research applications with at least two large-scale research projects in the Wayne Getz lab at UC Berkeley. One will be for the Israel Migratory Bird project - a study that is collecting spatial data of bird movement (roughly 2 million points daily). The other direct application is for PEARL: Parasite Extinction Assessment and Red-Listing - a database of Species Distribution Models (predictions of presence / absence) of species of parasites currently and future projections based on climate change trends.
    $ python3 setup.py install
    # And test (used for Travis-CL)
    $ python3 setup.py test
-
See
grdfolder for a single species .grd files (current raster and 18 future scenarios) -
See
raster_data_prepfolder for raster data preparation.
Follow instructions in raster_data_prep for creating tile map data structure from .grd data of species.
NOTE: running the tile map creation code in raster_data_prep will likely take a very long time (e.g. many days) and generate ~130gb of tile map data from the 455 species + grid files.
Future development will include allow users to upload new presence or climate data and automating the building of models based on new input.

