Heat map of Web users viewing time allocation across websites
With this bookmarklet you can put a heat map, which reveals how the average Web user distributes their viewing time across websites, on every website. It’s useful for web project managers and designers who are starting a landing page and deciding its layout.
How it works
Install bookmarklet launch it on any page, image or mock-up of your next landing page (you can upload images with TrackDuck) or check example

Support and credits
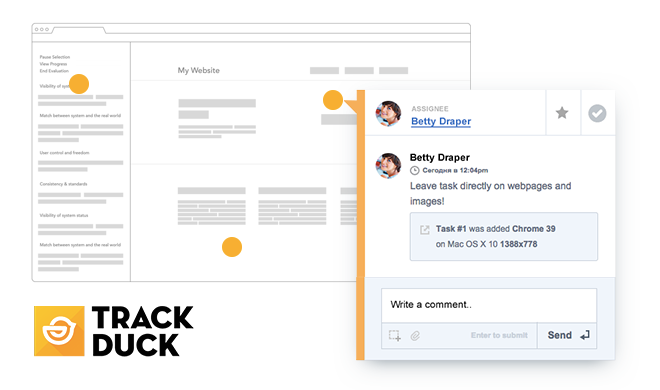
Created and maintained for you by TrackDuck - visual feedback and bug tracking with screenshots for web integrated with more than 15 project management systems.
If you have any questions/comments/recommendations drop us a line to: hello@trackduck.com