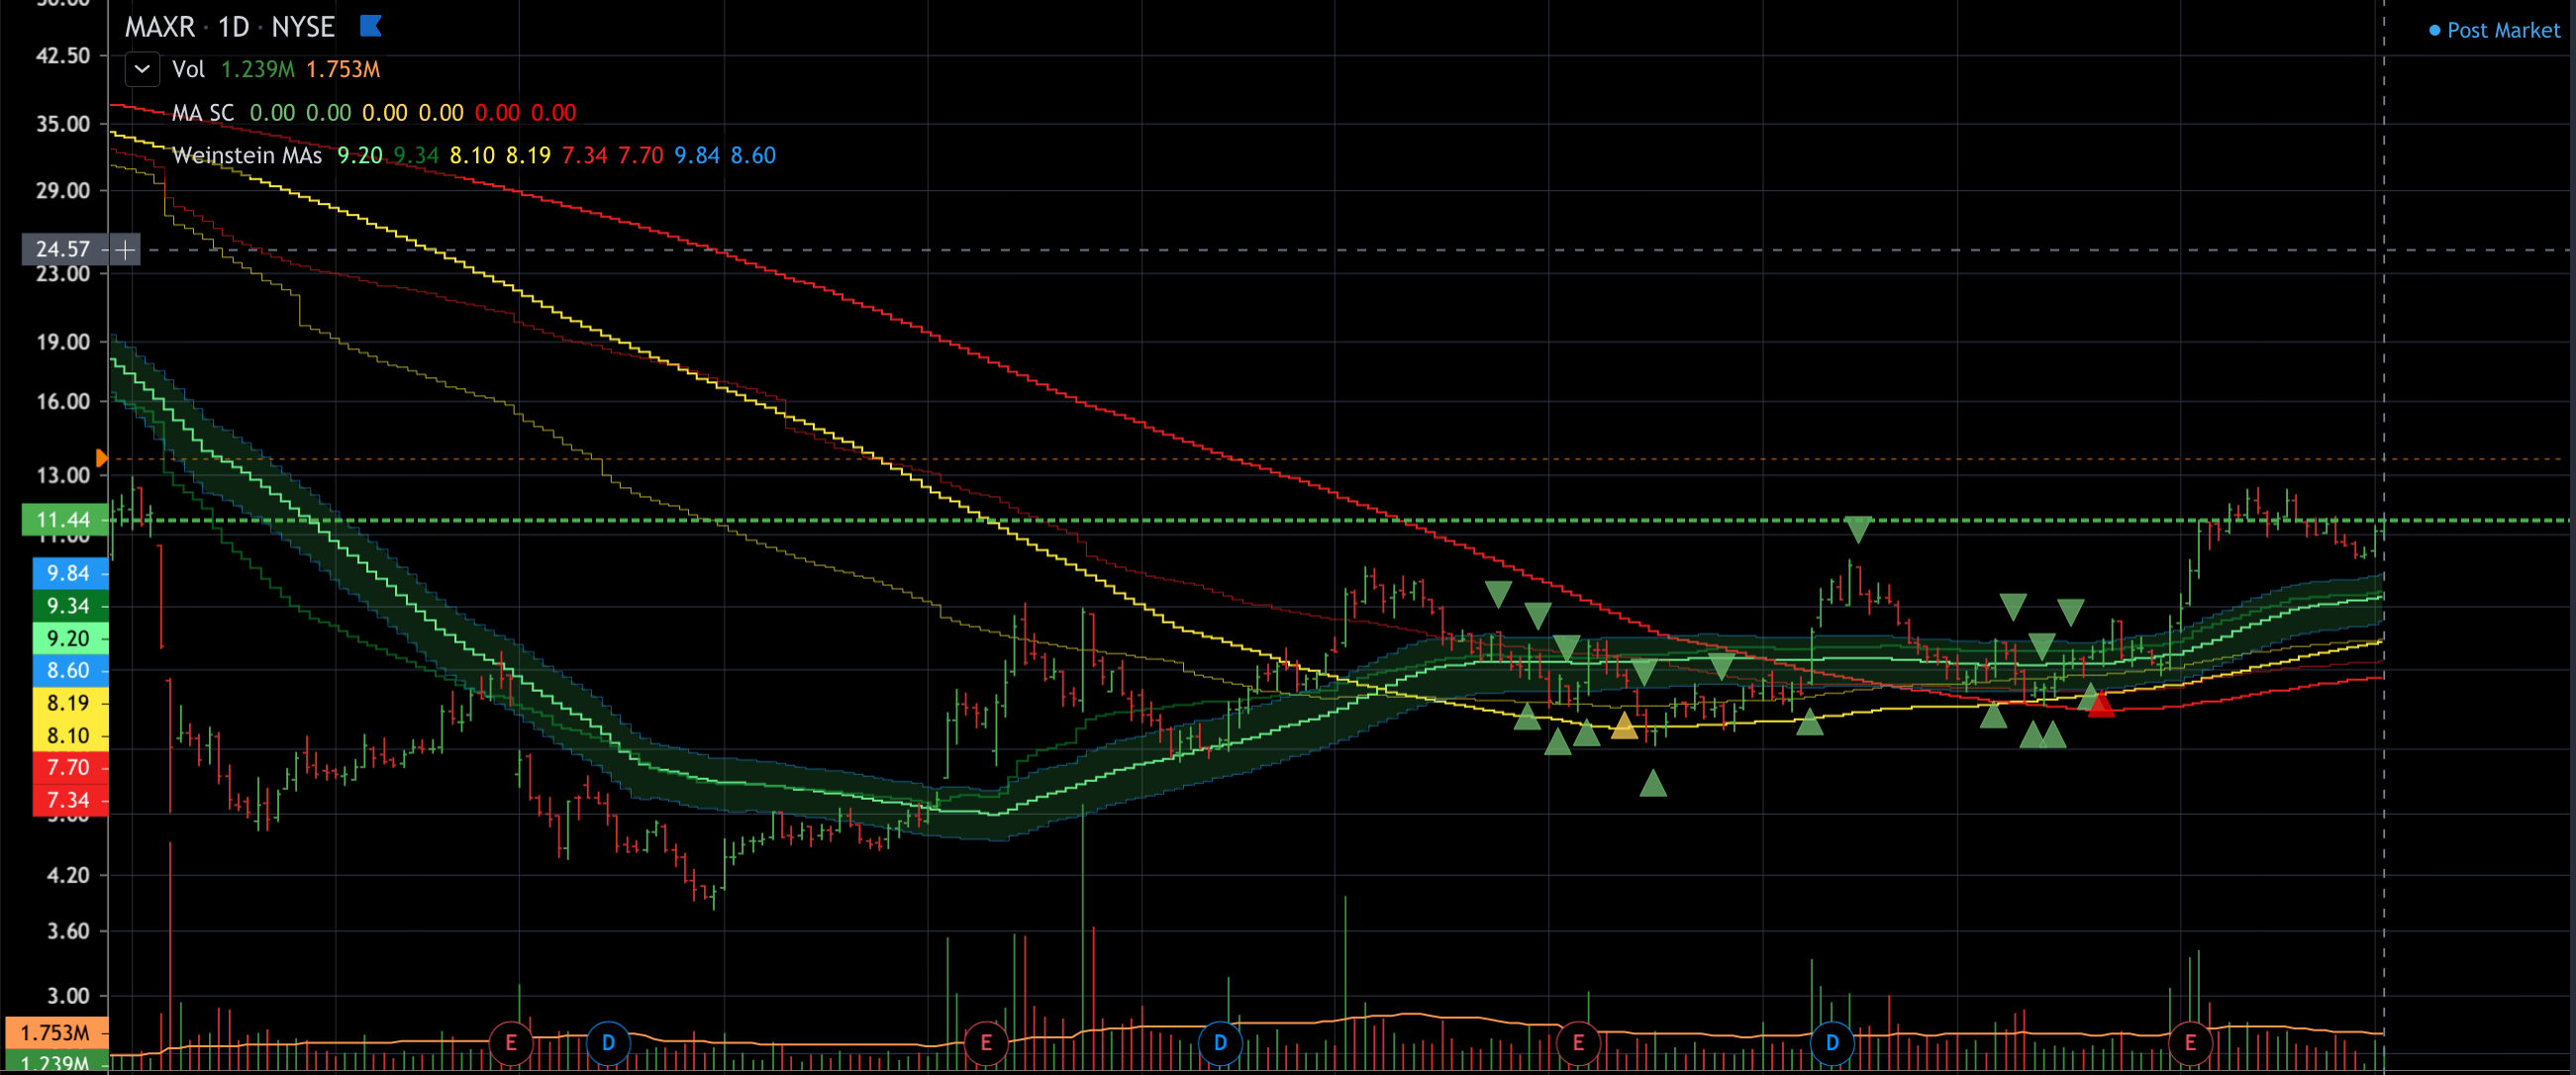
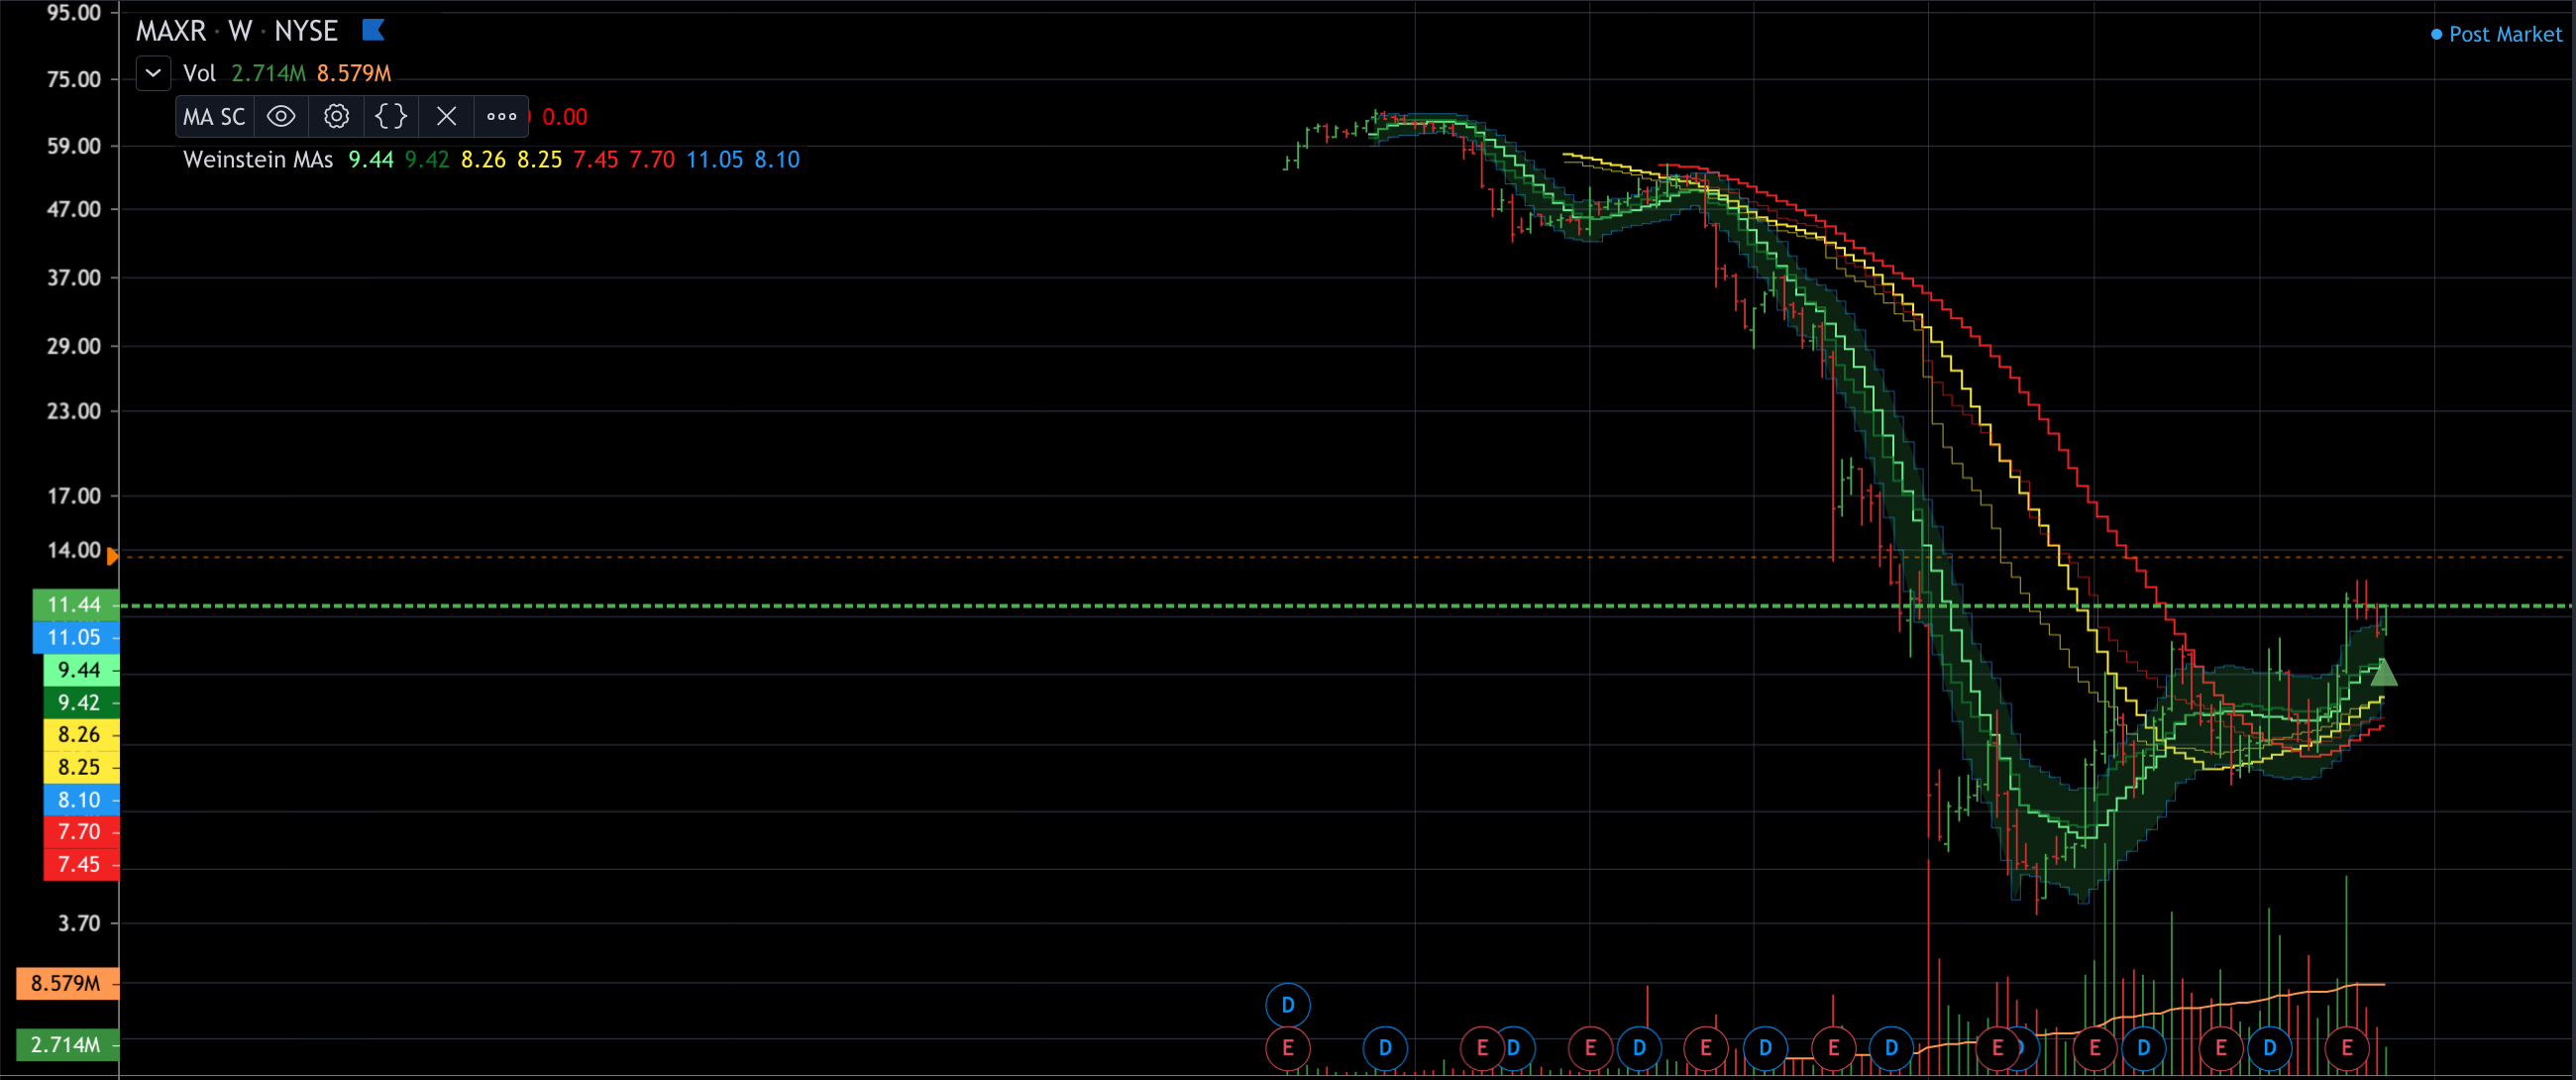
The majority of the code here is a component-by-component implementation of the charting principles outlined by Stan Weinstein in his 1988 book Secrets for Profiting in Bull and Bear Markets
That book and it's concepts are Copyright McGraw-Hill 1988.
This code is Copyright Sheldon Thomas 2020 subject to terms of file COPYING. Please note this code is GNU AGPL licensed.
Stage Analysis is a conceptual framework which posits all charts go through four stages. Stage 1 is the basing period, stage 2 is the break-out period of rising prices, stage 3 is the topping period as prices turn a corner and stage 4 is a period of sustained decline as supply overwhelms demand.
Weinstein built his methods against a type of chart known as a Mansfield chart. Mansfield no longer prints charts. This code attempts to accurately redraw Mansfield charts in Pine Script - the charting language for TradingView.com
nasdaq.pine
A bar chart of the difference between 52 week highs and 52 week lows on the
Nasdaq. Overlayed with the 50day/10week moving average of the

nyse.pine
NYSE 30 Week Moving Average Of The Advance Decline Ratio
Overlayed with a bar chart of the number of new 52 week highs and lows.

mansfield.pine
Mansfield Relative Strength which works uses Nasdaq Composite, NYSE Composite, ARCA Composite, and
Coinbase BTCUSD for it's alpha measure for stocks and crypto respectively.

weinstein.pine
This is a set of moving averages. In a weekly chart, it's the 10, 30, and 40 period moving averages.
In all other interval sizes it's the 50, 150, and 200 period moving averages.
It includes volume adjusted lines as well as an Average True Range indciated around the shortest interval moving average in the chart.
Daily
 Weekly
