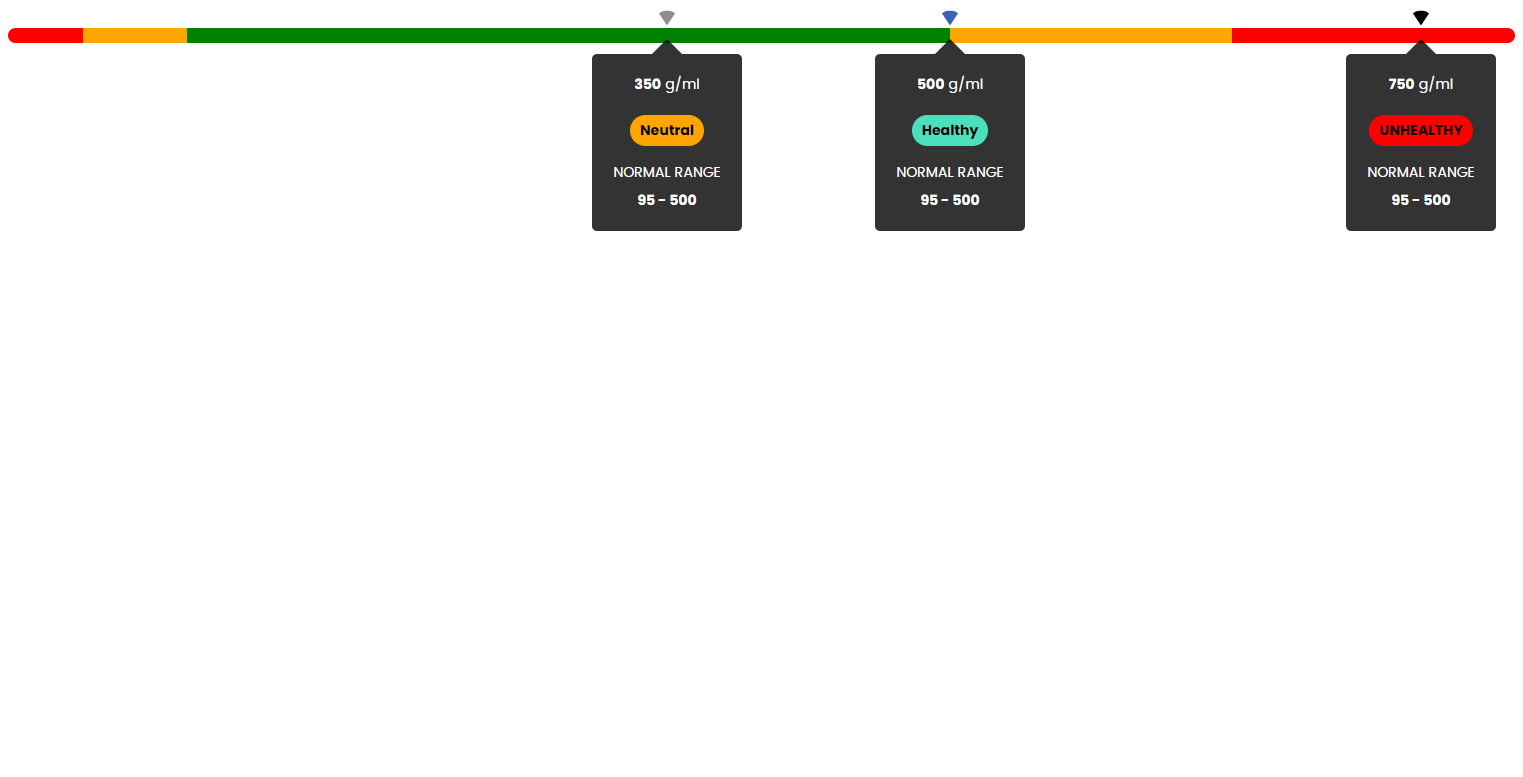
The Linear gauge is a web component designed to visually represent drug concentration levels within a given range. It features a linear gauge that displays different categories of drug concentration, such as "good", "mid", and "bad", along with pointers indicating specific concentration levels. The dashboard is built with HTML, CSS, and JavaScript, aiming to provide a clear and interactive visualization tool for drug concentration analysis.
- Dynamic Range Visualization: Easily display drug concentration ranges with customizable colors for different categories.
- Pointer Indication: Indicate specific drug concentration levels with customizable pointers.
- Tooltip Information: Display detailed information about the concentration level on hover, including normal range and category.
- Responsive Design: Ensures the dashboard looks great on all devices.
To use the Linear Gauge component in your project, simply copy the HTML, CSS, and JavaScript code provided in this repository into your project files. There are no external dependencies required.
-
Include the Component in Your HTML: Add the
<div id="app" class="App"></div>element to your HTML file where you want the dashboard to appear. -
Initialize the Linear Gauge: Call the
DrugComponentfunction and assign its return value to theinnerHTMLof theappdiv. -
Customize the Linear gauge: Modify the
drugsarray in theDrugComponentfunction to include your specific drug concentration ranges and pointers.
The DrugComponent function accepts an array of drugs, each with its own ranges and pointers. Here's an example of how to define a drug with its ranges and pointers:
   const drugs = [
      {
         ranges: [
            { start: 0, end: 40, category: "bad" },
            { start: 40, end: 95, category: "mid" },
            { start: 95, end: 500, category: "good" },
            { start: 500, end: 650, category: "mid" },
            { start: 650, end: 800, category: "bad" },
         ],
         pointers: [
            {
               value: 350,
               color: "#948c92",
               rangeType: "Neutral",
               rangeTypeColor: "orange",
            },
            {
               value: 500,
               color: "#3b61bb",
               rangeType: "Healthy",
               rangeTypeColor: "#4cdfbb",
            },
            {
               value: 750,
               color: "",
               rangeType: "UNHEALTHY",
               rangeTypeColor: "red",
            },
         ],
      },
];Contributions are welcome! If you find a bug, want to suggest a new feature, or have any other inquiries, please open an issue. For contributions, please follow these steps:
- Fork the repository.
- Create your feature branch (
git checkout -b feature/YourFeature). - Commit your changes (
git commit -am 'Add some feature'). - Push to the branch (
git push origin feature/YourFeature). - Open a Pull Request.
This project is licensed under the MIT License. See the LICENSE file for details.
