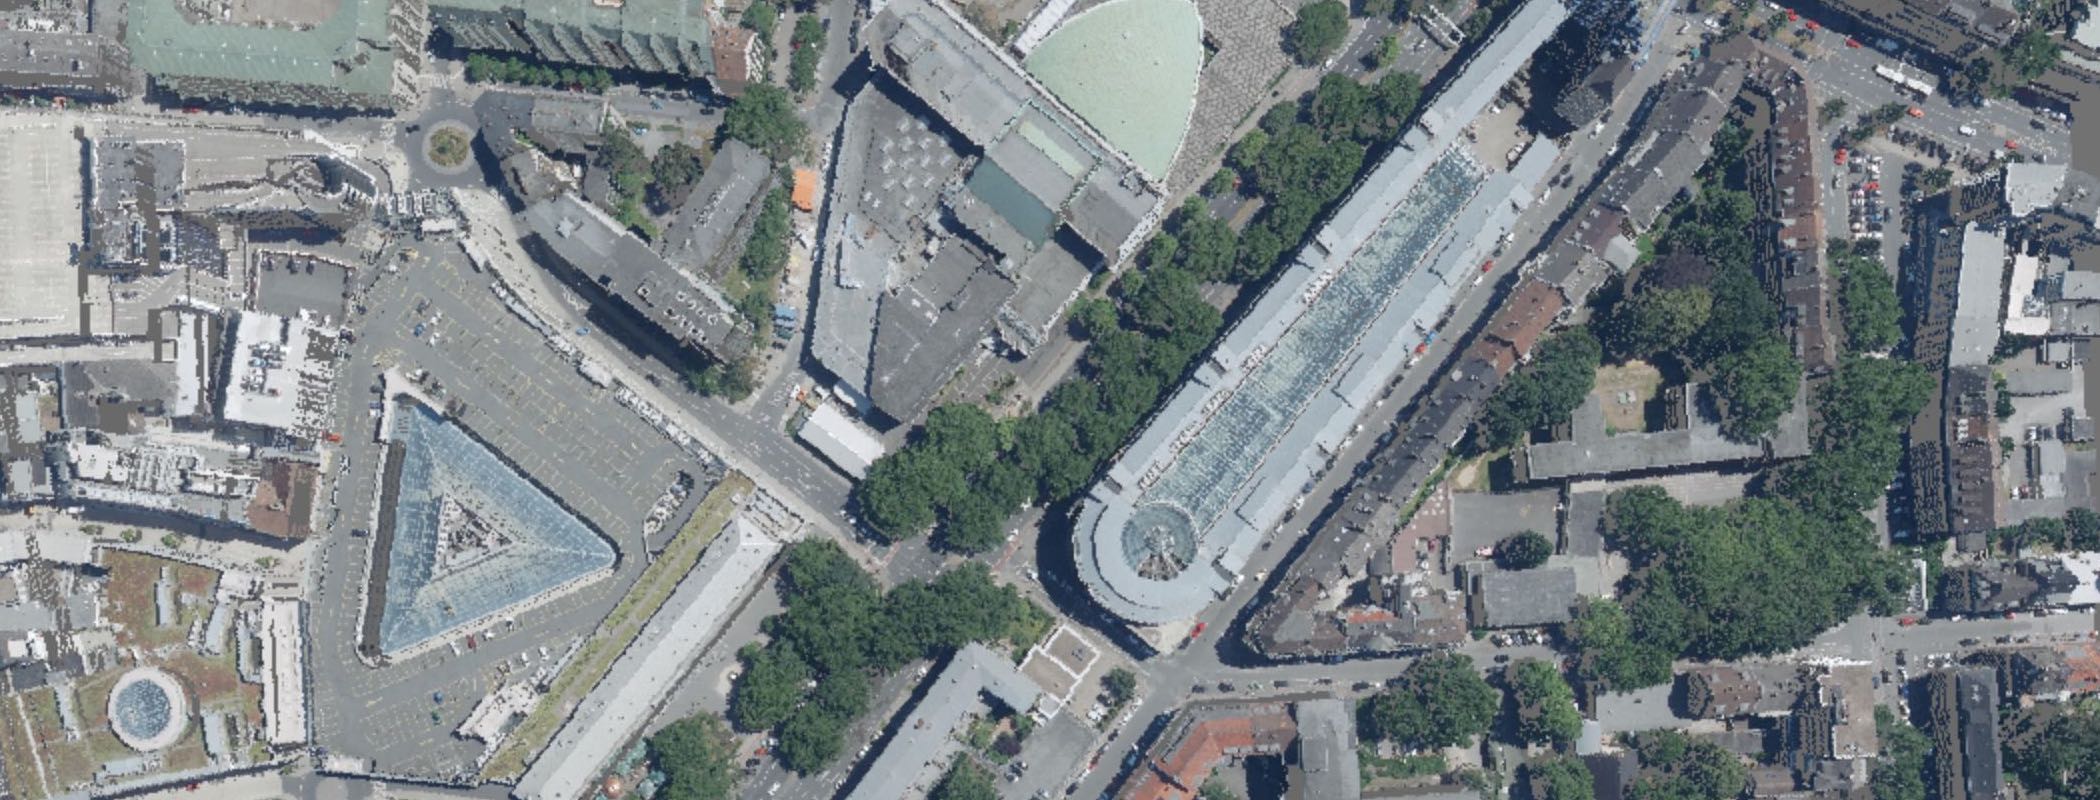
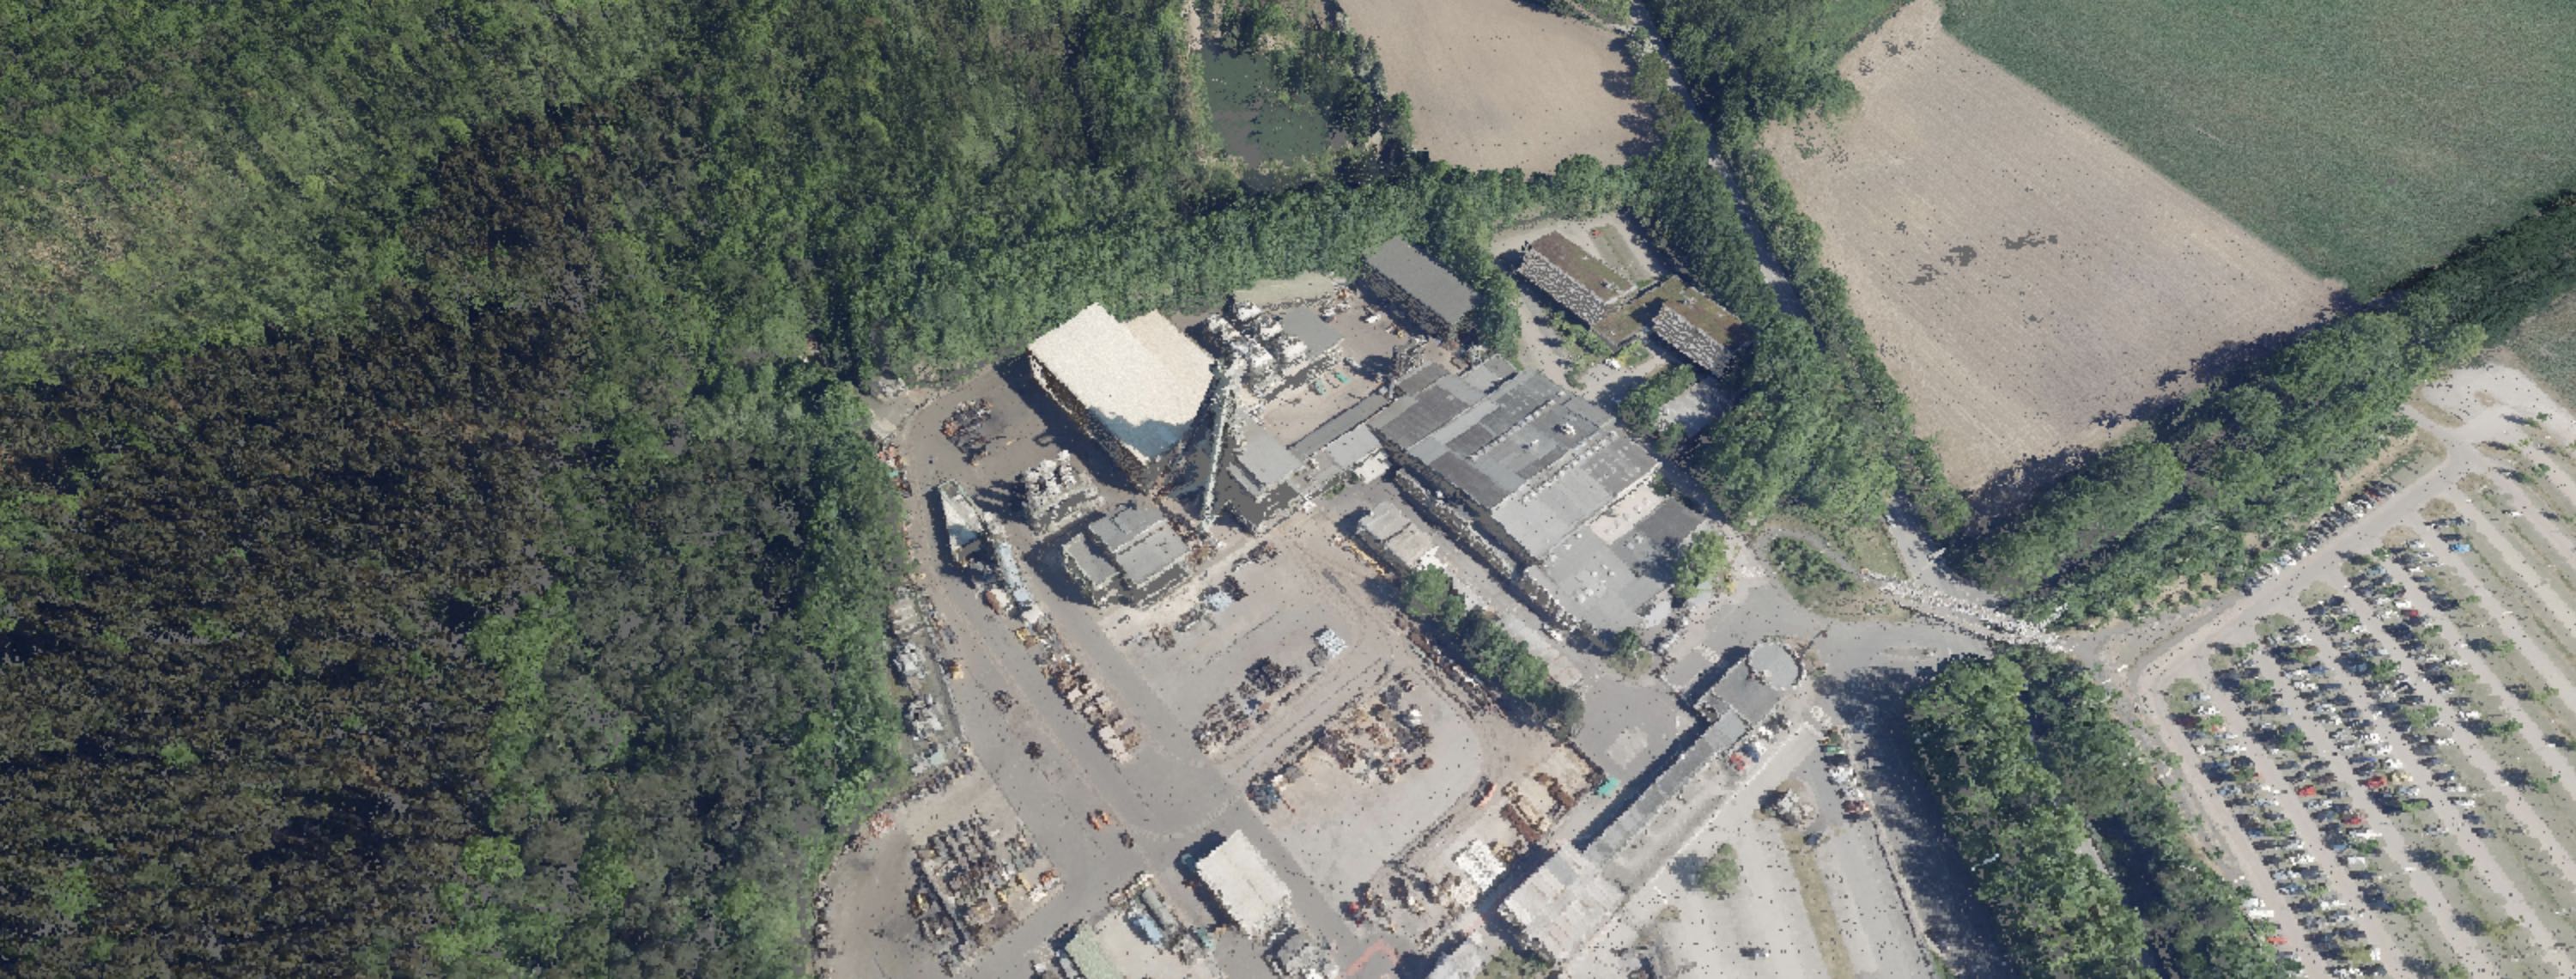
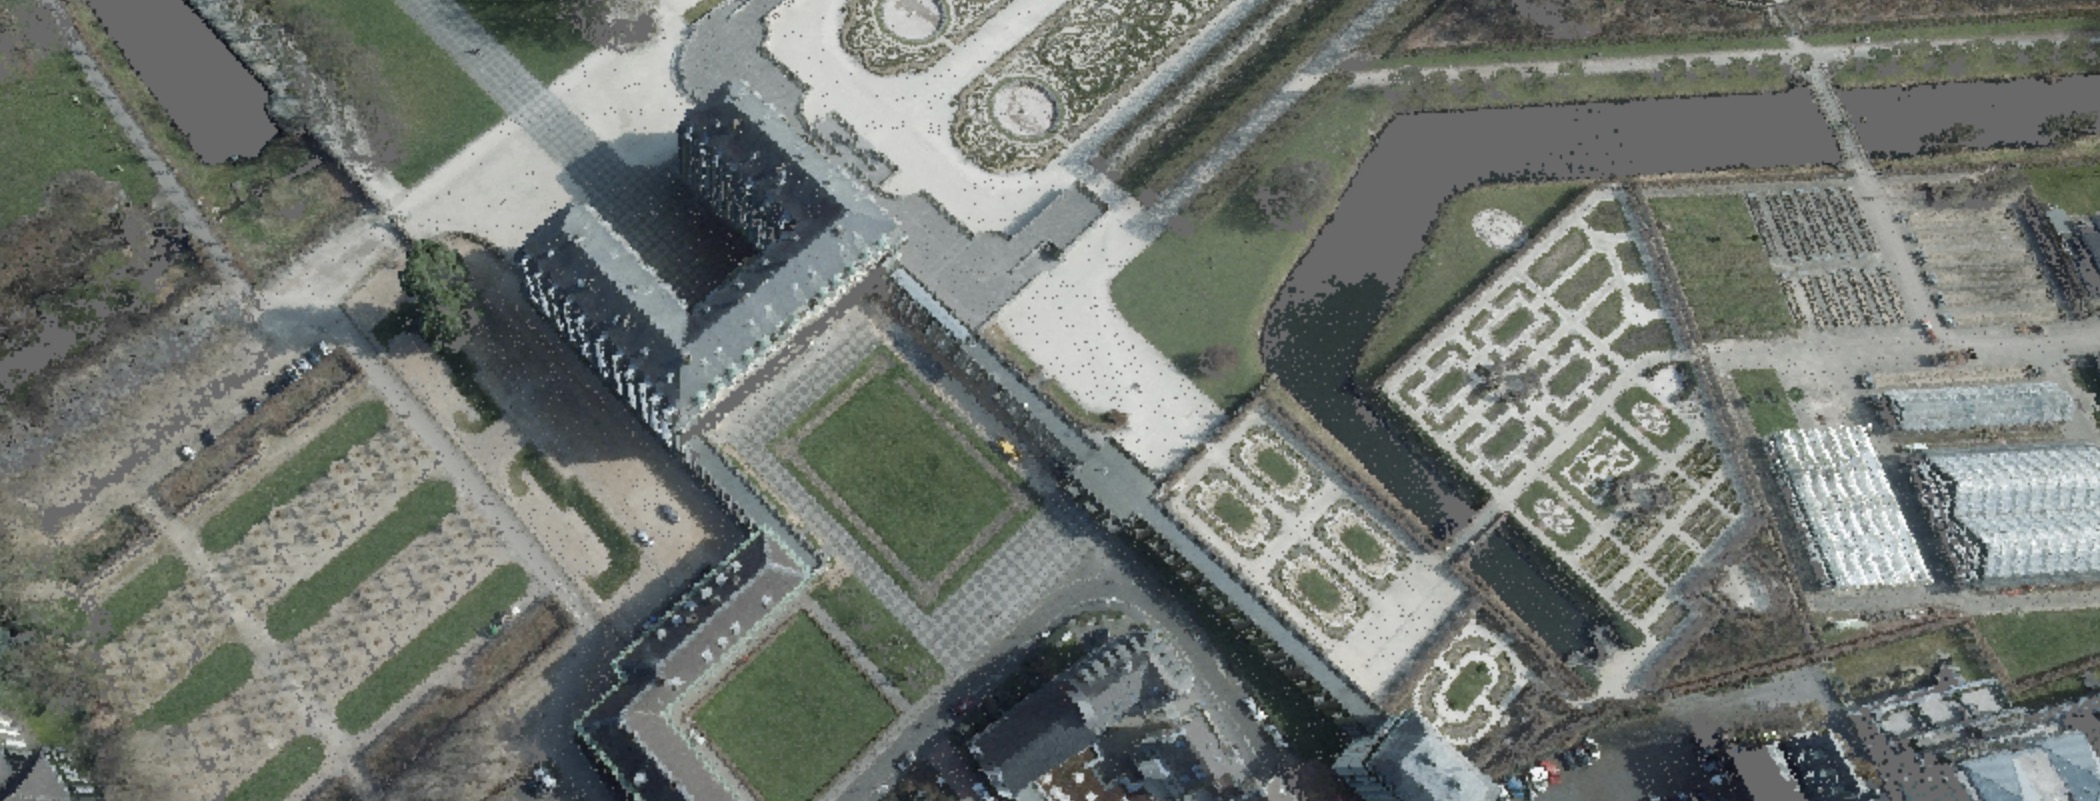
This is an interactive web visualisation of the German state of North Rhine-Westphalia's (NRW) open source Lidar data. I stumbled upon this data during my bachelors thesis and thought this'd be fun for everyone to see. This website was a lot more work than anticipated (what isn't?) and I haven't optimized it much beyond compressing the raw data. I hope you like it! If you have suggestions and/or like it feel free to contact me or leave a star.
Visit https://openlidar.io and type in your address to have a look at the colored Lidar data. Or take a 3D visit to Cologne, Dortmund, Düsseldorf or Essen. Or whatever place in NRW you like, really. See below for examples.
I processed ~6TB's of Lidar data and ~2TB's of orthographic images, split them into 50x50m tiles and mapped a color to each point. It took a while. The Website itself is relatively lean. The compressed xyz & color data is hosted on Backblaze B2 Cloud in Amsterdam (all other options would probably bankrupt me pretty soon). Depending on the coordinates, I fetch the corresponding tiles and visualize the points using threejs.
Keep in mind the data is not perfect:
- The images are not always from the date the LIDAR data is from, causing some structures to be photographed but not 3D-Scanned and vice versa.
- Both the Lidar data and the orthograpic images are collected from vertically above surface, which is why facades are missing.
- A couple of square kilometers of data are missing (your odds are ~0,03% of finding one, consider yourself lucky!). I will fix this in the future.
All data is provided under the dl-de/by-2.0 license by Land NRW (2020) and can be found on the Opengeodata.NRW Platform.


