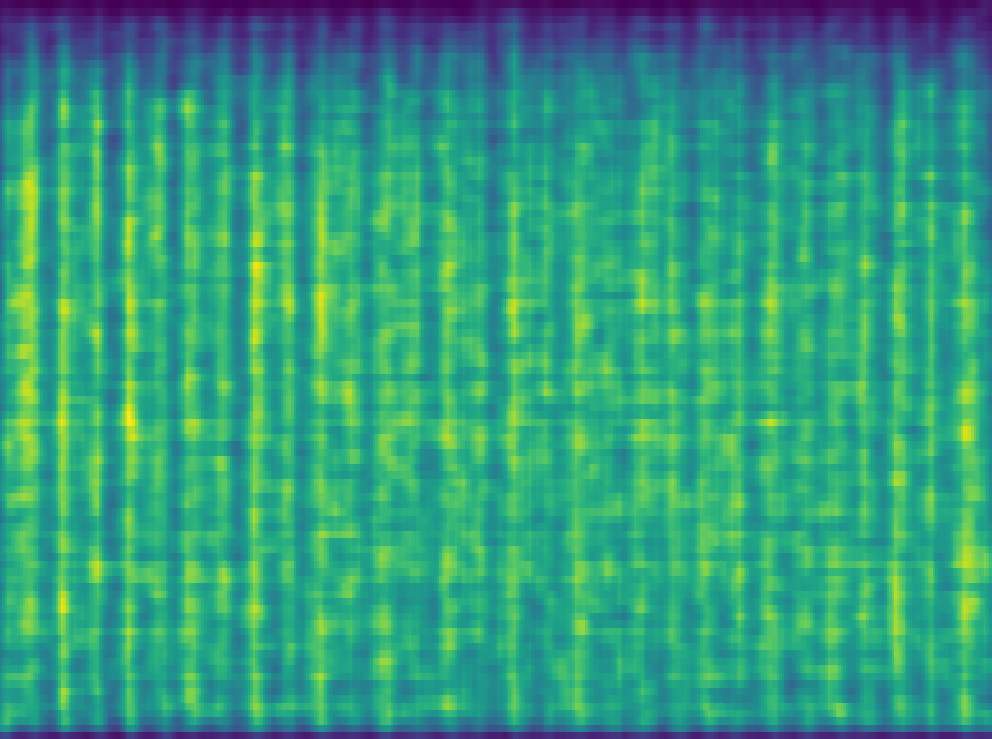
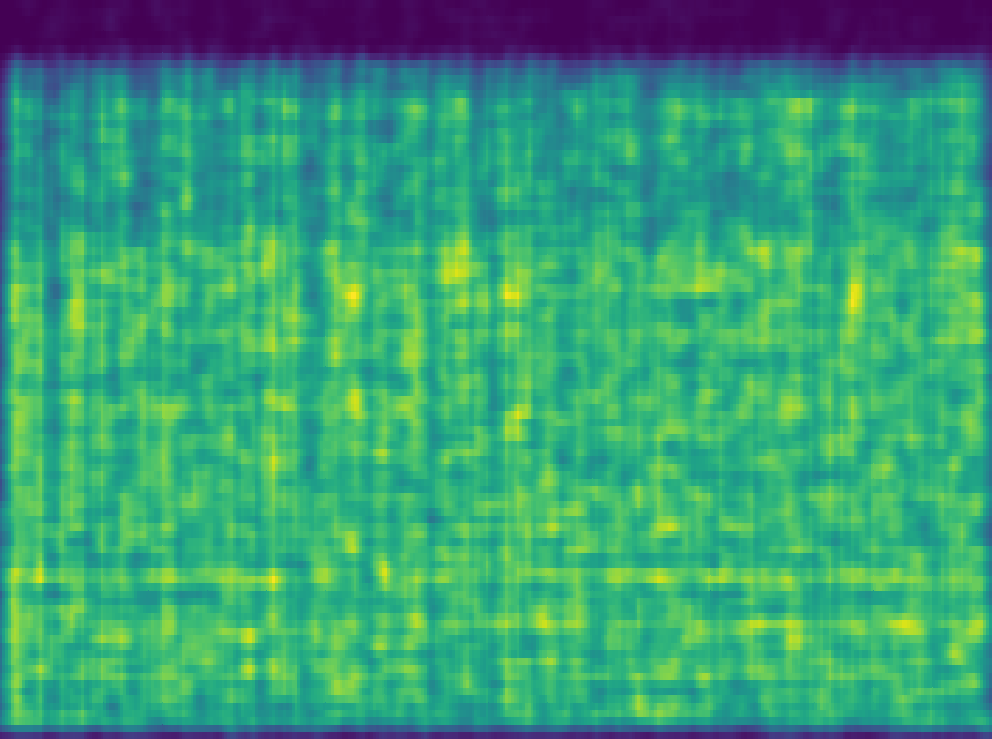
This project aims to classify electronic music. It uses libraries like librosa, sci-kit image and sci-kit learn to collect data and form models that represent songs. Currently, a Kernel Density Estimator is used to represent a genre:
| House | Electro | Drum and Bass |
|---|---|---|
 |
 |
 |
TODO: add setup.py script
First, clone the repository and install all dependencies. To start training you must have some songs of the same genre stored in a folder like: audio/housePlaylist
Oolong's main driver is train.py
positional arguments:
    genre            classifier to train a model for
optional arguments:
    -h, --help       show this help message and exit
    -l, --load       perform analysis on the input folder
    -t, --train      train a density model on the database
Analyzying songs:
Usage: train.py genre --load folder
Running this example will create a database named with the folder name and a timestamp. Oolong will now start begin analyzing the songs in order and populate the database with their results.
This process can take a while depending on the amount of songs you are scanning in. Each song takes ~20 seconds. Each song will fill the nested class structure found in song_classes.py. The output database will be a collection of songs stored in JSON format.
Training a density model for a genre:
Usage: train.py genre --train db_path
Running this example will read in from the database JSON. Oolong will now generate a Kernel Density Estimator and display it back to the user.
Data that is larger than the average size of a song (in frames) will be thrown away. For the density calculation, a fixed x and y size is required. This is one of the core issues of this approach and is talked about in detail below.
Wait? A Kernel Density What?
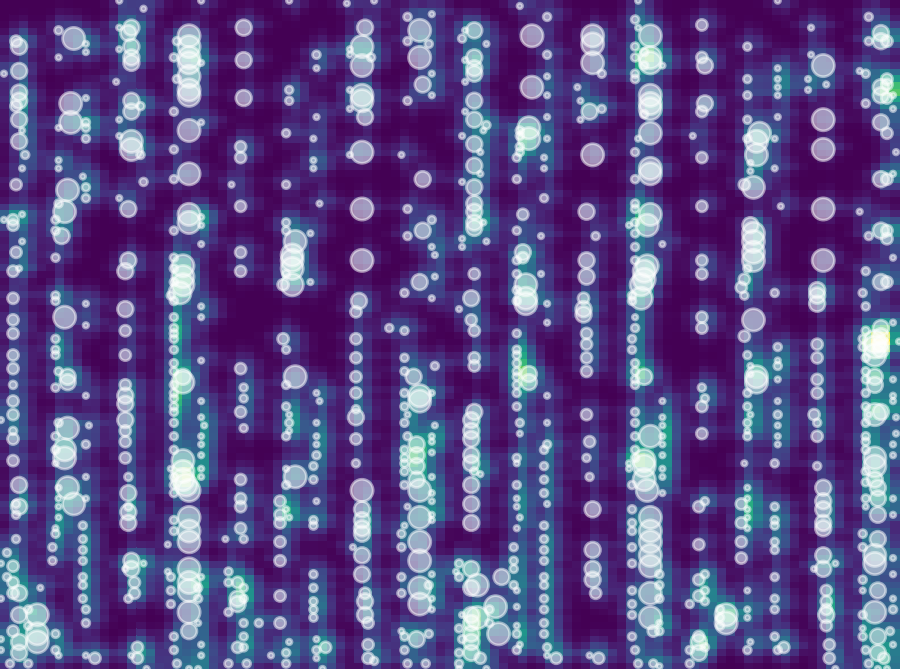
A Kernel Density Estimator can be seen as a heatmap of scatterplot data. It is most comparable to a histogram in that it has bins to seperate data - however, it's goal is to not only model
 |
| This is a density model created from the features of a single song. Visually, you can see 'bins' of data forming for each kick snare pattern. |
The idea is that if we combine the features of every single song's most significant segement, the output density model will be representative of the entire genre.
