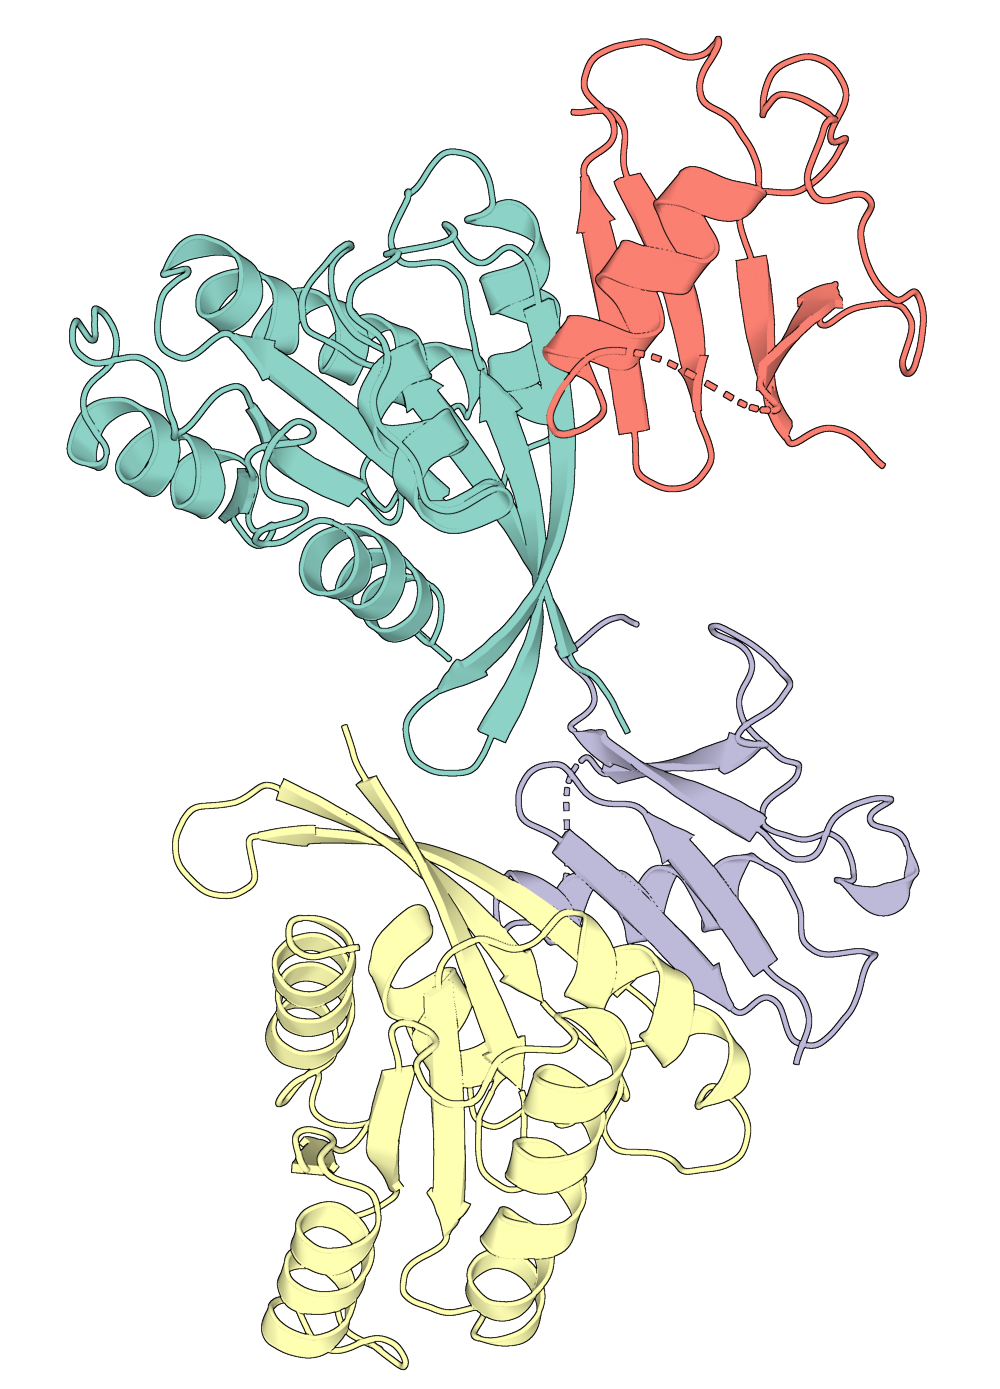
Portein plots 3D proteins according to their best 2D projection (best = greatest area visible), allowing for easy automation of protein visualization.
import prody as pd
import portein
import matplotlib.pyplot as plt
import numpy as np
import yaml
import warnings
warnings.filterwarnings('ignore')
portein.compile_numba_functions()Portein uses some linear algebra (for Optimal rotation of 3D model for 2D projection and Rotating an object to maximize bounding box height) to find the best 2D projection for the input protein's 3D coordinates.
Example orientation:
pdb = pd.parsePDB("7lc2")
old_coords = pdb.select("protein and calpha").getCoords()

# Rotate the protein
pdb_oriented = portein.rotate_protein(pdb)
pd.writePDB("examples/7lc2_rotated.pdb", pdb_oriented)
new_coords = pdb_oriented.select("protein and calpha").getCoords()

# Find the best size of the plot based on the coordinates and a given height (or width)
old_width, old_height = portein.find_size(old_coords, height=5)
new_width, new_height = portein.find_size(new_coords, height=5)

fig, ax = plt.subplots(1, 2, figsize=(old_width + new_width, new_height), gridspec_kw={"width_ratios": [old_width, new_width]})
ax[0].plot(old_coords[:, 0], old_coords[:, 1], "-", c="black")
ax[0].scatter(old_coords[:, 0], old_coords[:, 1], c=np.arange(old_coords.shape[0]), s=50, cmap="Blues", edgecolors="gray")
ax[1].plot(new_coords[:, 0], new_coords[:, 1], "-", c="black")
ax[1].scatter(new_coords[:, 0], new_coords[:, 1], c=np.arange(new_coords.shape[0]), s=50, cmap="Blues", edgecolors="gray")
ax[0].set_title("Before rotation", fontsize=20)
ax[1].set_title("After rotation", fontsize=20)
ax[0].axis("off")
ax[1].axis("off")
plt.tight_layout()
You can save an oriented version of your protein from the command line as follows:
portein rotate 7lc2Requires: pymol
Automatically layer different Pymol representations on top of each other, each one ray-traced separately and then combined with user-defined transparencies. All variables that can be set in Pymol can be passed to the PymolConfig object.
# Using some default nice PyMOL settings
with open("configs/pymol_settings.yaml") as f:
    pymol_settings = yaml.safe_load(f)
pymol_settings
{'ambient': 0.5,
'antialias': 2,
'cartoon_discrete_colors': True,
'cartoon_fancy_helices': True,
'cartoon_sampling': 20,
'depth_cue': False,
'hash_max': 300,
'light_count': 1,
'ray_opaque_background': False,
'ray_shadows': False,
'ray_texture': 0,
'ray_trace_disco_factor': 1,
'ray_trace_fog': False,
'ray_trace_gain': 0,
'ray_trace_mode': 1,
'specular': False,
'surface_quality': 2}
# Rotate the protein, set the width of the plot (height is auto-calculated), and the colormap for the chains (can also be a dictionary of chain: color)
protein_config = portein.ProteinConfig(pdb_file="7lc2", rotate=True, width=1000, chain_colormap="Set3", output_prefix="examples/7lc2_simple")
pymol_class = portein.Pymol(protein=protein_config,
                            # Single layer of cartoon representation
                            layers=[portein.PymolConfig(representation="cartoon", pymol_settings=pymol_settings)])

# Run PyMOL
image_file = pymol_class.run()
Ray: render time: 4.11 sec. = 876.9 frames/hour (7.92 sec. accum.).
To do this from the command line, you need a YAML file with info about the protein:
pdb_file: 7lc2
rotate: true
width: 1000
chain_colormap: Set3
output_prefix: examples/7lc2_simple
And then:
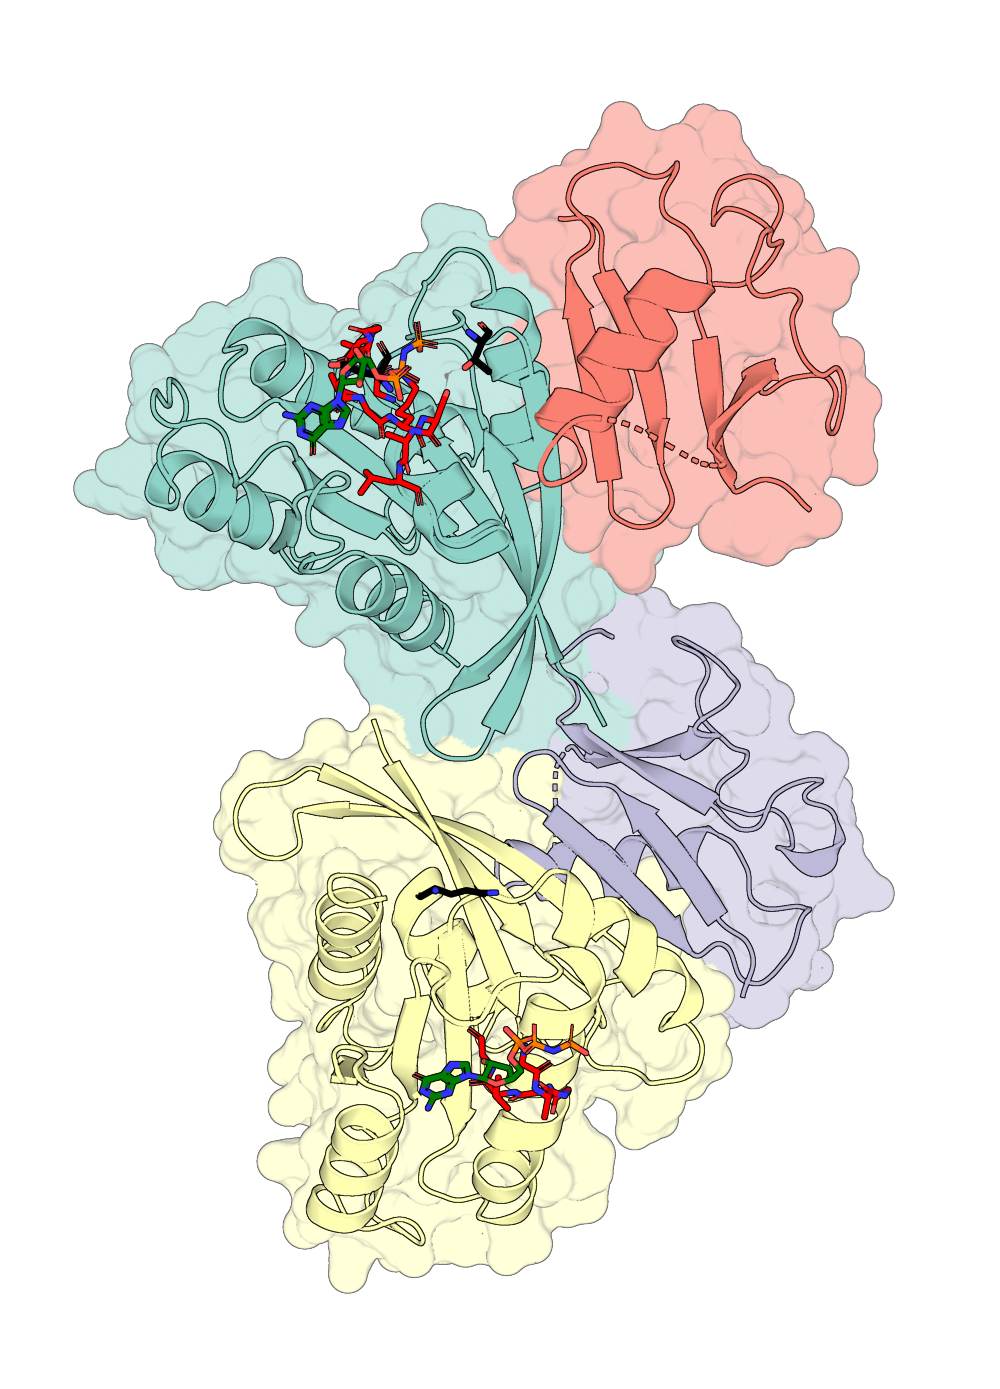
portein pymol examples/protein_example_simple.yamlHere's a fancier version with four layers:
- Layer 1 is surface at 0.5 opacity
- Layer 2 is cartoon
- Layer 3 has only some residues displayed as sticks, set by the
selection="highlight"inPymolRepresentationConfigandhighlight_residuesinProteinConfig. - Layer 4 shows a ligand as sticks in green
The selection attribute can also be any kind of Pymol selection ("all" by default)
protein_config = portein.ProteinConfig(pdb_file="7lc2", rotate=True, output_prefix="examples/7lc2",
                                       chain_colormap="Set3",
                                       highlight_residues={"A": {"black": [30, 35], "red": list(range(10,20))},
                                                           "B": {"black": [25], "red": list(range(10, 16))}},
                                       width=1000)
layers = [portein.PymolConfig(representation="surface", pymol_settings=pymol_settings, transparency=0.5),
          portein.PymolConfig(representation="cartoon", pymol_settings=pymol_settings),
          portein.PymolConfig(representation="sticks", pymol_settings=pymol_settings, selection="highlight"),
          portein.PymolConfig(representation="sticks", pymol_settings=pymol_settings, selection="resn GNP", color="green")]

pymol_class = portein.Pymol(protein=protein_config, layers=layers, buffer=10)
image_file = pymol_class.run()
Ray: render time: 11.48 sec. = 313.6 frames/hour (55.84 sec. accum.).
Ray: render time: 3.12 sec. = 1155.5 frames/hour (62.12 sec. accum.).
Ray: render time: 0.31 sec. = 11764.9 frames/hour (62.73 sec. accum.).
Ray: render time: 0.30 sec. = 12119.1 frames/hour (63.33 sec. accum.).
This can also be achieved from the command line using YAML config files
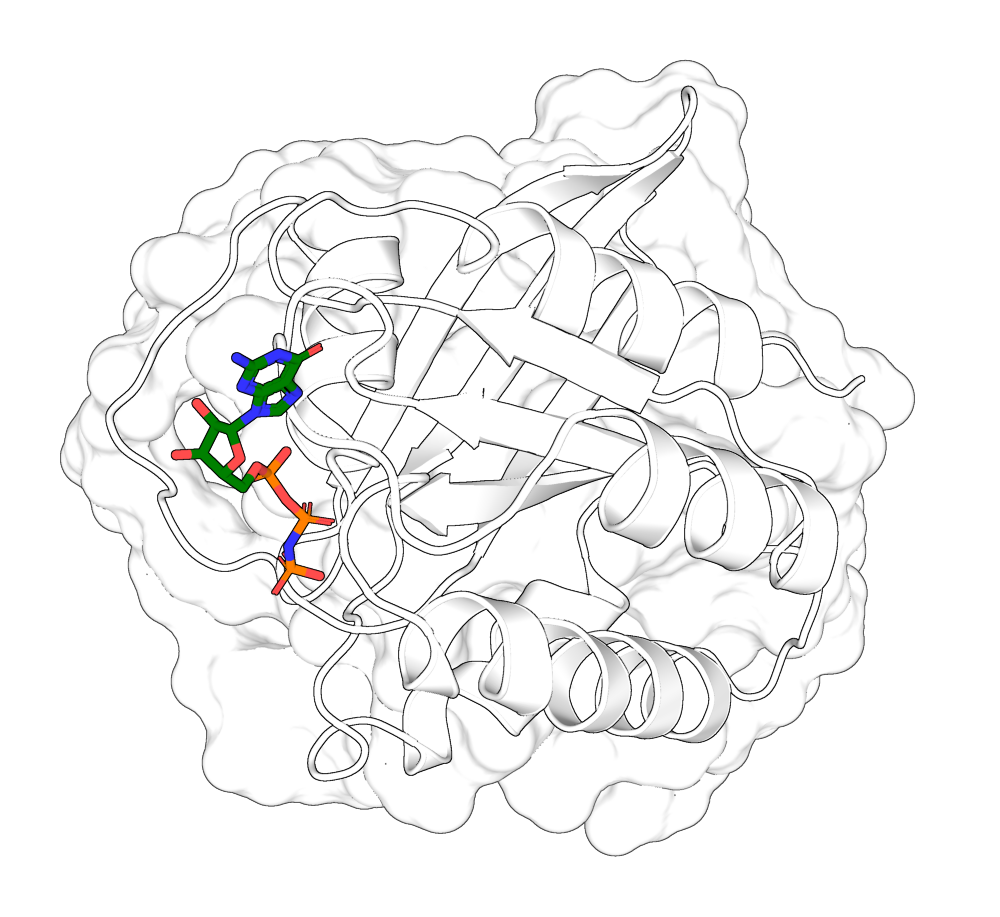
portein pymol examples/protein_example.yaml examples/pymol_layers_example.yaml --buffer 10Here's an example of zooming into a ligand pocket:
pdb = pd.parsePDB("7lc2")

ligand_pocket = pdb.select("within 6 of (chain A and resname GNP)")
prox_chains = ligand_pocket.getChids()
ligand_pocket_coords = ligand_pocket.getCoords()

# Get best rotation:
matrix = portein.get_best_transformation(ligand_pocket_coords)

# Apply the transformation to the protein
pdb_oriented = pd.applyTransformation(pd.Transformation(matrix), pdb)
pd.writePDB("examples/7lc2_rotated_ligand.pdb", pdb_oriented.select(" or ".join([f"chain {chain}" for chain in prox_chains])))

protein_config = portein.ProteinConfig(pdb_file="examples/7lc2_rotated_ligand.pdb", rotate=False, output_prefix="examples/7lc2_ligand",
                                       chain_colormap="white",
                                       width=1000)
layers = [portein.PymolConfig(representation="surface", pymol_settings=pymol_settings, transparency=0.3),
          portein.PymolConfig(representation="cartoon", pymol_settings=pymol_settings),
          portein.PymolConfig(representation="sticks", pymol_settings=pymol_settings, selection="(chain A and resn GNP)", color="green")]

pymol_class = portein.Pymol(protein=protein_config, layers=layers)
image_file = pymol_class.run()
Ray: render time: 5.01 sec. = 718.2 frames/hour (82.49 sec. accum.).
Ray: render time: 1.85 sec. = 1941.8 frames/hour (86.32 sec. accum.).
Ray: render time: 0.19 sec. = 19317.6 frames/hour (86.69 sec. accum.).
Requires: illustrate, convert
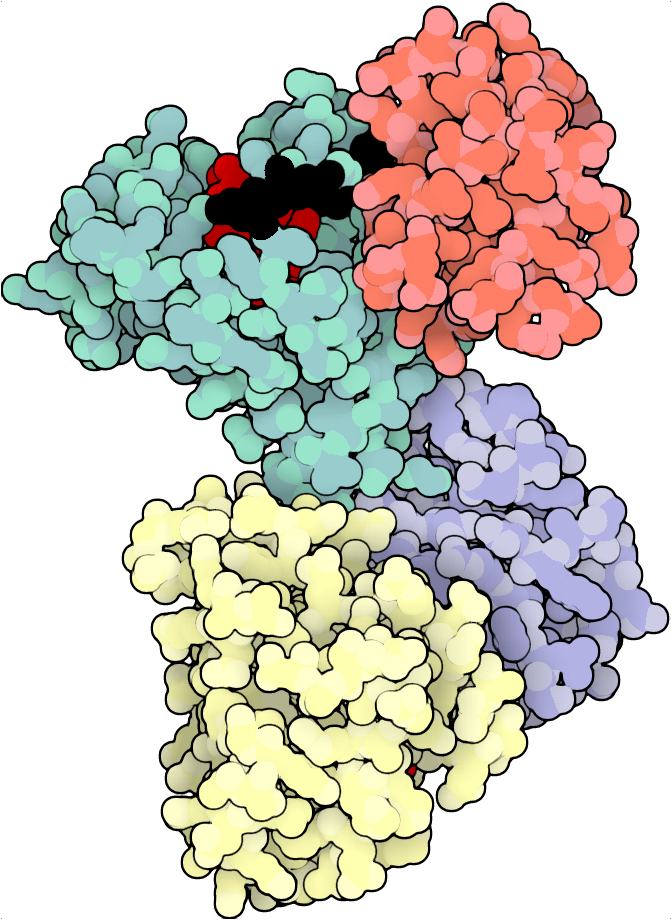
Uses David Goodsell's illustrate to generate images. All illustrate parameters are user-definable.
protein_config = portein.ProteinConfig(pdb_file="7lc2", rotate=True, output_prefix="examples/7lc2",
                                       chain_colormap="Set3",
                                       highlight_residues={"A": {"black": [30, 35], "red": list(range(10,20))},
                                                           "B": {"black": [25], "red": list(range(10, 16))}},
                                       width=1000)

illustrate = portein.Illustrate(protein_config=protein_config, illustrate_config=portein.IllustrateConfig())
image_file = illustrate.run()
From the command line:
portein illustrate examples/protein_example.yamlYou can pass the illustrate config file as the second argument (See configs/illustrate.yamlfor defaults)
Requires: mkdssp
This runs DSSP to split the protein into its secondary structural elements (SSE) and then uses the start and end coordinates of each SSE to plot (adapted from this gist)
- helices as waves or cylinders (controlled by
HelixConfig.as_cylinder) - beta sheets as arrows
- turns as arcs with circles at the ends
See the configs folder for parameter settings available for each plot type.
protein_config = portein.ProteinConfig(pdb_file="7lc2", rotate=True, width=1000, output_prefix="examples/7lc2")
ss = portein.SecondaryStructure(protein_config=protein_config,
                                helix_config=portein.HelixConfig(),
                                sheet_config=portein.SheetConfig(),
                                turn_config=portein.TurnConfig(),
                                dpi=100)
ss.run()
And from the command line:
portein secondary 7lc2Use -h, -s and -t to pass helix, turn, and sheet config files
Modify the figure e.g to highlight specific residues using the returned Axes object:
ax = ss.run()
ax.set_title("Portrait of PDB ID: 7lc2", fontsize=20)
highlight_residues = [30, 35, 25, 10, 11, 12, 13, 14, 15]
ax.scatter(ss.coords[highlight_residues, 0],
           ss.coords[highlight_residues, 1],
           color="red", s=100,
           edgecolor="black", linewidth=2)
Plot as a linear secondary structure diagram:
fig, ax = plt.subplots(1, figsize=(50, 1))
ss.run(ax=ax, linear=True)


