A complete machine learning data pipeline for training TensorFlow models to forecast stock prices. Written in Python.
Goal: given stock data (opening, closing and indicators), predict next day's adjusted closing price
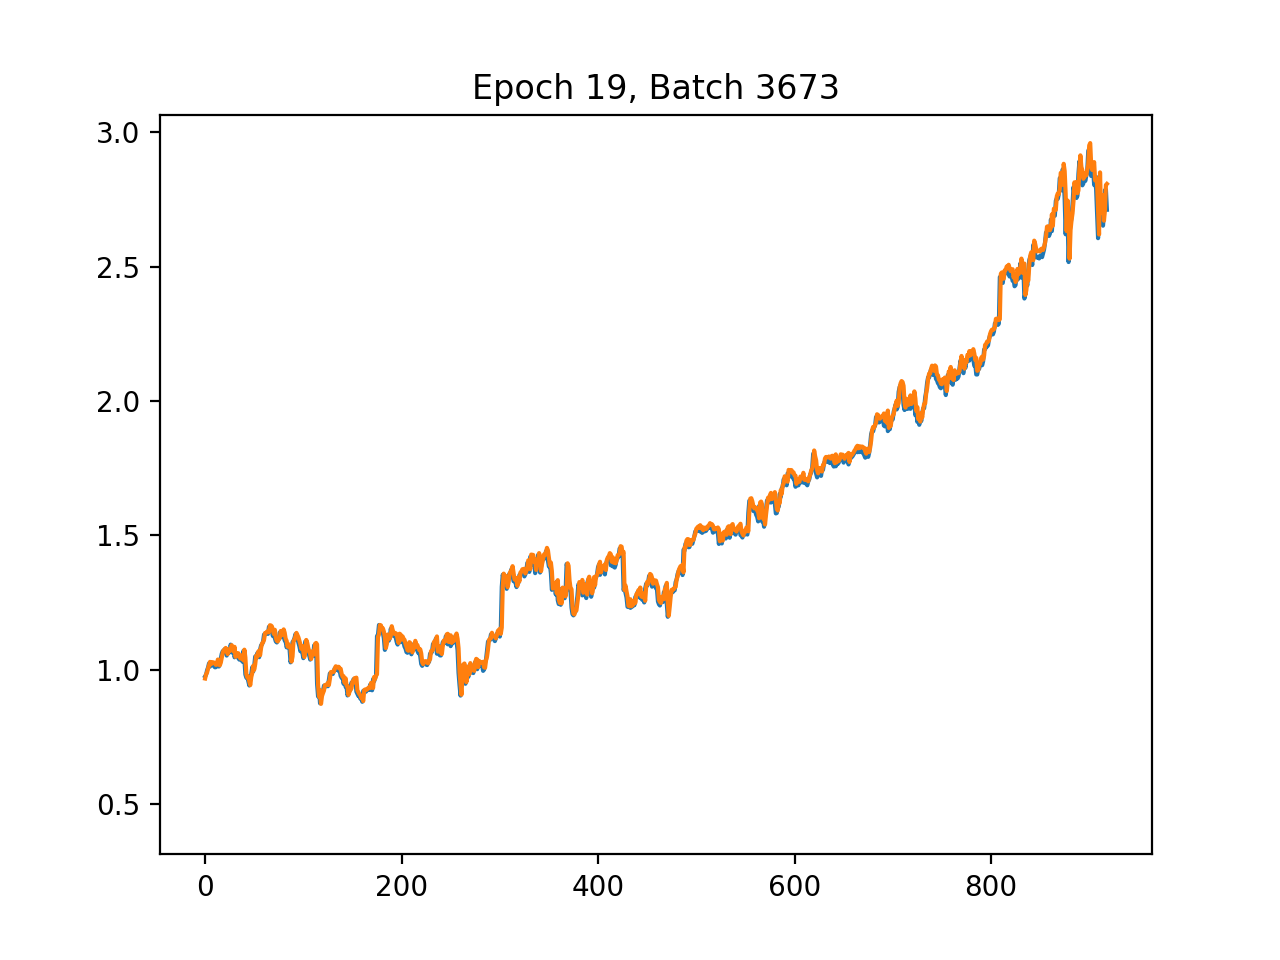
Predictions for MSFT:
Mean Relative error: 11.53%
Orange line: predictions
Blue line: actual
First, make sure dependencies are installed:
$ pip install -r requirements.txtThe pipeline is outlined in scripts/run.py. To run the complete pipeline to train a neural network model for each stock (i.e. fetch, preprocess, train, evaluate), run:
$ python scripts/run.py -f -p -nn-f, --fetch: run the data fetch job, which fetches stock data and financial indicators for each stock symbol, joins them together, then saves the data to a csv file in output/raw
-p, --preprocess: run the preprocessing job. Data must already exist in output/raw. This job creates the label dimension and shifts it one day down. It then splits the data into 80% training and 20% testing sets. After that, a last observed carried forward procedure is performed to fill in the missing data. Finally, a scikit-learn MinMaxScaler is applied to each column to scale the dataset.
-nn, --neuralnetwork: trains a neural network model for each stock using TensorFlow. Then runs a simply evaluation on the test set to calculate the relative error. Models are saved in output/models
--evalnn: runs evaluation using the test data set. Gives MSE and relative error.
The pipeline consists of the following stages
- Data fetching from AlphaVantage stock quotes API
- Data preprocessing - splitting, scaling/normalization, last observed carried forward and shifting
- Training various supervised learning models, a separate model is trained for each stock
- Neural Networks
- AdaBoost regressors
- Gradient boosting regressors
- Random forest regressors
- Model evaluation - loss and relative error
the stock data for S&P 500 companies includes the daily adjusted time series data as well as 51 financial indicators. The adjusted closing is used as the label and shifted one day down.
Neural Networks
A TensorFlow 5 layer Neural Network is used. The 3 hidden layers have 64, 32 and 16 neurons respectively to better fit the input dimensions. Rectified Linear Units are used as activation functions. The Mean Squared Error is used as the loss function and the AdamOptimizer is used to compute the gradients.
Boosting Regressor
Random Forest Regressor
- Sentiment analysis on Twitter and news
