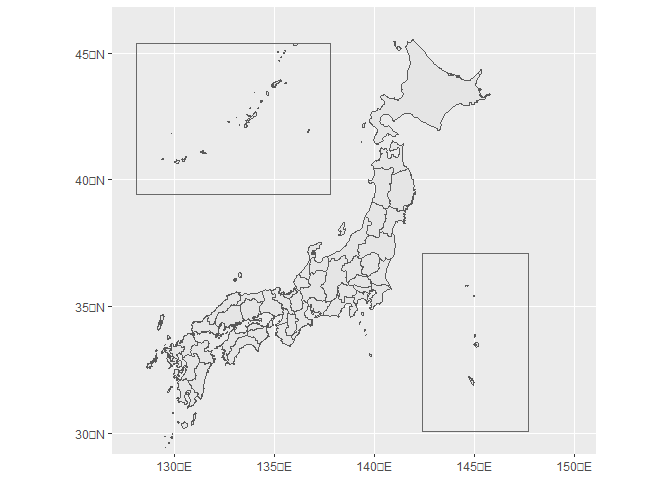
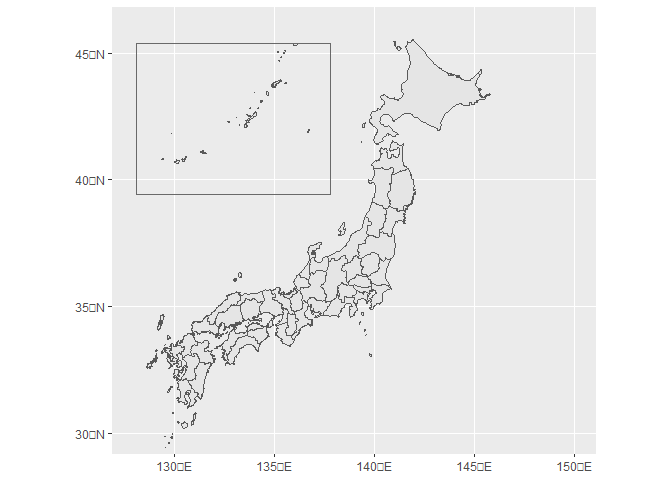
jpmap provides geometry data of Japanese prefectures and layout functions in ggplot2. The prefecture data in jpmap is based on the data provided by mapdata package.
You can install the development version of jpmap from GitHub with:
# install.packages("devtools")
devtools::install_github("UchidaMizuki/jpmap")prefecture contains geometry (sf) data of Japanese prefectures.
library(jpmap)
library(tidyverse)
library(sf)

prefecture
#> Simple feature collection with 47 features and 3 fields
#> Geometry type: MULTIPOLYGON
#> Dimension:     XY
#> Bounding box:  xmin: 122.9382 ymin: 24.2121 xmax: 153.9856 ymax: 45.52041
#> Geodetic CRS:  JGD2011
#> # A tibble: 47 × 4
#>    pref_code pref_name pref_name_ja                                     geometry
#>        <int> <chr>     <chr>                                  <MULTIPOLYGON [°]>
#>  1         1 Hokkaido  北海道       (((143.8965 44.15815, 143.9118 44.15229, 14…
#>  2         2 Aomori    青森県       (((139.9438 40.42928, 139.9426 40.43439, 13…
#>  3         3 Iwate     岩手県       (((141.681 40.45101, 141.6909 40.44229, 141…
#>  4         4 Miyagi    宮城県       (((141.6403 38.9675, 141.6406 38.9652, 141.…
#>  5         5 Akita     秋田県       (((139.8809 39.11511, 139.8919 39.13321, 13…
#>  6         6 Yamagata  山形県       (((139.5487 38.545, 139.5801 38.60688, 139.…
#>  7         7 Fukushima 福島県       (((140.9332 37.8898, 140.9334 37.88923, 140…
#>  8         8 Ibaraki   茨城県       (((140.7973 36.84649, 140.7931 36.83755, 14…
#>  9         9 Tochigi   栃木県       (((139.6537 36.20314, 139.6385 36.22575, 13…
#> 10        10 Gunma     群馬県       (((138.6795 36.73065, 138.7227 36.74918, 13…
#> # … with 37 more rows
layout_japan() improves the layout of the Japanese islands in ggplot2
plots.
plot <- ggplot(prefecture) +
  geom_sf()

plotlayout_japan(plot)layout_japan(plot,
ogasawara = FALSE)data <- prefecture |>
expand_grid(group = 1:2) |>
st_as_sf() |>
mutate(fill = case_when(group == 1 ~ pref_code,
group == 2 ~ 47L - pref_code + 1L))
plot <- ggplot(data,
aes(fill = fill)) +
geom_sf(color = "transparent") +
scale_fill_viridis_c(option = "turbo") +
facet_wrap(~ group)
layout_japan(plot) +
theme(legend.position = "bottom")


