Media Transparency Database Visualization
188.943 Praktikum aus Visual Computing
Abstract
The "media transparency database" contains the accumulated amount of money spent by governmental organizations on media companies. This data can be explored as a multimodal dynamic network. Existing web projects already present solutions to visualize the dataset, but to analyse the data further a user needs more interaction methods. This project implements a task-tailored dashboard with multiple connected views, which implements brushing and linking to enable the user to analyse the dataset in an easy to use matter.
Related Work
The "media transparency database" is available since the third quarter of 2012. Since then several visualizations got presented:
- [F. Lang] presents a visualization that uses grouping of the media entities to reduce the screen space and complexity of the visualization. It only uses one quarter of one year of the total data. It is possible to interact with the visualization and ungroup the media entities.
- [M. Hametner] presents a static visualization with bar charts and a line plot as a visualization for time oriented data by the Austrian newspaper “Der Standard”.
- [M. Schrempf] implemented a force-directed node link diagram. The user of this visualization is able to interact with the data and filter it with different queries. But the force-directed node link diagram was too slow for the huge database.
- [P. Salhofer et. al] implemented a website to get an overview of the media dataset. It features multiple visualizations which are all interactive but not connected to one dashboard.
The first two visualizations are presentations of an analysis of the data. But the last two approaches are visualizations that support the user to analyze and investigate into the data. The force directed node link diagram has the problem that it is too slow to render a nice overview of the dynamic network. Additionally it is hard to interpret the payment flow, because it is visually encoded in the size of the nodes of the diagram.
The visualization of [P. Salhofer et. al] is stable, easy and fast to interact. But the visualizations are distributed onto 4 different web pages, which makes it hard to combine the insight of the user from one visualization with the others. Additionally the payment flow visualization is restricted to only 800 relations.
Technologies
The following technologies are used:
- JavaScript: a script language to create dynamic client side webpage.
- Data-Driven Documents: A JavaScript library for manipulating documents based on data.
- jQuery: A fast, small, and feature-rich JavaScript library.
- Bootstrap: A framework for developing responsive, mobile first projects on the web.
- Brunch: A node.js build tool to compile scripts and styles and to concatenate scripts and styles.
- clean-css: Is a node.js library for minifying CSS files.
- uglify-js: Is a node.js library for minifying JavaScript files.
- crossfilter: Is a JavaScript library to explore multivariate datasets with coordinated views.
- DC: Is a JavaScript library with native crossfilter support to create charts for multidimensional data exploration
- Git: Is used as version control system.
Problem Description
Governmental advertisement in media and sponsorships are a possible way to influence press opinion. Therefore, the Austrian parliament passed a law that made it mandatory for governmental organizations to disclose their expenses for advertisements in different media (TV, radio, print, as well as online).
This so-called "media transparency database" is made publicly available by the Austrian Regulatory Authority for Broadcasting and Telecommunications (RTR) via the Austrian open government data portal.
It contains the accumulated amount of money transferred in a certain quarter of the year for each governmental organization and media company. This database can be explored as a multimodal dynamic network.
Data Structure
The media transparency database is structured as a Table with each row containing a relation from one governmental organization (Rechtsträger) to one media company (Medium). This relation contains the amount of transfered money (Euro), the quarter of the year (Jahr Quartal) and the law of the reason of the payment (Gesetz).
The table contains over 145000 entries over 12 quarters. So that one quarter contains 13000 data entries. There are over 1000 governmental organizations and media companies.
The data quality of the database is not sufficient enough for some data entries. These entries include spelling mistakes or are just differently formated.
Examples
Dashboard
(Click on the image to go the the video)
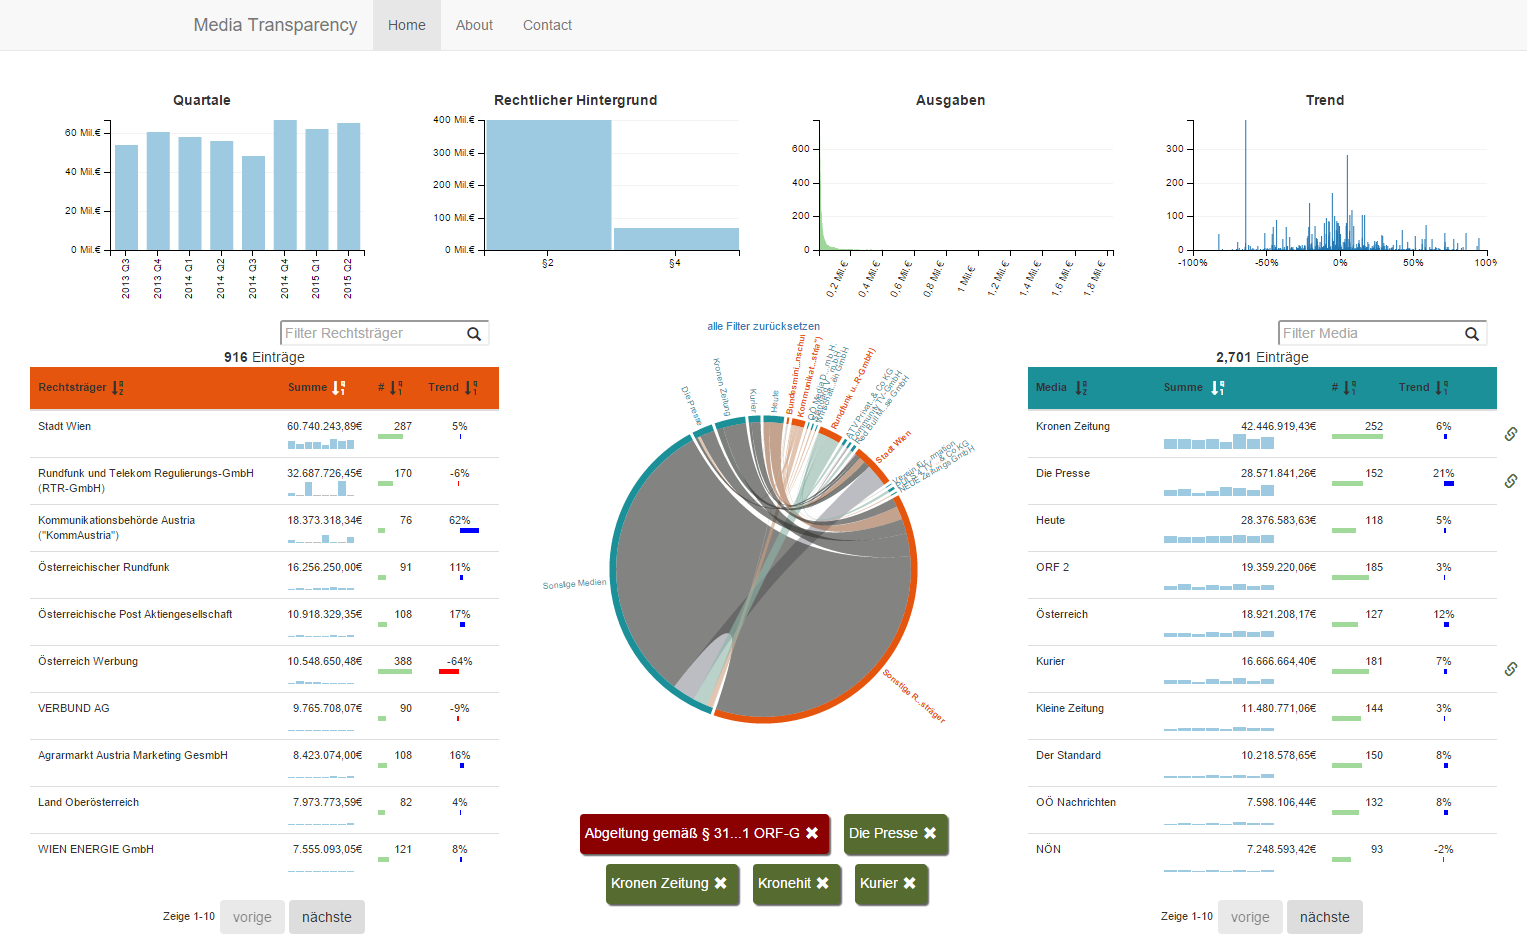
Filters


Flow Visualization

Details


Source Code Documentation
Install
The release build from the last tag is in the subfolder public. Copy it onto a webserver and it should work. Or visit my server
This project depends on Brunch. Install it with for example node.js. All depending libraries should be managed by brunch. If something is missing you have to install it manually with node.js.
- install node.js
- install brunch globally:
npm install -g brunch
- install local packages (if necessary):
npm install --save-dev brunch javascript-brunch css-brunch sass-brunch queue-async
Run
develop standard run
brunch build
develop run with server
brunch watch --server
The standard port for the brunch server is 3333 (localhost:3333)
release build
brunch build --production
Documentation of global variables
The source code documentation of global variables is in a seperate file: application.js I created a documentation file with jsdoc it is in documentation/jsdoc or online on my server: https://pfahler.at/mtdb2/doc/
Structure
The source code of this project is in the subfolder app this folder is structured as follow:
assetsthe assets files that the project depends on. For example theindex.html, the csv data, the used fonts, ...stylesthe style files of the project. Currentlylessis used to translate the style files to a single css file. The filenames of the single files have to start with an_to be ignored by thebrunchcompiler. And in the filestructurethe single files are linked together.viewsThis folder contains the files that describe the dom structure of the view.about.jadecontains a documentation of the project in markdown codecharts.jadecontains the overall structure of the dashboardchordChart.jadecontains the structure of the chord chart: the tooltip and the chart itself.contact.jadecontains the contact information of the projectfilters.jadecontains the structure of the filters of the dashboard. For example the quartals bar chart, the legal background bar chart, ...nav.jadecontains the structure of the fixed navbartable.jadecontains the structure of the two table widgets (legal and media entities), their count widgets and includes the chordChart.jade between them.
application.jscontains the definition and documentation of all global variables.charts.jsinitializes the application.chordChart.jsinitializes the chord chart and implements the method for updating it.data.jsis responsible for initializing the data.- if a local storage is available it is used.
- also the combined objects from a previous session is restored.
dataparse.jsparses the media transparence database data.filterCharts.jsmethods for the initialization of the 4 filter charts.globalFunction.jsinitializes the global functions of the applicationlisteners.jsinitializes the listeners for tooltips or the table.dimensions.jsinitializes the dimensions and the grouping of the dimensions.matrixFactory.jscreates the matrix for the chord chart.tables.jsinitializes the tables and the functions for updating the tables
Tutorials
How to add a new Chart
-
Add a new dimension and group for a chart:
This is done in the file
dimensions.js:treeSourceDim = ndxLinks.dimension(function(d) {return +d.source}); groupedTreeDim = removeEmptyBins(treeSourceDim.group().reduce(addTotal,removeTotal,initTotal),filterOutEmptyTotal);Look at the crossfilter documentation for details.
-
Define where the chart should be:
In the subfolder
viewsthe structure of the dashboard is defined. Add the name of the new chart to the desired position. For example:filters.jade.row#my-treeMaps include treeMaps.jadeTo add a new row to the dashboard which includes a new jade file which defines a new chart. For example a tree map:
.col-sm-6 strong Rechtsträger a(href="javascript:legalTreeMap.filterAll();updateAll();",style="display: none;").reset reset .clearfix #legal-tree-map -
Initialize the chart:
It does not matter where you initialize it. For example in
charts.jsafter the initialization of the dimensions. If it is not a DC chart, dont forget to define an update method and a resize method inapplication.js. -
Calls on update:
If it is not a dc chart add the update call to the function
updateAllNonDCinglobalFunction.js. In every case add the rescale call torescaleAllinglobalFunction.js.