The goal of XploRer is to read, write, analyze and plot MTG (Multi-scale Tree Graph) files. These files describe the plant topology (i.e. structure) along with some attributes for each node (e.g. geometry, colors, state…).
The package is under intensive development and is in a very early version. The functions may heavily change from one version to another until a more stable version is released.
You can install the release version of XploRer from GitHub with:
# install.packages("devtools")
devtools::install_github("VEZY/XploRer")A more in-depth introduction is available in the introductory vignette from the getting started tab.
Specialized articles from the Articles tab describe the functionality in details.
Read a simple MTG file:
library(XploRer)
#>
#> Attaching package: 'XploRer'
#> The following object is masked from 'package:stats':
#>
#>     decompose

MTG = read_mtg("https://raw.githubusercontent.com/VEZY/XploRer/master/inst/extdata/simple_plant.mtg")Mutate the MTG to add/recompute node attributes:
MTG%>%
  mutate_mtg(section_surface = pi * ((node$Width / 2)^2), .symbol = "Internode")%>%
  mutate_mtg(s_surf_child_sum = sum(children(node$section_surface),na.rm=TRUE),
             .symbol = "Internode")

print(MTG, ".symbol", "Width","section_surface", "s_surf_child_sum")
#>                    levelName    .symbol Width section_surface s_surf_child_sum
#> 1 node_1                          Scene    NA              NA               NA
#> 2  °--node_2                 Individual    NA              NA               NA
#> 3      °--node_3                   Axis    NA              NA               NA
#> 4          °--node_4          Internode     1       0.7853982                0
#> 5              ¦--node_5           Leaf     6              NA               NA
#> 6              °--node_6      Internode    NA              NA                0
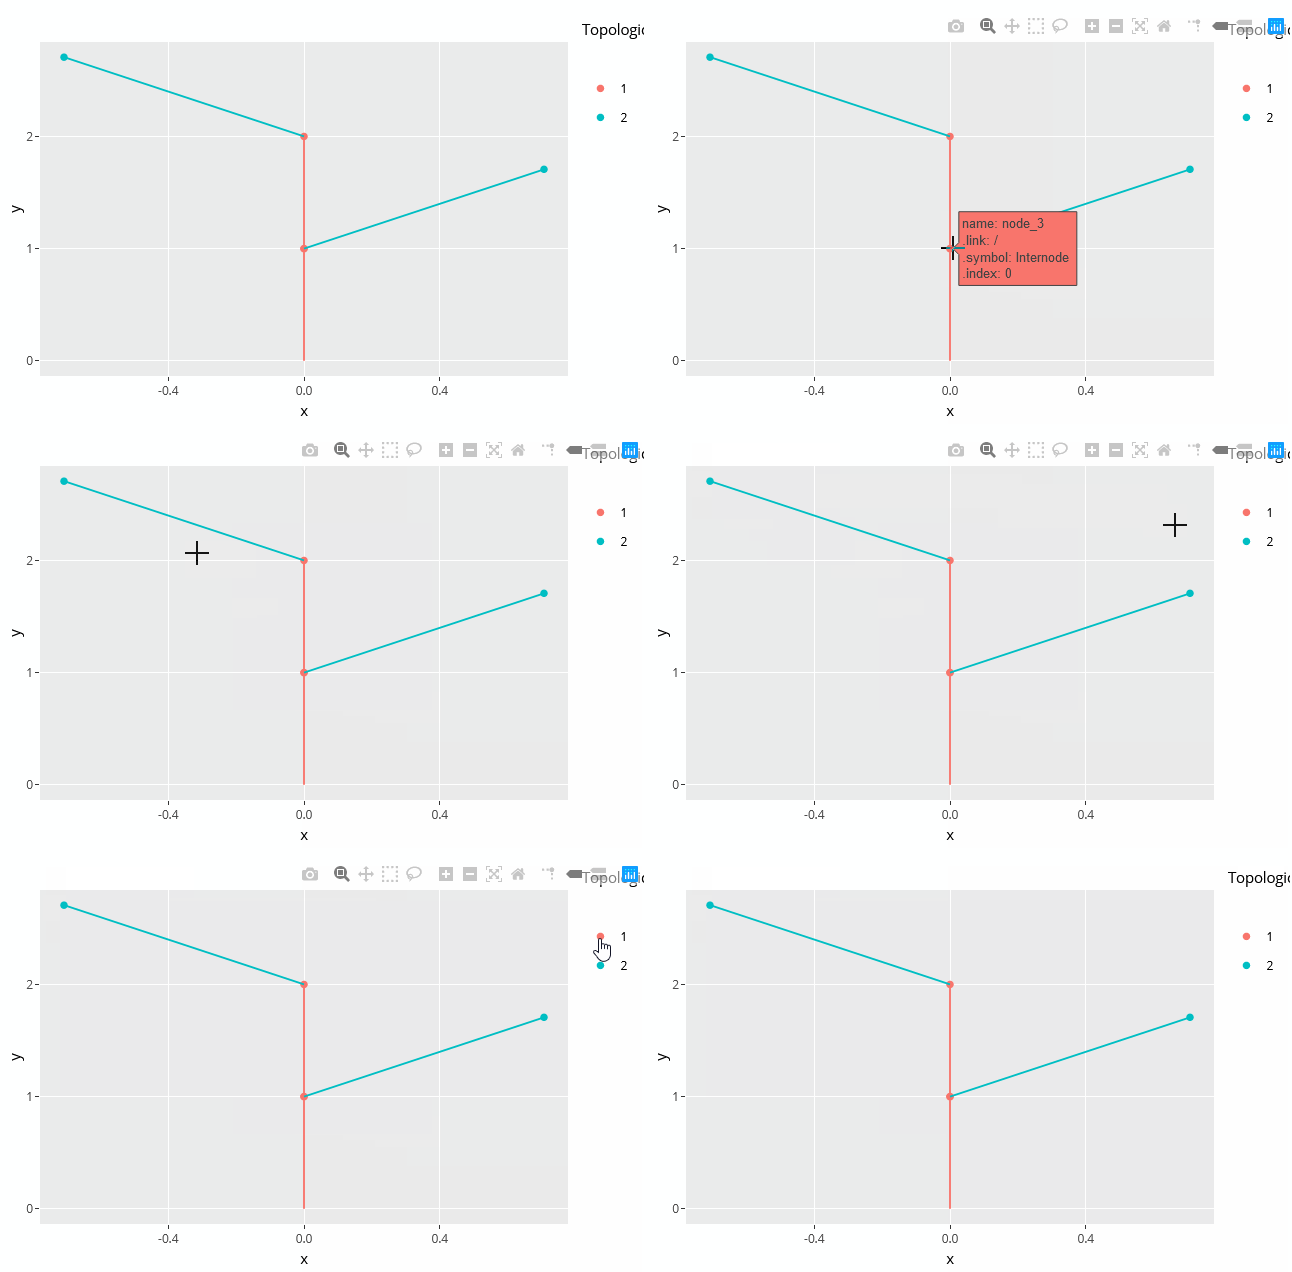
#> 7 °--node_7 Leaf 7 NA NAThe plant topology can be plotted using the autoplot() function. This
function is implemented by ggplot2 so you’ll need to load this package
before-hand:
library(ggplot2)
#> Warning: package 'ggplot2' was built under R version 3.6.3
autoplot(MTG)The same plot can be rendered as an interactive plot using:
plotly_MTG(MTG)Please see the OpenAlea documentation (especially chapter 8) for more details on the MTG files.
If you have any other problem related to the package, please feel free to fill an issue on Github.
Contributions are more than welcome! Whatever your programming level really. If you need help on your first contribution, fill an issue about it.
If you find any issue, want to make a suggestion, or need a new functionality, please fill an issue. This is not more complicated than writing an email (but really simpler for us), just follow the steps one by one. Look into this article for more info.
If you want to contribute, please read our contribution guidelines first. It’s a few minutes read only and guides you through the whole process of contributing (along with many useful tools).
Please note that the XploRer project is released with a Contributor Code of Conduct. By contributing to this project, you agree to abide by its terms.
To do before v1:
-
Make mtg helpers (
parent(),children()andancestors()) use NSE format to homogenize withmutate_mtg() -
Add a “Get started” vignette (add the basic info on what we can do with the package)
-
Update the readme to display only very basic information about the package, and about contributions (very welcome)
-
Add a vignette about mutating the mtg
-
Add a vignette about plotting the mtg (e.g. add attributes on hover)
-
Check the mtg validity:
-
Return the mtg with class data.tree + mtg and remove the sections (not a list anymore). This will make the mtg more usable
-
Read mtg from XLSX
-
Replace node name by .symbol name:
-
Use scale on actual scale, and add a new filter for symbol.
-
Put back the scene node
In a more distant future (v2):
-
Add a vignette about the mtg format, and on the basics (navigate, get value…)
-
Add 3d plotting when geometry attributes are available. Make it compatible with XPlo and OpenAlea.
-
Add an opf (open plant format) parser -> opf to mtg
-
Add an opf writer when the geometry is available (using reference meshes)

