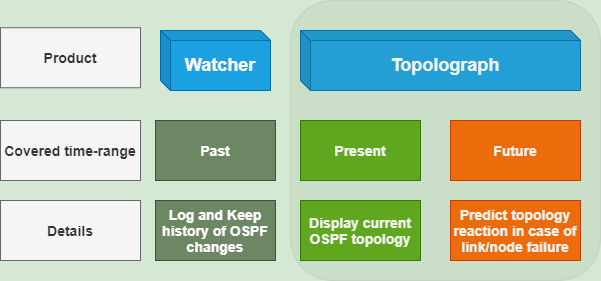
OSPF Watcher is a monitoring tool of OSPF topology changes for network engineers. It works via passively listening to OSPF control plane messages through a specially established OSPF adjacency between OSPF Watcher and one of the network device. The tool logs OSPF events and/or export by Logstash to Elastic Stack (ELK), Zabbix, WebHooks and Topolograph monitoring dashboard for keeping the history of events, alerting, instant notification. Components of the solution are wrapped into containers, so it can be increadebly fast to start it. The only thing is needed to configure manually - is GRE tunnel setup on the Linux host.
Note
Upvote in issues/12 if you are interested in tracking OSPF topology changes via BGP-LS.
- OSPF neighbor adjacency Up/Down
- OSPF link cost changes
- OSPF networks appeared/disappeared from the topology
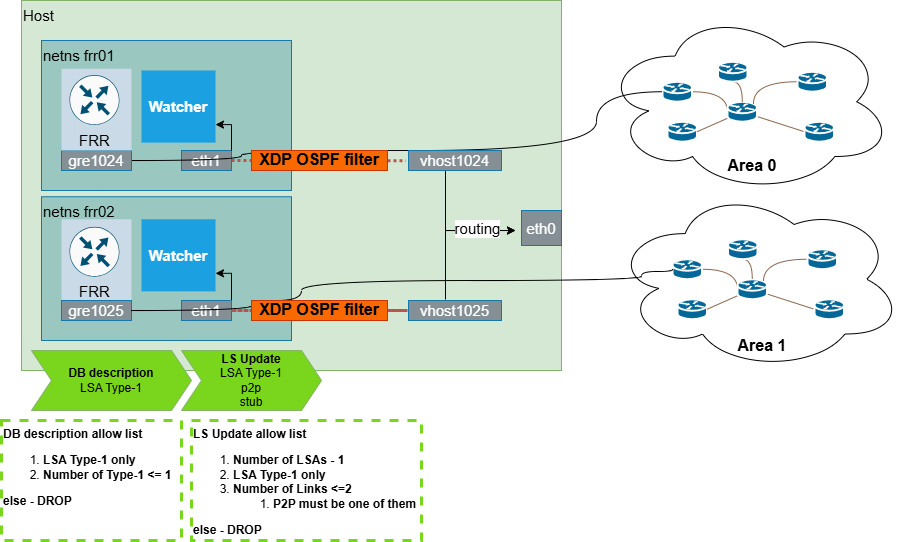
Each Watcher instance maintains all routes and updates within an isolated network namespace. This isolation ensures efficient monitoring without interference and prevent route leaks.
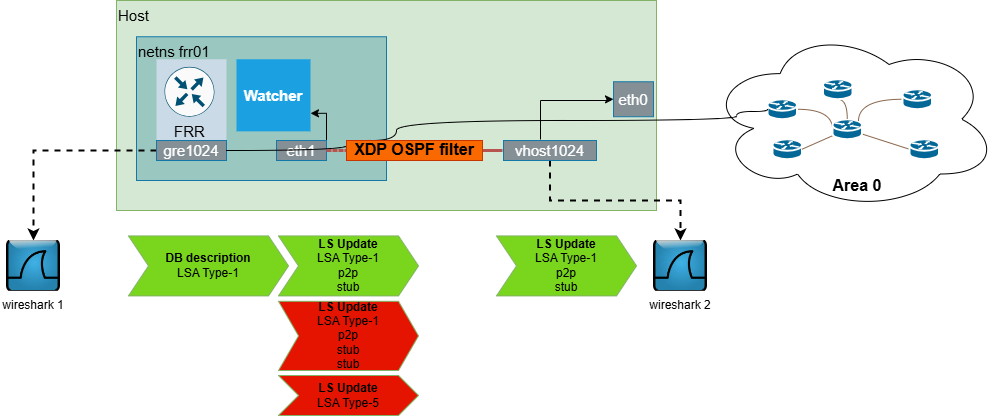
The FRR container is isolated in an individual network namespace and the XDP OSPF filter inspects all outgoing OSPF advertisements. It checks if FRR instance advertises only locally connected network (assigned on GRE tunnel) and no more. If it advertises multiple networks, OSPF Database description (DB) or LSUpdate will be dropped. It prevents the network from populating by unexpected network prefixes.
Note
ospfwatcher:v1.1 is compatible with topolograph:v2.7, it means that OSPF network changes can be shown on the network graph.
Click on the image in order zoom it.

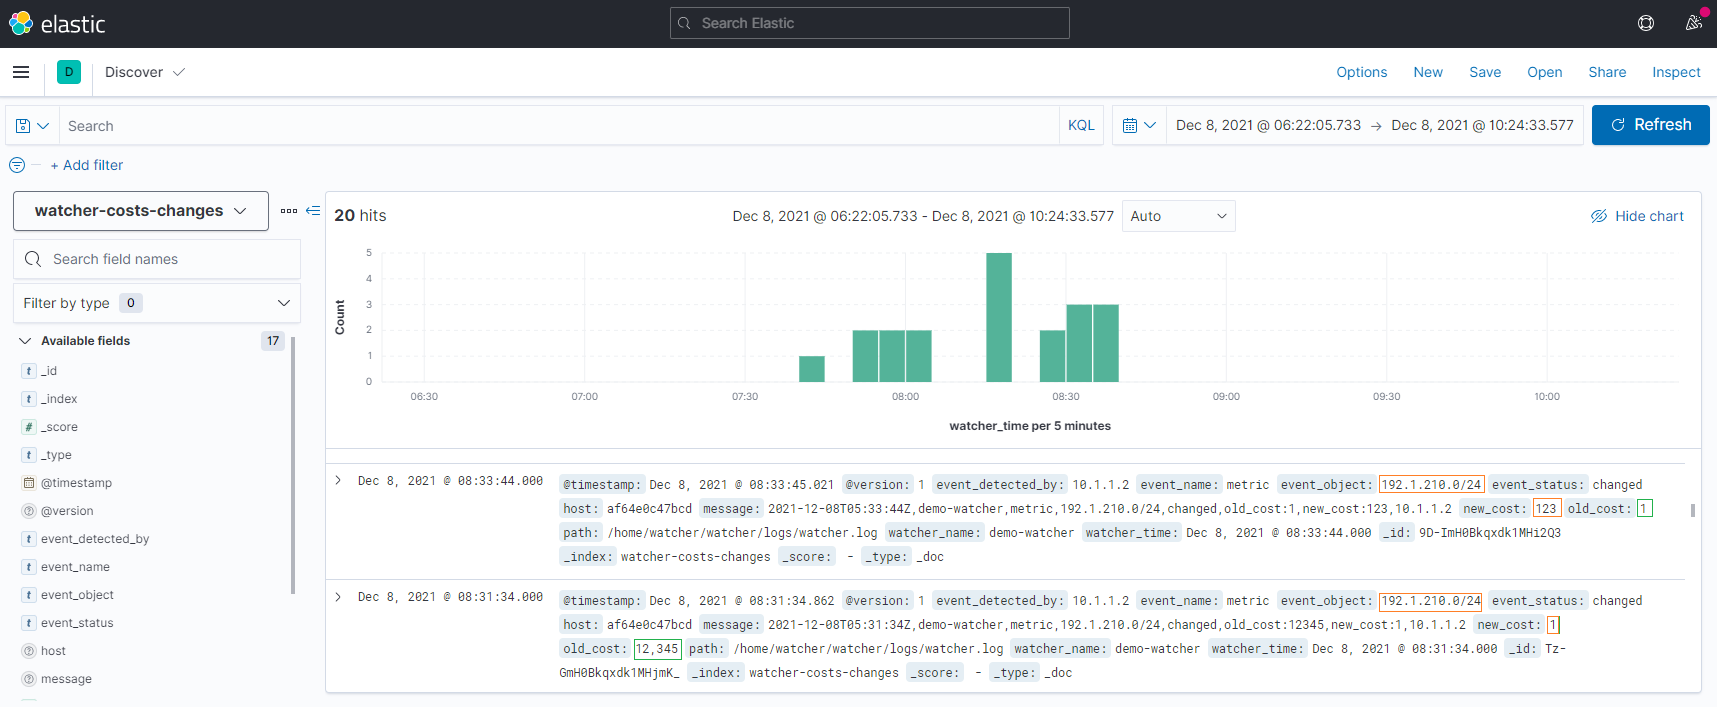
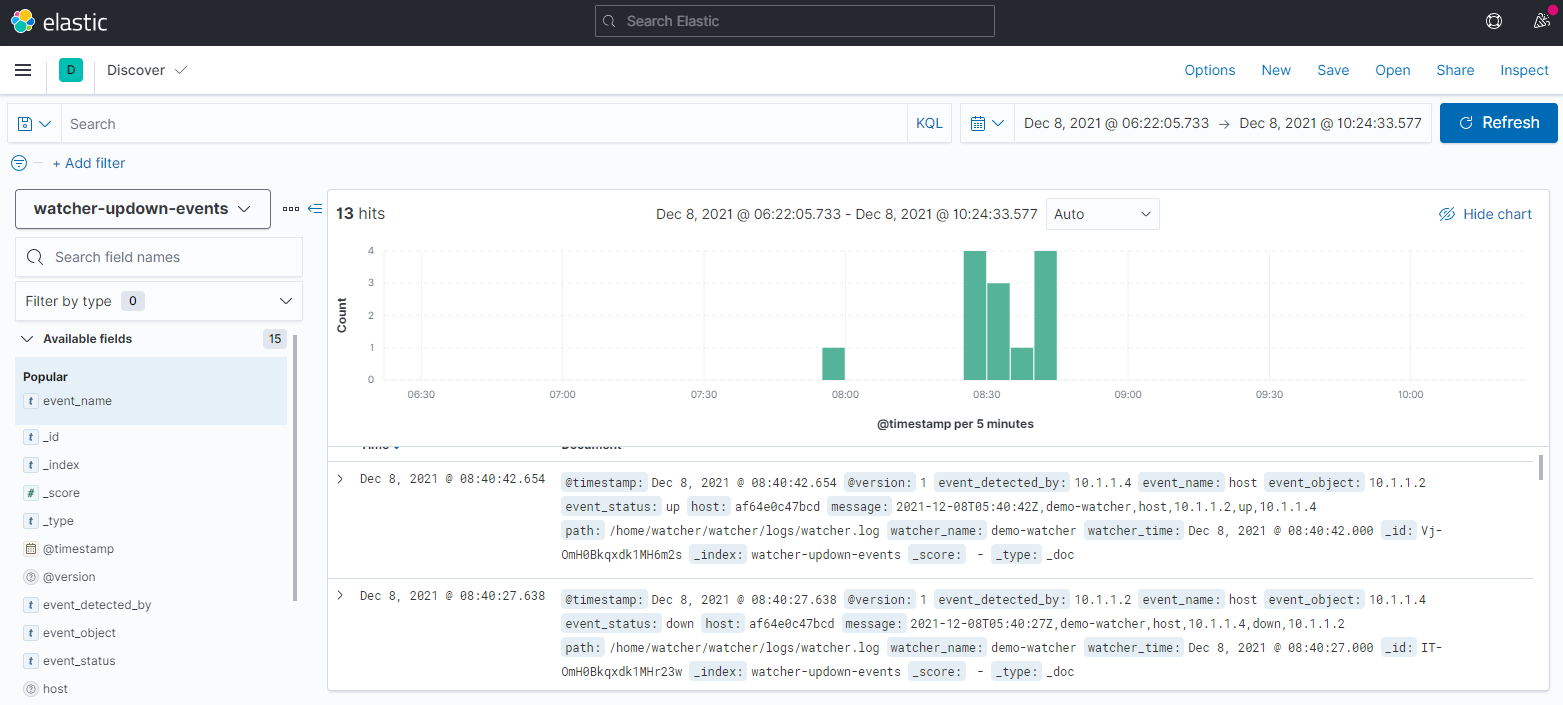
Logs if OSPF adjacency was Up/Down or any networks appeared/disappeared.
Red timelines show link (~adjacency) down events, green one - up link (~adjacency).
Timeline 10.1.1.2-10.1.1.3 has been selected.
Zabbix's dashboard with active OSPF alarms detected by OSPFWatcher

This alarm tracks all new OSPF adjacencies or when device loses its OSPF neighbor

Transit links are all links between active OSPF neighbors. If cost on a link was changed it might affect all actual/shortest paths traffic follows

If a subnet was removed from OSPF node (the node withdrew it from the announcement) it means the network from this node became unavailable for others, this event will be logged too.

HTTP POST messages can be easily accepted by messengers, which allows to get instant notifications of OSPF topology changes:
Here is a lab for tracking OSPF topology changes placed here containerlab/frr01. Watcher logs:
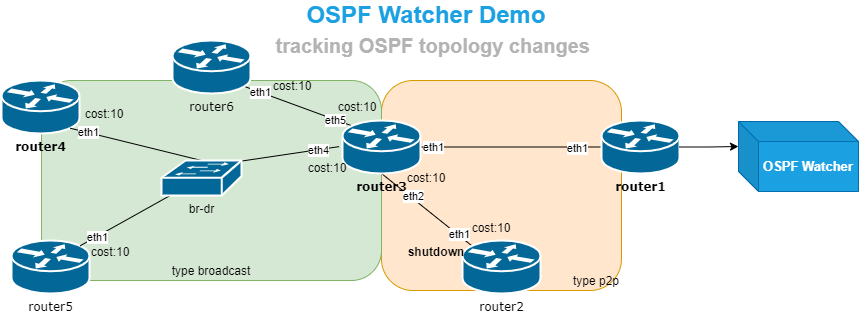
OSPF topology changes are printed by Watcher in a text file only.
./containerlab/frr01/prepare.sh
sudo clab deploy --topo ./containerlab/frr01/frr01.clab.yml
Table below shows different options of possible setups, starting from the bare minimum in case of running Containerlab for testing and ending with maximum setup size with Watcher, Topolograph and ELK. The following setup describes setup №2.
| № | Deployment size | Number of compose files | Text file logs | View changes on network map | Zabbix/HTTP/Messengers notification | Searching events by any field any time |
|---|---|---|---|---|---|---|
| 1 | Bare minimum. Containerlab | 0 | + | - | - | - |
| 2 | 1. Local Topolograph 2. local compose file with ELK disabled (commented) |
2 | + | + | + | - |
| 3 | 1. Local Topolograph 2. local compose file with ELK enabled |
3 | + | + | + | + |
- Choose a Linux host with Docker installed
- Setup Topolograph It's needed for network events visualization on Topolograph UI. Skip if you don't want it.
- launch your own Topolograph on docker using topolograph-docker or make sure you have a connection to the public https://topolograph.com
- create a user for API authentication using
Local Registrationform on the Topolograph page, add your IP address inAPI/Authorised source IP ranges. Set variables in.envfile:
Note
TOPOLOGRAPH_HOST- set the IP address of your host, where the docker is hosted (if you run all demo on a single machine), do not putlocalhost, because ELK, Topolograph and OSPF Watcher run in their private network spaceTOPOLOGRAPH_PORT- by default8080TOPOLOGRAPH_WEB_API_USERNAME_EMAIL- by defaultospf@topolograph.comor put your recently created userTOPOLOGRAPH_WEB_API_PASSWORD- by defaultospfTEST_MODE- if mode isTrue, a demo OSPF events from static file will be uploaded, not from FRR
- Setup ELK (skip it, it's only needed for setup № 3)
- if you already have ELK instance running, fill
ELASTIC_IPin env file and uncomment Elastic config hereospfwatcher/logstash/pipeline/logstash.conf. Currently additional manual configuration is needed for Index Templates creation, becausecreate.pyscript doesn't accept the certificate of ELK. It's needed to have one in case of security setting enabled. Required mapping for the Index Template is inospfwatcher/logstash/index_template/create.py. To create Index Templates, run:
sudo docker run -it --rm --env-file=./.env -v ./logstash/index_template/create.py:/home/watcher/watcher/create.py vadims06/ospf-watcher:latest python3 ./create.py
- if not - boot up a new ELK from docker-elk compose. For demo purporse set license of ELK as basic and turn off security. The setting are in docker-elk/elasticsearch/config/elasticsearch.yml
xpack.license.self_generated.type: basic
xpack.security.enabled: false
Note about having Elastic config commented > When the Elastic output plugin fails to connect to the ELK host, it blocks all other outputs and ignores "EXPORT_TO_ELASTICSEARCH_BOOL" value from env file. Regardless of EXPORT_TO_ELASTICSEARCH_BOOL being False, it tries to connect to Elastic host. The solution - uncomment this portion of config in case of having running ELK.
- Setup OSPF Watcher
git clone https://github.com/Vadims06/ospfwatcher.git
cd ospfwatcher
Generate configuration files
vadims06/ospf-watcher:v1.7 includes a client for generating configurations for each Watcher for each OSPF area. To generate individual settings - run the client with --action add_watcher
sudo docker run -it --rm --user $UID -v ./:/home/watcher/watcher/ -v /etc/passwd:/etc/passwd:ro -v /etc/group:/etc/group:ro vadims06/ospf-watcher:latest python3 ./client.py --action add_watcher
Output:
+---------------------------+
|  Watcher Host             |                       +-------------------+
|  +------------+           |                       | Network device    |
|  | netns FRR  |           |                       |                   |
|  |            Tunnel [4]  |                       | Tunnel [4]        |
|  |  gre1   [3]TunnelIP----+-----------------------+[2]TunnelIP        |
|  |  eth1------+-vhost1    |       +-----+         | OSPF area num [5] |
|  |            | Host IP[6]+-------+ LAN |--------[1]Device IP         |
|  |            |           |       +-----+         |                   |
|  +------------+           |                       |                   |
|                           |                       +-------------------+
+---------------------------+
[1]Network device IP [x.x.x.x]:
The script will create:
- a folder under
watcherfolder with FRR configuration underrouterfolder - a containerlab configuration file with network settings
- an individual watcher log file in
watcherfolder.
OSPF routes of each Watcher instance stay isolated in watcher's network namespace. To stop OSPF routes from being installed even in the watcher's network namespace, we the following policy has been applied on the watcher:
# quagga/config/ospfd.conf
route-map TO_KERNEL deny 200
exit
!
ip protocol ospf route-map TO_KERNEL- Start OSPF Watcher
Install containerlab To start the watcher run the following command.clab deployis like adocker compose up -dcommand
sudo clab deploy --topo watcher/watcher1-tun1025/config.yml
It will create:
- Individual network namespace for Watcher and FRR
- A pair of tap interfaces to connect the watcher to Linux host
- GRE tunnel in Watcher's namespace
- NAT settings for GRE traffic
- FRR & Watcher instance
- assign XDP OSPF filter on watcher's tap interface
- Setup GRE tunnel from the network device to the host. An example for Cisco
Note
You can skip this step and run ospfwatcher intest_mode, so test LSDB from the file will be taken and test changes (loss of adjacency and change of OSPF metric) will be posted in ELK
interface gigabitether0/1
ip address <GRE tunnel ip address>
tunnel mode gre
tunnel source <router-ip>
tunnel destination <host-ip>
ip ospf network type point-to-point
Set GRE tunnel network where is placed to quagga/config/ospfd.conf
Check OSPF neighbor, if there is no OSPF adjacency between network device and OSPF Watcher, check troubleshooting OSPF Watcher <-> Network device connection section below (to run diagnostic script).
7. Start log export to Topolograph and/or ELK (optionally if you configured Step 2 or 3)
docker-compose build
docker-compose up -d
-
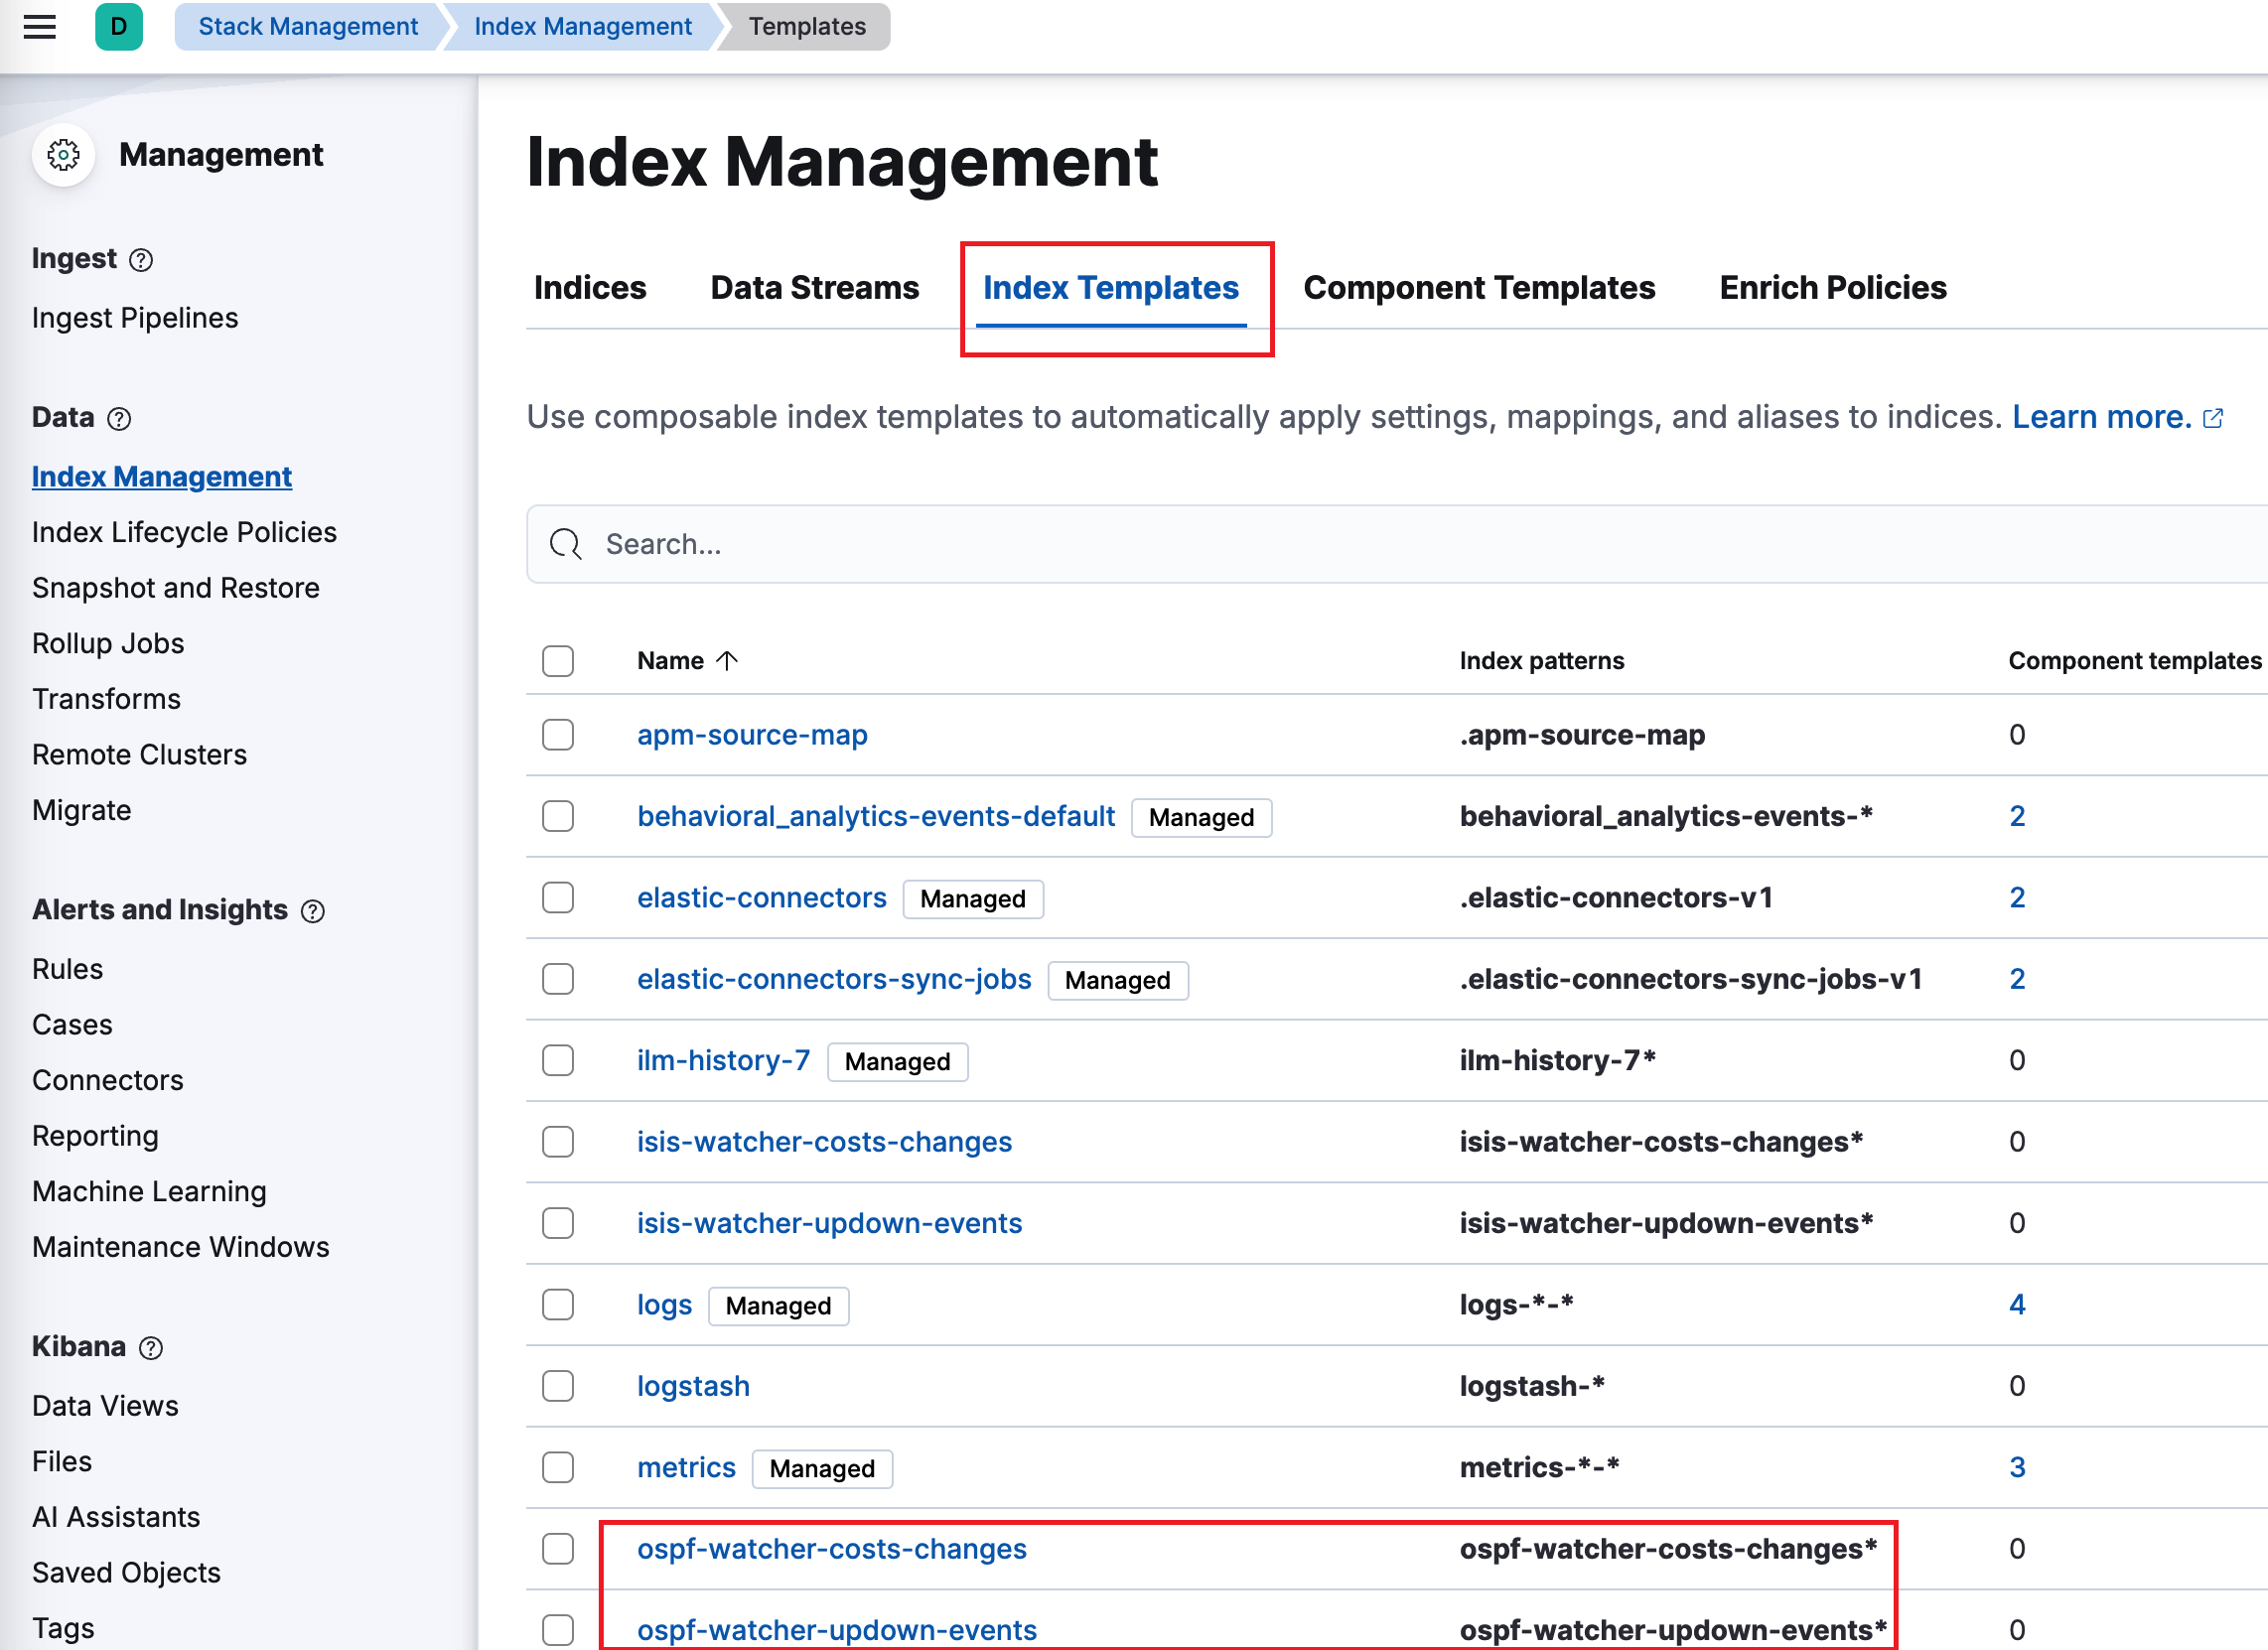
Index Templates Have been already created by
logstash-index-creatorcontainer in compose yaml file. OpenManagement -> Stack Management -> Index Management ->[ Index Templates ]to make sure that the following templates are in the list: -
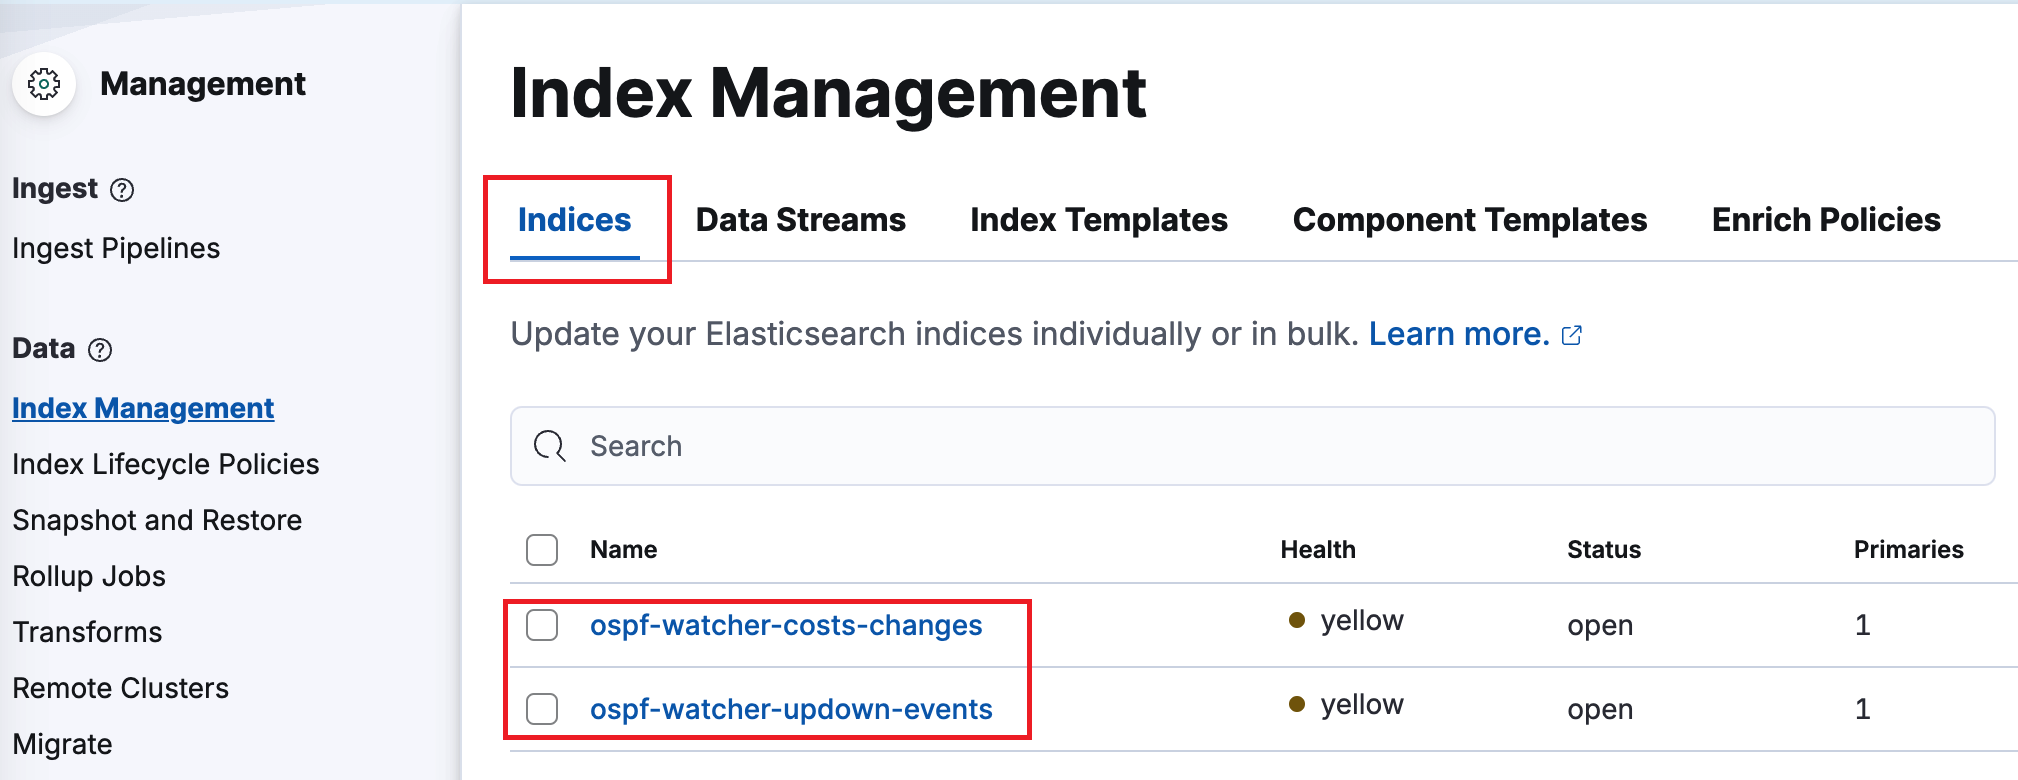
Index Pattern Create indices with the same name as index templates Go to: old ELK
Stack Management/ Kibana/ Stack Management/ Index Pattern -> Create index patternnew ELK 8.xManagement -> Stack Management -> Index Management -> [ Indices ]then
Create index -
Data View Create data view for two event types. Go to
Management -> Stack Management -> Data ViewsthenCreate data viewName: ospf-watcher-costs-changes Index pattern: ospf-watcher-costs-changes Timestamp field: use watcher time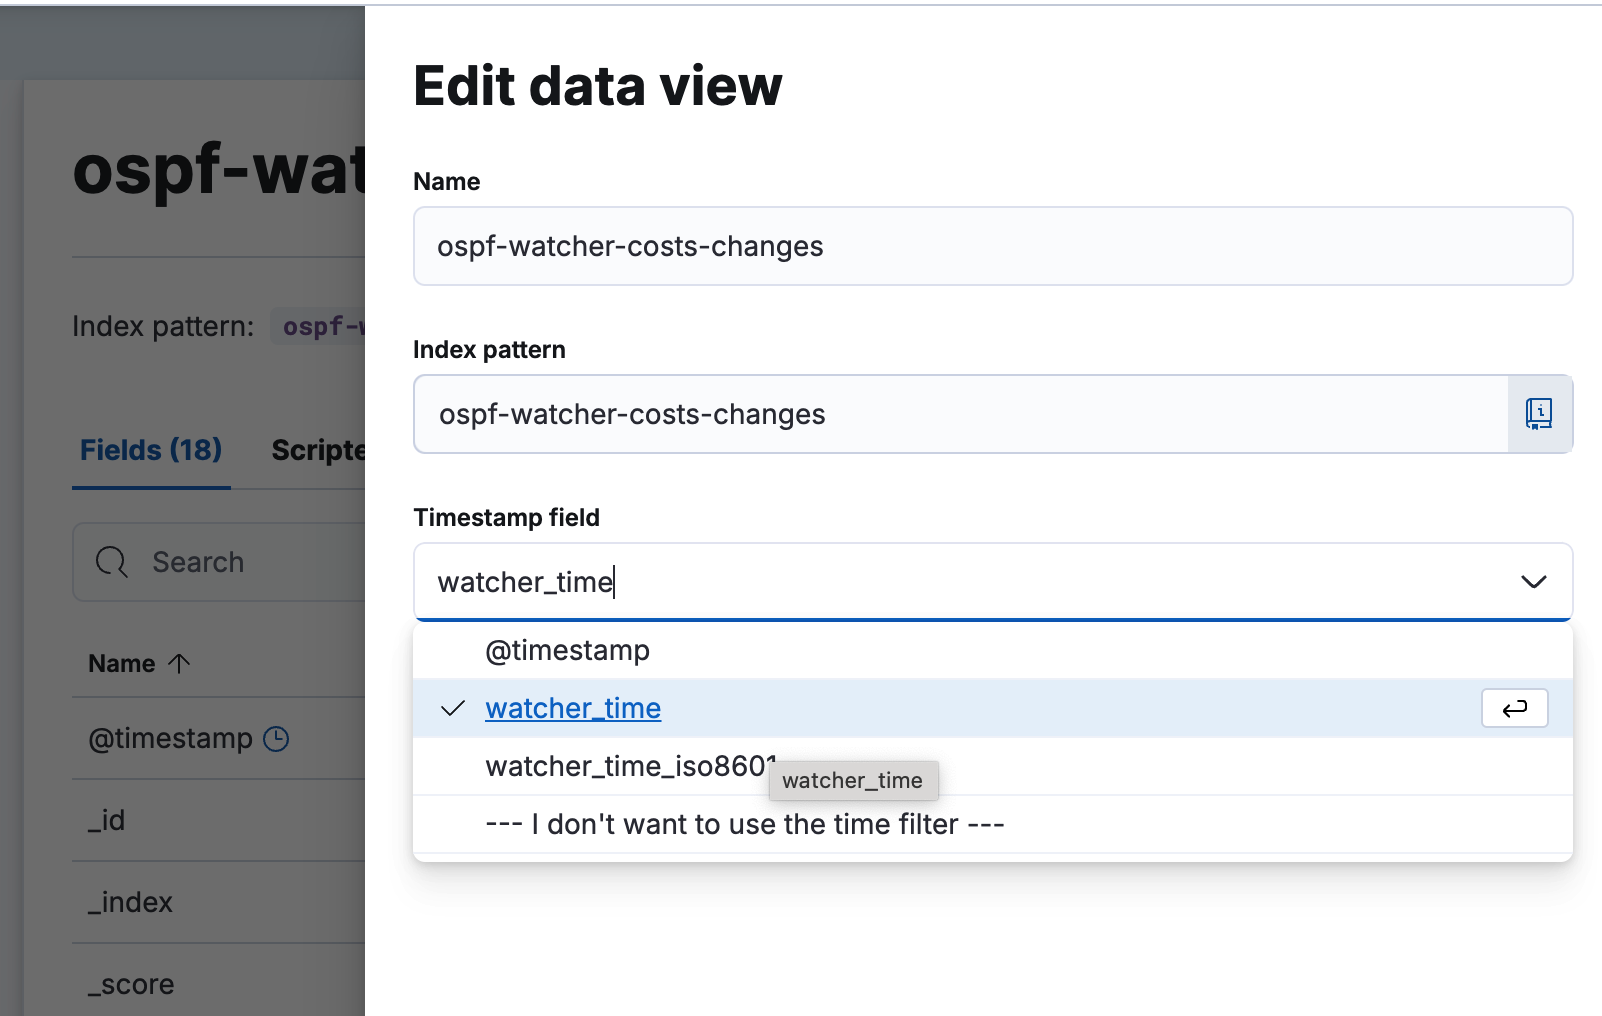
Repeat the same forospf-watcher-updown-eventsAs a result, there are two data views should be listed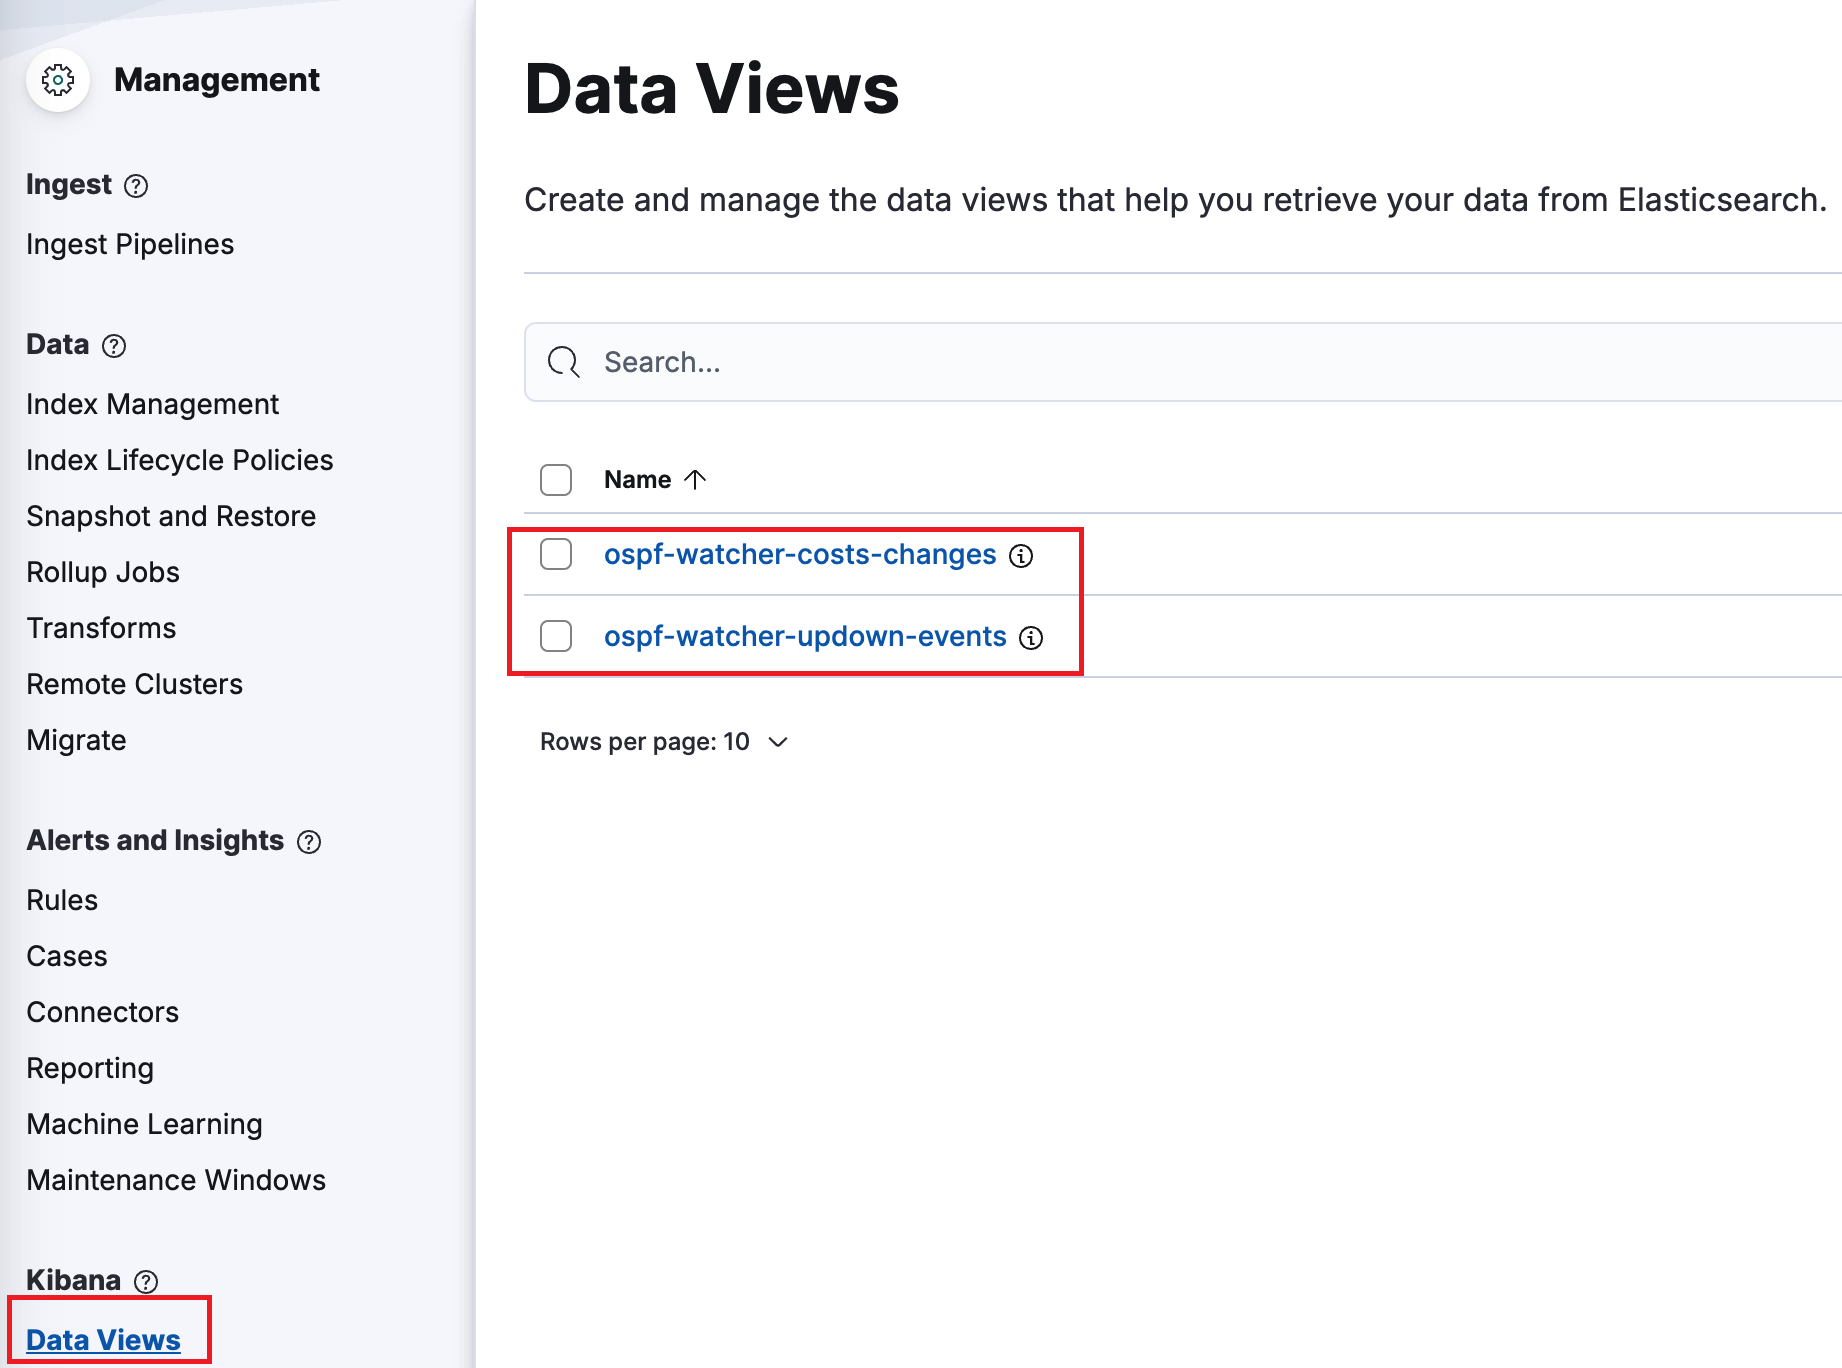
Note What time to use @timestamp or watcher
It's better to use watcher time, because connection between Watcher and Logstash can be lost, but the watcher continues to log all topology changes with the correct time. When the connection is repaired, all logs will be added to ELK and you can check the time of the incident. If you choose @timestamp - the time of all logs will be the time of their addition to ELK.
- Additional checks
Make sure that:
.envhasEXPORT_TO_ELASTICSEARCH_BOOL=True./logstash/pipeline/logstash.confhas ELK uncommented
Your logs are here http://localhost:5601/ -> Analytics/Discover watcher-updown-events.
Zabbix settings are available here /docs/zabbix-ui. There are 4 hosts and items (host and item inside each host has the same names) are required:
- ospf_neighbor_up_down
- ospf_network_up_down
- ospf_link_cost_change
- ospf_stub_network_cost_change
- Create a Slack app
- Enable Incoming Webhooks
- Create an Incoming Webhook (generates URL)
- Uncomment
EXPORT_TO_WEBHOOK_URL_BOOLin.env, set the URL toWEBHOOK_URL
2023-01-01T00:00:00Z,demo-watcher,host10.10.10.4,down,10.10.10.5,01Jan2023_00h00m00s_7_hosts
2023-01-01T00:00:00Z- event timestampdemo-watcher- name of watcherhost- event name:host,network,metric10.10.10.4- event object. Watcher detected an event related to10.10.10.4hostdown- event status:down,up,changed10.10.10.5- event detected by this node.01Jan2023_00h00m00s_7_hosts- name of graph in Topolograph dashboard Summary:10.10.10.5detected that10.10.10.4host went down at2023-01-01T00:00:00Z
2023-01-01T00:00:00Z,demo-watcher,network,192.168.13.0/24,changed,old_cost:10,new_cost:12,10.10.10.1,01Jan2023_00h00m00s_7_hosts,0.0.0.0,1234,internal,0
2023-01-01T00:00:00Z- event timestampdemo-watcher- name of watchermetric- event name:host,network,metric192.168.13.0/24- event object. Watcher detected an event related to192.168.13.0/24subnetchanged- event status:down,up,changed10- old cost12- new cost10.10.10.1- event detected by this node.01Jan2023_00h00m00s_7_hosts- name of graph in Topolograph dashboard0.0.0.0- OSPF area ID1234- AS number where OSPF is workinginternal- type of network:internalorexternal0- subtype of network: type-1, type-2 or 0 for internal subnets Summary:10.10.10.1detected that metric of192.168.13.0/24internal stub network changed from10to12at2023-01-01T00:00:00Zin area 0
If, for some reason, an extra network is advertised from Watcher, this announcement will be dropped.
Lab schema: there are two wireshark sessions on the interfaces before (on the left side) and after (on the right side) XDP filter.
This examples shows that 8.8.8.8 prefix was redistributed on Watcher and added into its announcement, but it was dropped by XDP and eventually didn't reach the network.
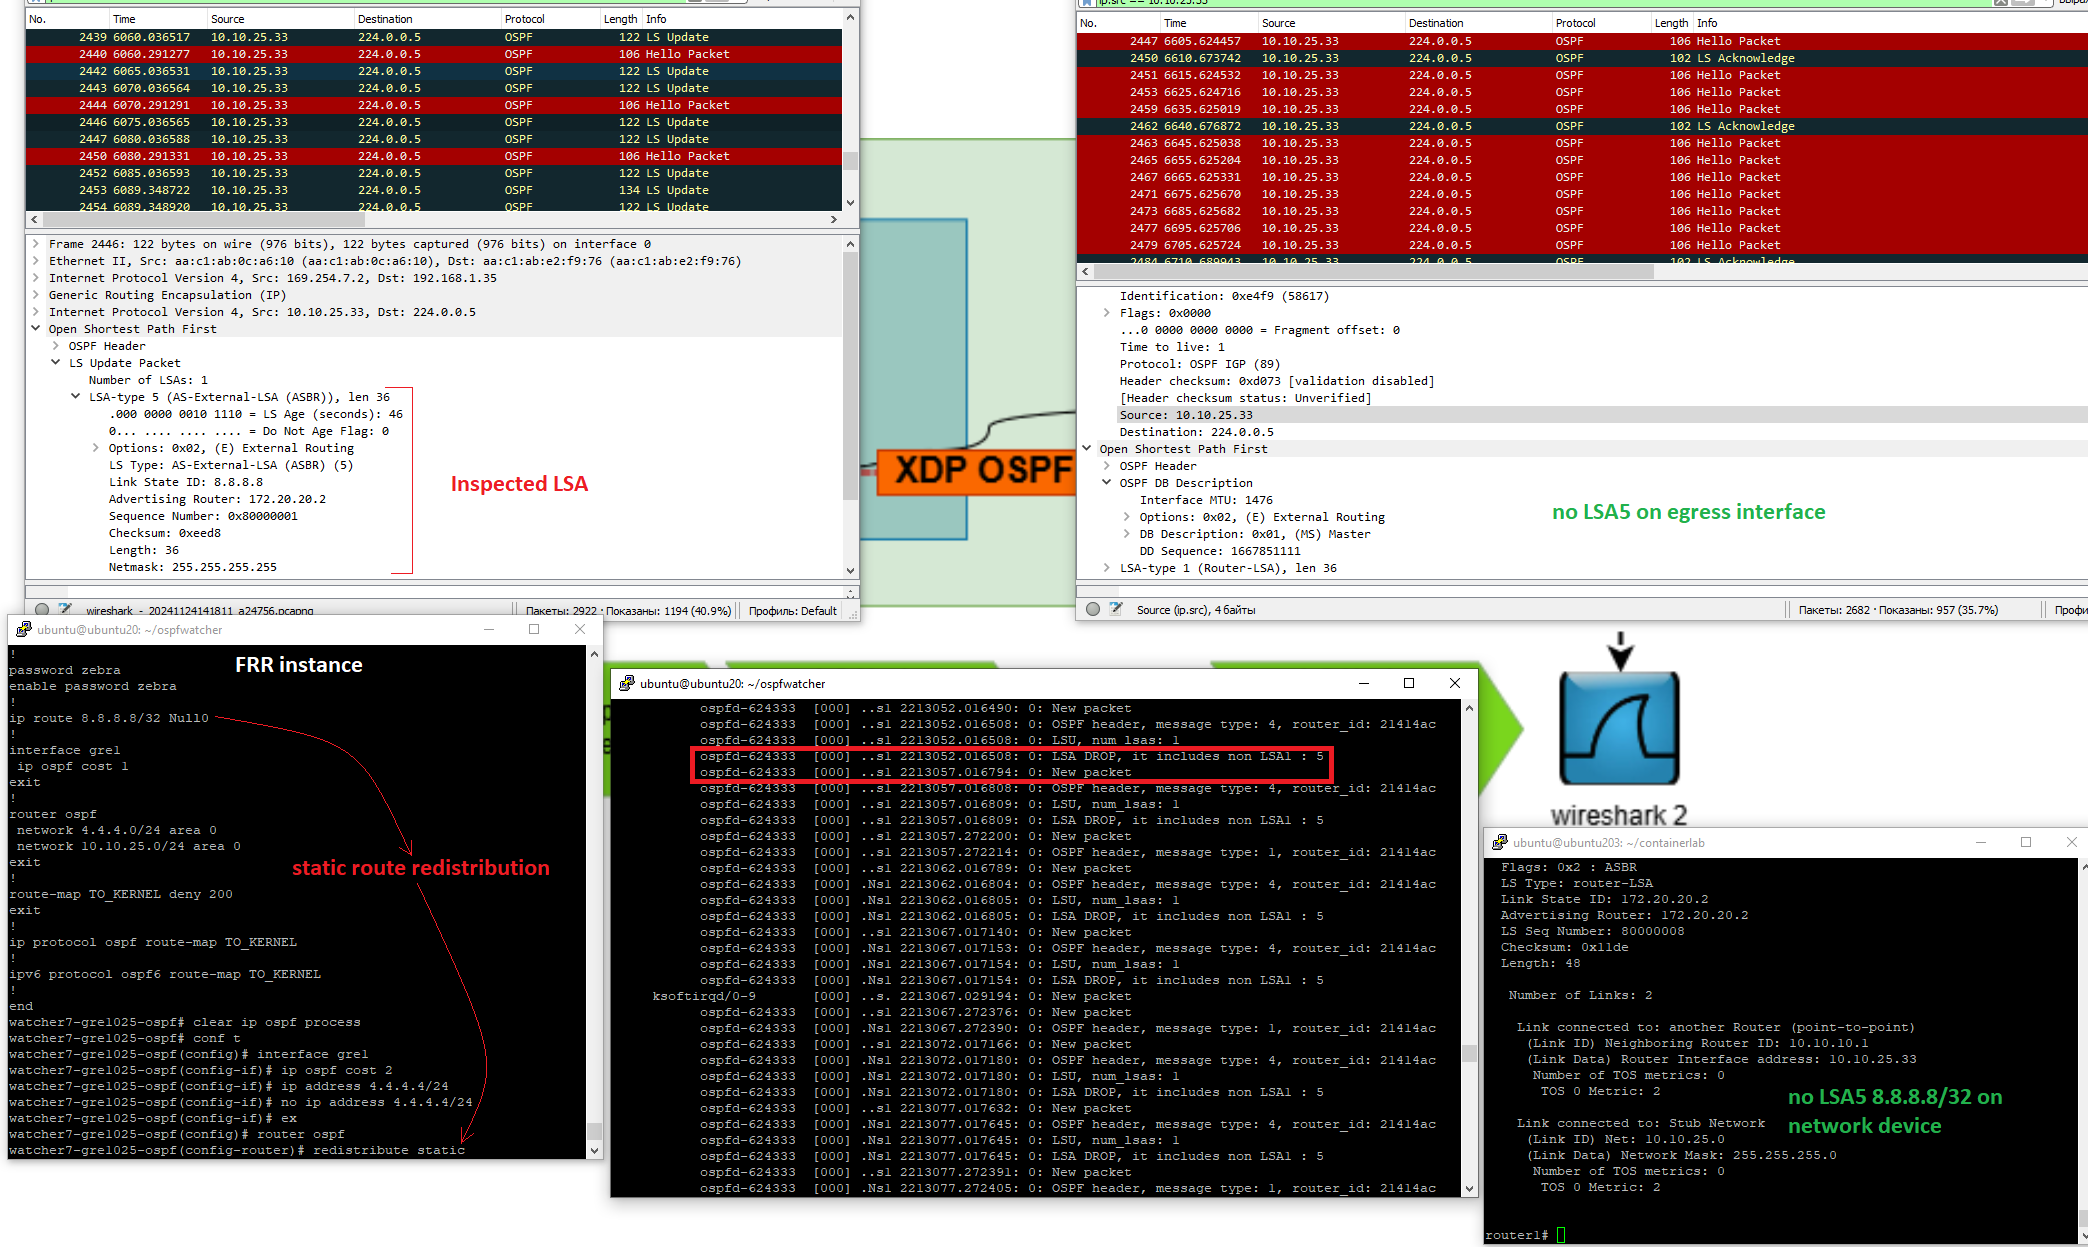
The same logic is applied on Database Description messages
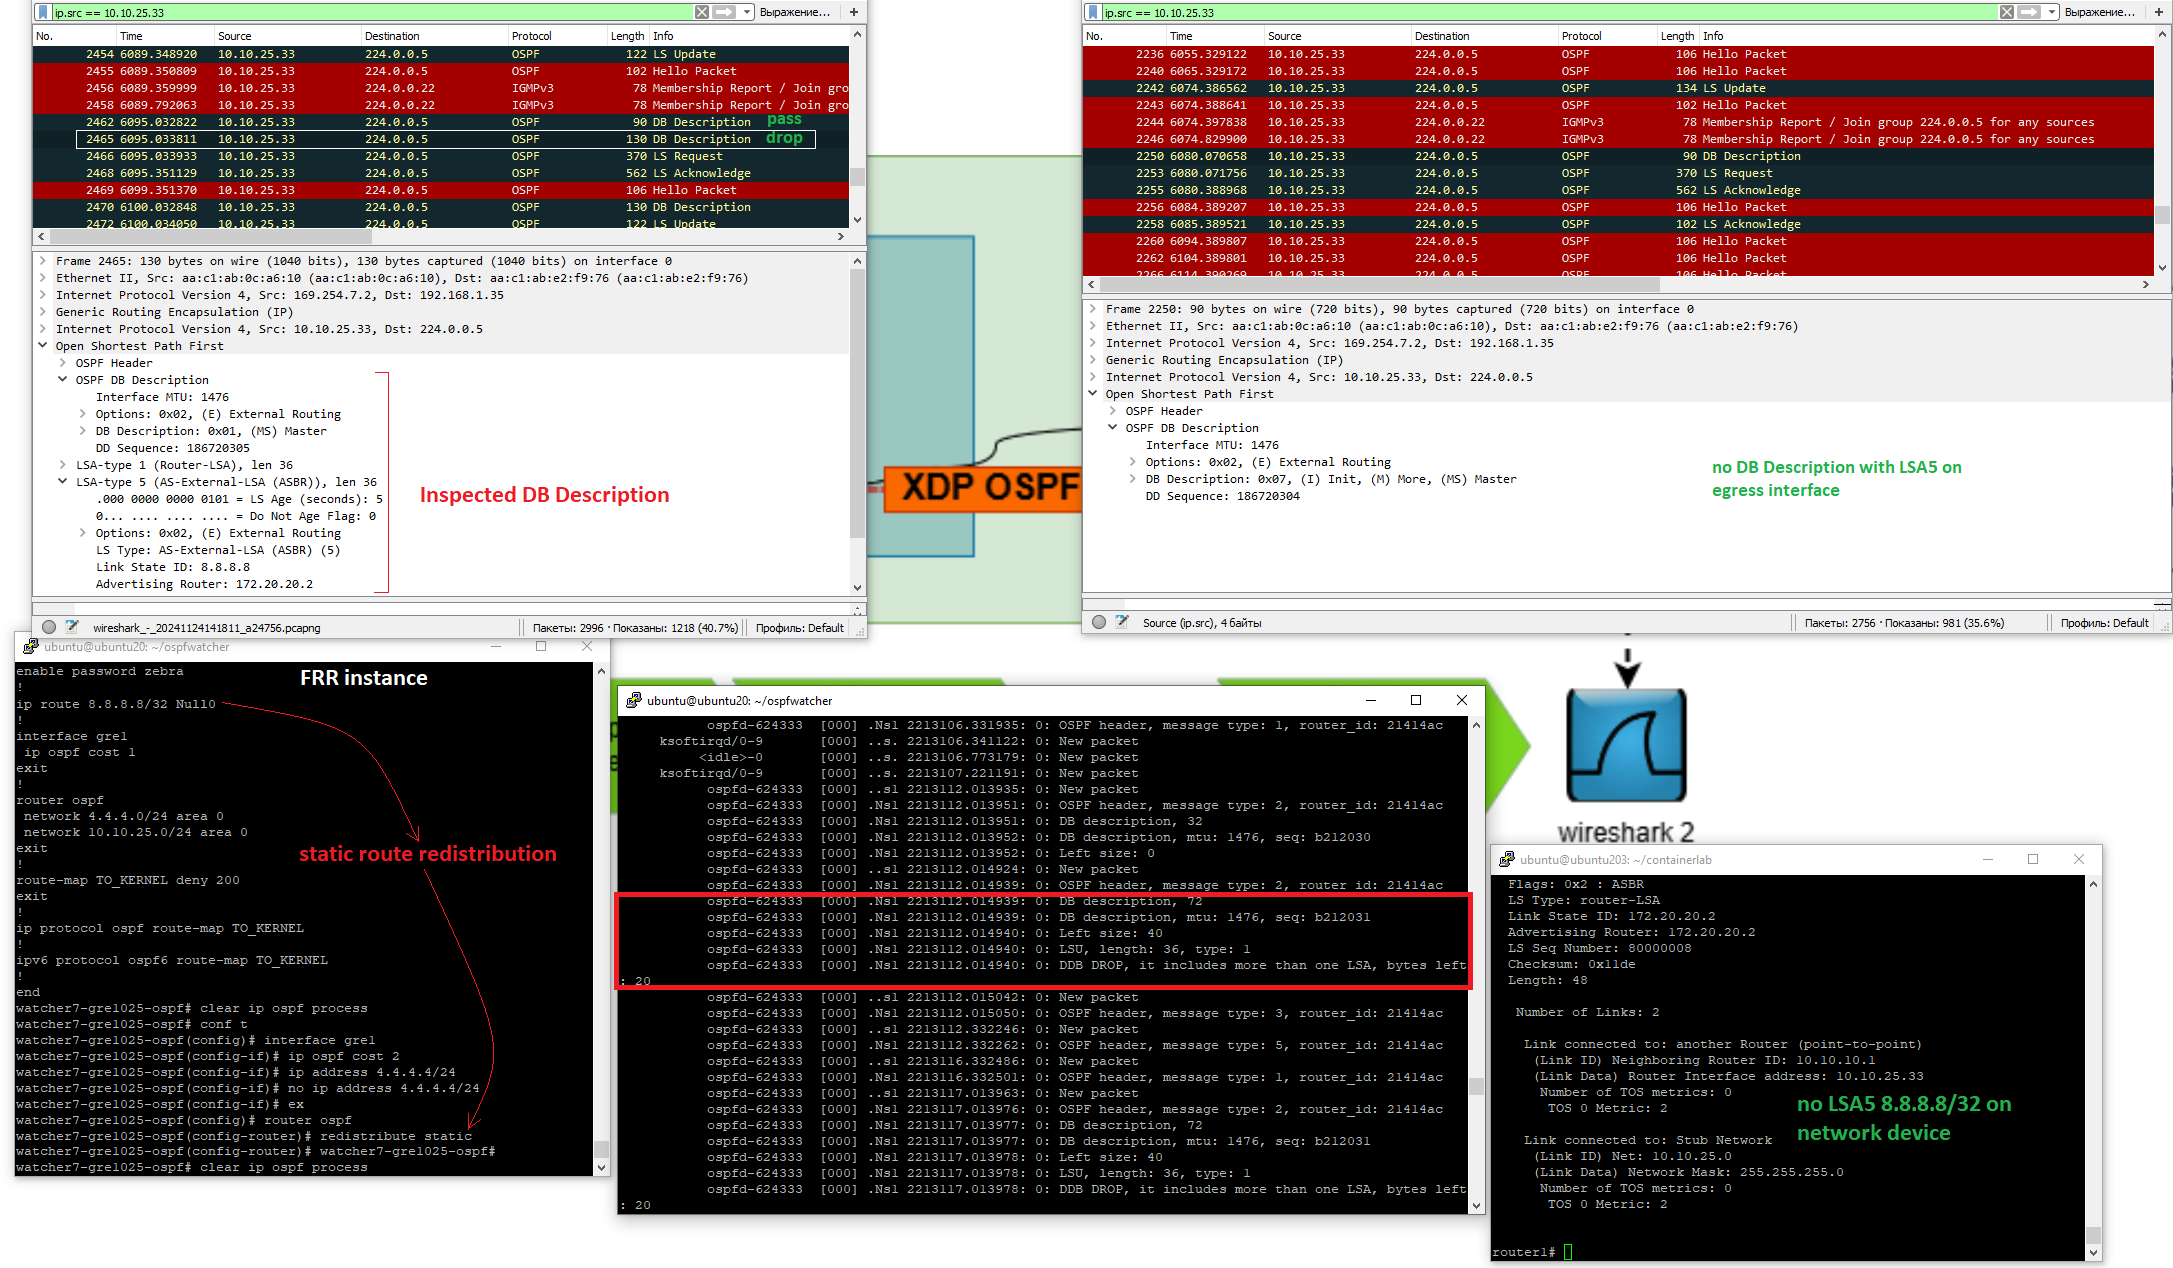 and for extra stub networks in LSA1 Update
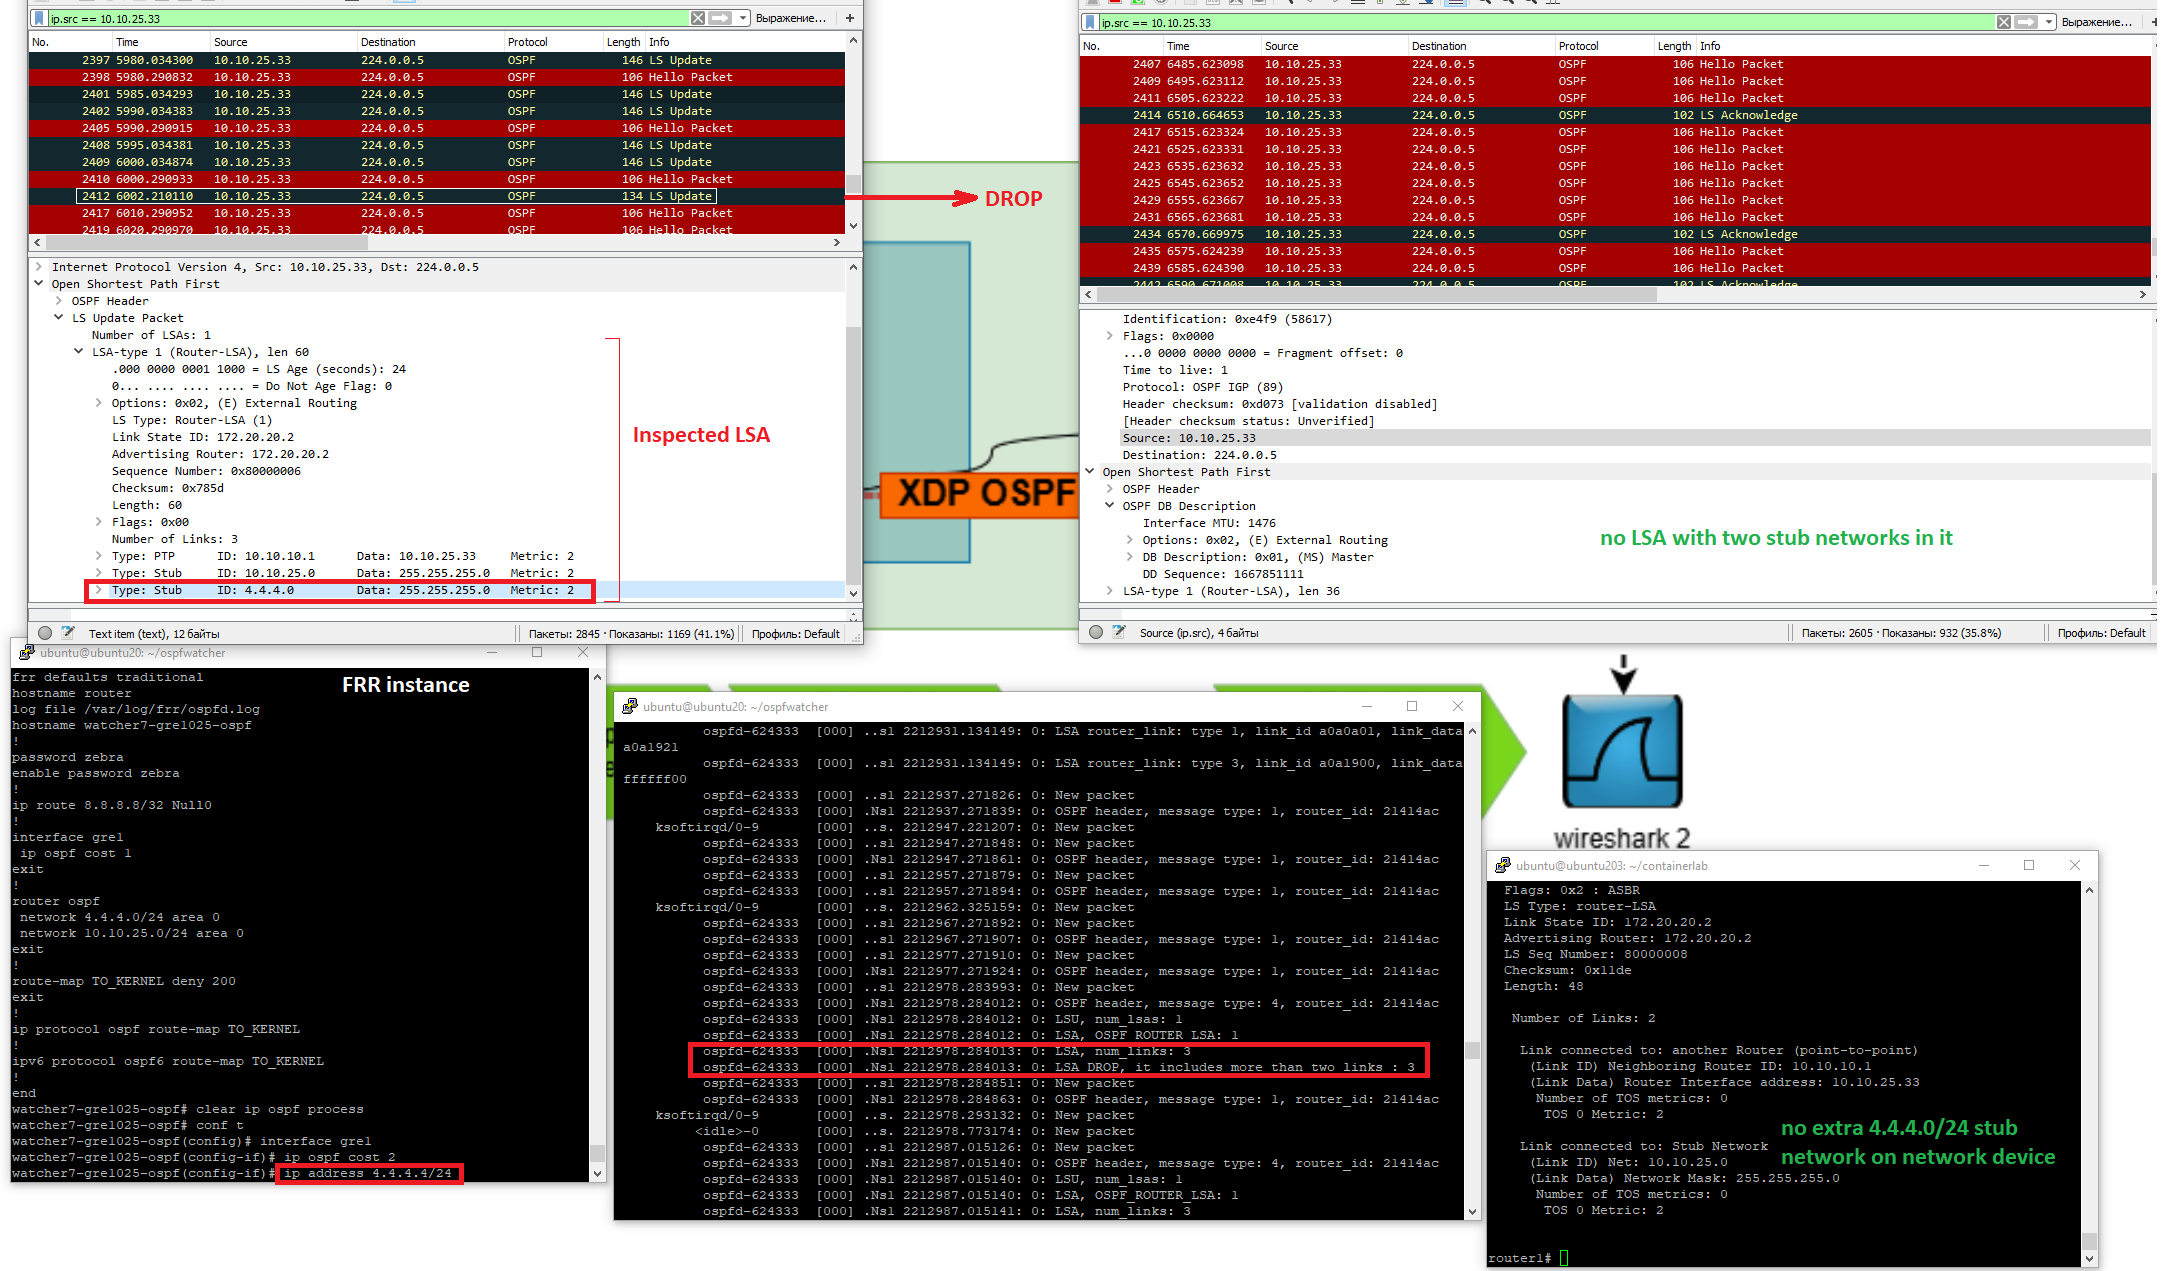 To check XDP logs, run
sudo cat /sys/kernel/debug/tracing/trace_pipe
To check whether XDP filter is assigned on the interface, run
ubuntu20:~/ospfwatcher$ ip l show dev it-vhost1025
178: it-vhost1025@if177: <BROADCAST,MULTICAST,UP,LOWER_UP> mtu 1500 xdp qdisc noqueue state UP mode DEFAULT group default
    link/ether aa:c1:ab:e3:cb:d9 brd ff:ff:ff:ff:ff:ff link-netnsid 0
    prog/xdp id 153 <-- !!!
Networks changes are not tracked. Log file ./watcher/logs/watcher...log is empty.
-
Run diagnostic script. It will check OSPF Watcher <-> Network device connection (iptables, packets from FRR/network device)
sudo docker run -it --rm -v ./:/home/watcher/watcher/ --cap-add=NET_ADMIN -u root --network host vadims06/ospf-watcher:latest python3 ./client.py --action diagnostic --watcher_num <num> -
Login on FRR.
sudo docker exec -it watcher#-gre#-ospf-router vtyshshow ip ospf neighborshould show network device as a neighbor in the output.
Dashboard page is blank. Events are not present on OSPF Monitoring page.
OSPF Watcher consists of three services: OSPFd/FRR [1] -> Watcher [2] -> Logstash [3] -> Topolograph & ELK & Zabbix & WebHooks. Let's start each component one by one.
-
Check if FRR tracks OSPF changes in
./watcher/logs/watcher...logfile (previous case)
You should see tracked changes of your network, i.e. here we see that10.0.0.0/29network went up at2023-10-27T07:50:24Zon10.10.1.4router.2024-07-22T20:24:08Z,watcher-local,network,8.8.0.60/30,changed,old_cost:12,new_cost:-1,10.10.10.5,01Jan2023_00h00m00s_7_hosts,0.0.0.0,65001,external,1 -
Check that logstash container from docker-compose.yml is running via
docker pscommand.- Uncomment
DEBUG_BOOL="True"in.envand start continuous logsdocker logs -f logstash. - Copy and paste the log from the first step in watcher's log file
./watcher/logs/watcher#-gre#-ospf.ospf.log.docker logs -f logstashshould print the output. If not - check logstash container.
- Uncomment
-
Check if logs are in Topolograph's DB. Connect to mongoDB and run:
docker exec -it mongodb /bin/bashInside container (change):
mongo mongodb://$MONGO_INITDB_ROOT_USERNAME:$MONGO_INITDB_ROOT_PASSWORD@mongodb:27017/admin?gssapiServiceName=mongodb
use admin
Check the last two/N records in adjacency changes (
adj_change) or cost changes (cost_change)db.adj_change.find({}).sort({_id: -1}).limit(2) db.cost_change.find({}).sort({_id: -1}).limit(2)Note
If you see a single event indocker logs logstashit means that mongoDB output is blocked, check if you have a connection to MongoDBdocker exec -it logstash curl -v mongodb:27017
Logstach pipeline development. Start logstash container
[ospf-watcher]# docker run -it --rm --network=topolograph_backend --env-file=./.env -v ./logstash/pipeline:/usr/share/logstash/pipeline -v ./logstash/config:/usr/share/logstash/config ospfwatcher_watcher:latest /bin/bash
Inside container run this command:
bin/logstash
It will expect watcher's log file change, so add new log (copy and paste this line) into ./watcher/logs/watcher#-gre#-ospf.ospf.log file
2023-01-01T00:00:00Z,watcher-local,network,10.1.14.0/24,changed,old_cost:10,new_cost:123,10.1.1.4,01Jan2023_00h00m00s_7_hosts,0.0.0.0,12345,internal,0
The output should be:
[INFO ] 2024-05-13 21:15:25.462 [[main]-pipeline-manager] javapipeline - Pipeline started {"pipeline.id"=>"main"}
The stdin plugin is now waiting for input:
[INFO ] 2024-05-13 21:15:25.477 [Agent thread] agent - Pipelines running {:count=>1, :running_pipelines=>[:main], :non_running_pipelines=>[]}
2023-01-01T00:00:00Z,watcher-local,network,10.1.14.0/24,changed,old_cost:10,new_cost:123,10.1.1.4,01Jan2023_00h00m00s_7_hosts,0.0.0.0,12345,internal,0
{
                            "graph_time" => "01Jan2023_00h00m00s_7_hosts",
                     "event_detected_by" => "10.1.1.4",
                           "subnet_type" => "internal",
                        "int_ext_subtype"=> "0",
                                   "asn" => "12345",
                          "watcher_name" => "demo-watcher",
                          "watcher_time" => "2023-01-01T00:00:00Z",
                            "@timestamp" => 2024-05-13T21:15:50.628Z,
                              "old_cost" => "10",
                              "@version" => "1",
                                  "host" => "ba8ff3ab31f8",
                            "event_name" => "network",
                              "new_cost" => "123",
                          "event_object" => "10.1.14.0/24",
                          "event_status" => "changed"
}
Add your changes in ./logstash/pipeline file, stop logstash process via CTRL+C bin/logstash and start it again. Add the same log in the watcher's log file and check how logstash works with your new changes.
7.17.21, this version includes bug fix of issues_281, issues_5115
2.5.0 works, 2.6.0 raises an exception
- https://t.me/topolograph
- admin at topolograph.com
GPL-3.0 license Elastic search was used with Basic ELK license.
