Purpose:
The Stock Market Volatility Prediction System provides valuable insights into future market movements,
empowering users to make informed investment decisions without executing trades directly.
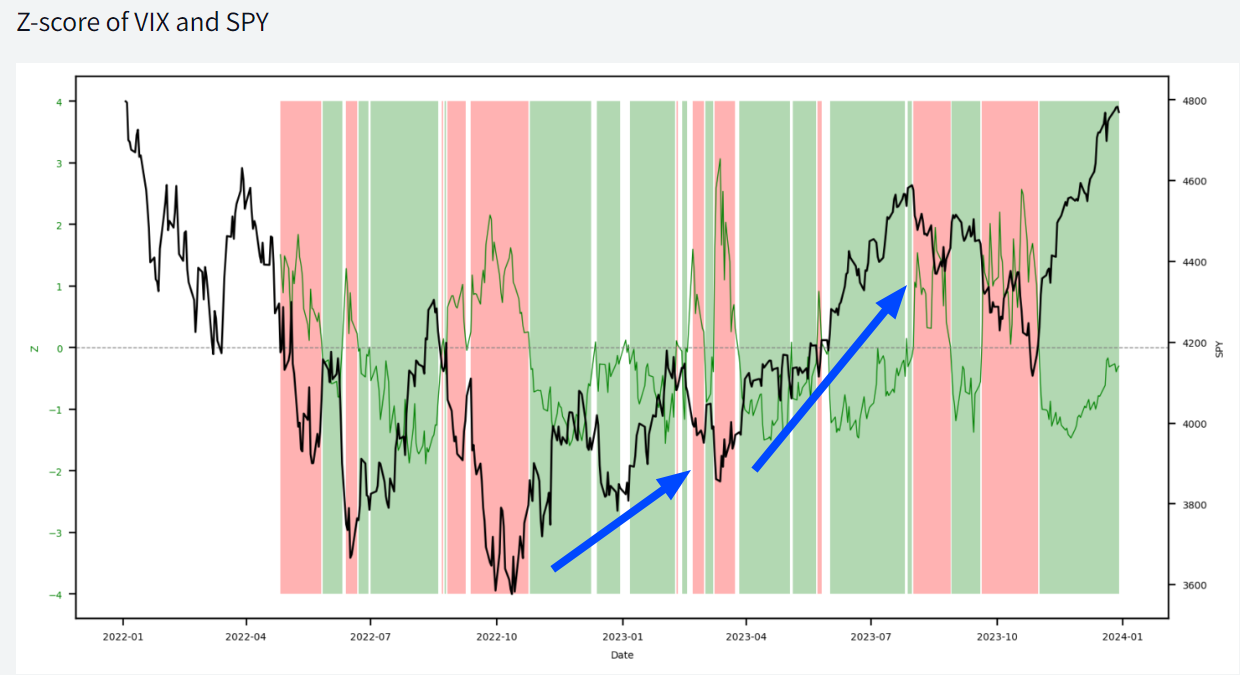
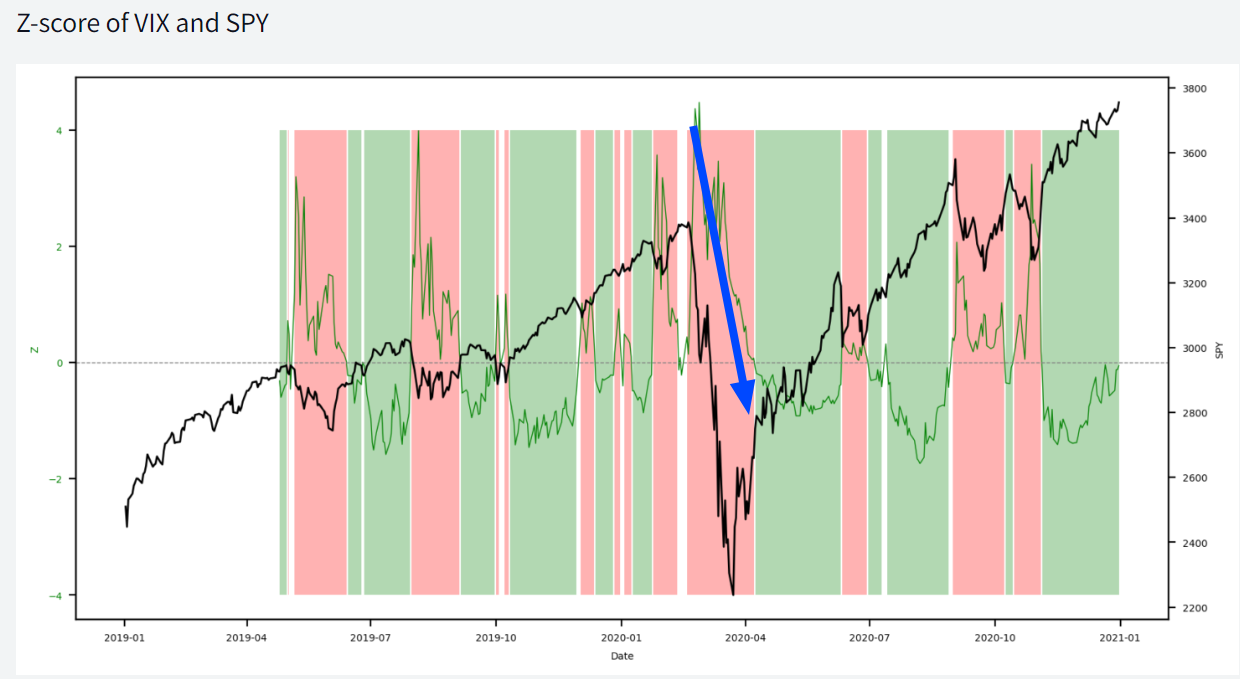
It utilizes the VIX (CBOE Volatility Index) as a crucial indicator for forecasting trends within the SPY (S&P 500 ETF) market.

Key Concepts:
-
Z-Score Definition:
- Z-score is a statistical measure that describes a value's relationship to the mean of a group of values. It quantifies how far a particular data point is from the mean in terms of standard deviations.
-
Interpreting VIX and Z-Score:
-
Decreasing Volatility (Z < 0): Highlighted on the chart with green shades, indicating a more stable market environment. In this scenario, the system suggests that SPY may potentially experience an upward trend.

-
Increasing Volatility (Z > 0): Highlighted on the chart with red shades, signaling potential market turbulence. The system assists users in considering strategies that accommodate potential market downturns.

-
-
Settings:
- TimeFrame: Users can select the timeframe (1 day, 5 days, 1 week, 1 month, 3 months) for analyzing market data.
- Start & End Years: A slider allows users to specify the range of years from which historical market data will be fetched.
- Z Score Length: Users can input the length of the Z-score calculation, influencing the sensitivity of volatility analysis.

-
Investment Strategy Implications:
- Users can use this information to explore investment strategies aligned with potential market improvements or downturns, based on the observed trends in VIX and Z-score dynamics.
How It Works:
-
VIX as a Leading Indicator: The system leverages the VIX to predict trends in the SPY market. Changes in the VIX provide insights into market sentiment and volatility levels.
-
Real-Time Analysis: By monitoring the Z-score, users can assess the current volatility status relative to historical norms, facilitating proactive decision-making.
Target Audience:
-
Investors: Individuals seeking insights into market volatility trends to inform their investment strategies.
-
Financial Analysts: Professionals analyzing market data to forecast potential market movements and adjust their recommendations accordingly.
Conclusion: The Stock Market Volatility Prediction System enhances decision-making capabilities by offering predictive insights derived from the VIX and Z-score analysis. It equips users with valuable information to navigate market conditions effectively, aligning their investment strategies with anticipated market improvements or downturns.